| Param | Original file | Final file |
|---|---|---|
| Filename | modeM0/AS1A03_077T01_9000001372_09638cztM0_level2.evt | modeM0/AS1A03_077T01_9000001372_09638cztM0_level2_quad_clean.evt |
| Size (bytes) | 502,306,560 | 70,479,360 |
| Size | 479.0 MB | 67.2 MB |
| Events in quadrant A | 3,339,974 | 427,568 |
| Events in quadrant B | 3,422,666 | 424,283 |
| Events in quadrant C | 3,294,184 | 425,547 |
| Events in quadrant D | 4,703,180 | 391,666 |
| Mode M9 | |||
|---|---|---|---|
| Quadrant | BADHDUFLAG | Total packets | Discarded packets |
| A | 0 | 25 | 0 |
| B | 0 | 25 | 0 |
| C | 0 | 25 | 0 |
| D | 0 | 25 | 0 |
| Mode SS | |||
|---|---|---|---|
| Quadrant | BADHDUFLAG | Total packets | Discarded packets |
| A | 0 | 136 | 0 |
| B | 0 | 136 | 0 |
| C | 0 | 136 | 0 |
| D | 0 | 136 | 0 |
| Mode M0 | |||
|---|---|---|---|
| Quadrant | BADHDUFLAG | Total packets | Discarded packets |
| A | 0 | 14007 | 3 |
| B | 0 | 14174 | 2 |
| C | 0 | 13976 | 2 |
| D | 0 | 18195 | 2 |
| Quadrant | Total seconds | Saturated seconds | Saturation percentage |
|---|---|---|---|
| A | 6670 | 54 | 0.809595% |
| B | 6670 | 58 | 0.869565% |
| C | 6670 | 66 | 0.989505% |
| D | 6670 | 396 | 5.937031% |
Noise dominated data is calculated using 1-second bins in cleaned event files. If a bin has >2000 counts, and if more than 50% of those come from <1% of pixels, then it is considered to be noise-dominated and hence unusable.
| Quadrant | # 1 sec bins | Bins with >0 counts | Bins with >2000 counts | High rate bins dominated by noise | Noise dominated (total time) | Noise dominated (detector-on time) | Marked lightcurve |
|---|---|---|---|---|---|---|---|
| A | 9120 | 6672 | 1 | 1 | 0.01% | 0.01% | 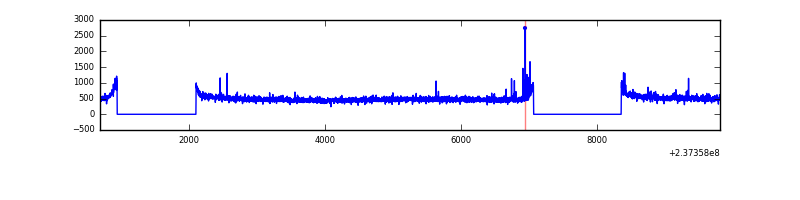 |
| B | 9120 | 6672 | 0 | 0 | 0.00% | 0.00% | 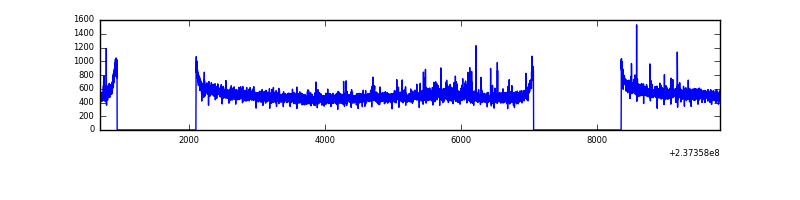 |
| C | 9120 | 6671 | 3 | 3 | 0.03% | 0.04% | 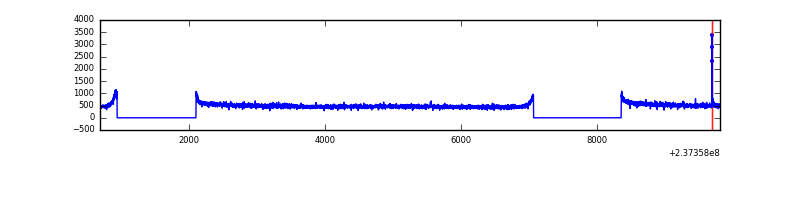 |
| D | 9120 | 6672 | 314 | 314 | 3.44% | 4.71% | 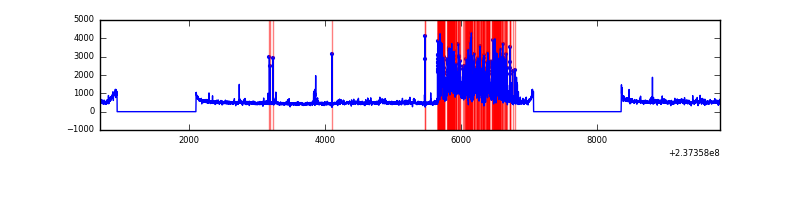 |
Top three noisy pixels from each quadrant. If the there are fewer than three noisy pixels in the level2.evt file, extra rows are filled as -1
| Pixel properties | Quadrant properties | ||||||
|---|---|---|---|---|---|---|---|
| Quadrant | DetID | PixID | Counts | Sigma | Mean | Median | Sigma |
| A | 13 | 248 | 35689 | 201.5 | 858 | 840 | 172.9 |
| A | 0 | 226 | 8095 | 41.95 | 858 | 840 | 172.9 |
| A | 12 | 194 | 6780 | 34.34 | 858 | 840 | 172.9 |
| B | 0 | 214 | 36990 | 223.24 | 861 | 841 | 161.9 |
| B | 12 | 111 | 17543 | 103.15 | 861 | 841 | 161.9 |
| B | 11 | 111 | 14354 | 83.45 | 861 | 841 | 161.9 |
| C | 14 | 234 | 14784 | 72.67 | 840 | 845 | 191.8 |
| C | 13 | 61 | 6347 | 28.68 | 840 | 845 | 191.8 |
| C | 14 | 67 | 3487 | 13.77 | 840 | 845 | 191.8 |
| D | 1 | 52 | 867766 | 4372.18 | 817 | 800 | 198.3 |
| D | 7 | 71 | 270053 | 1357.86 | 817 | 800 | 198.3 |
| D | 13 | 105 | 246369 | 1238.42 | 817 | 800 | 198.3 |
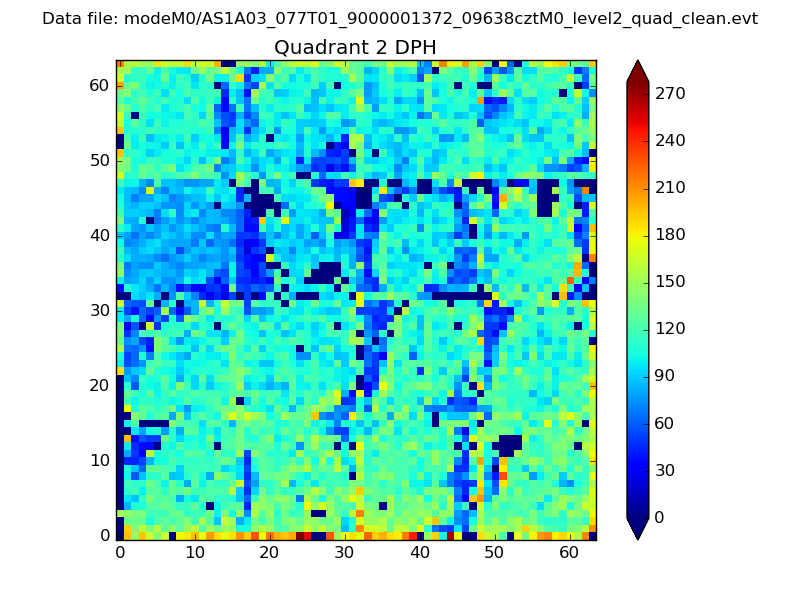
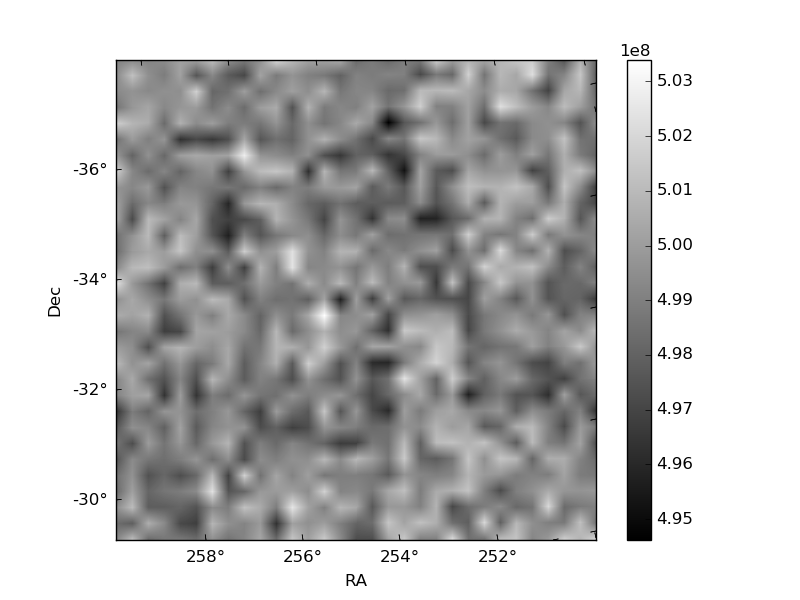
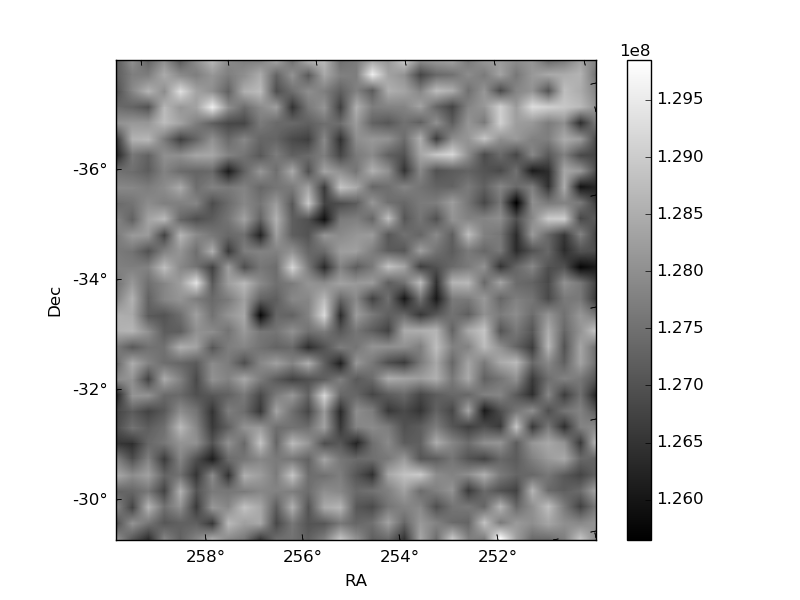
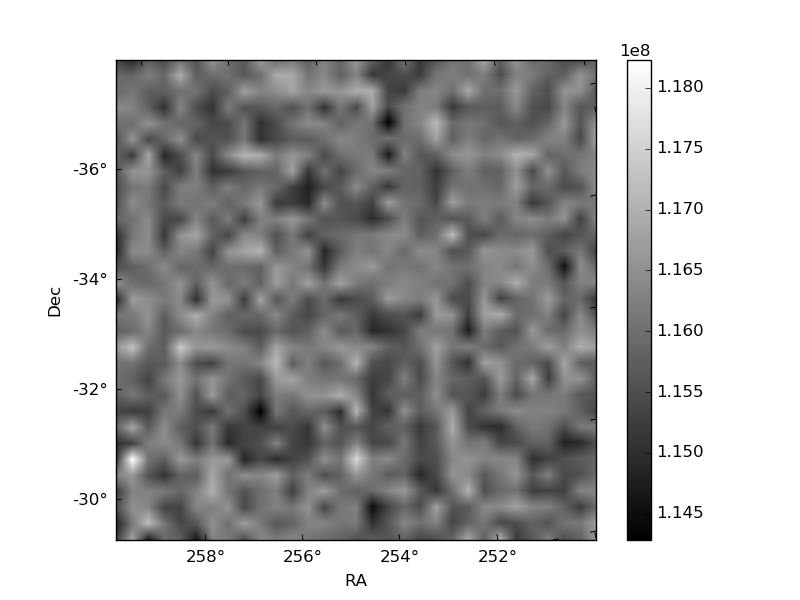
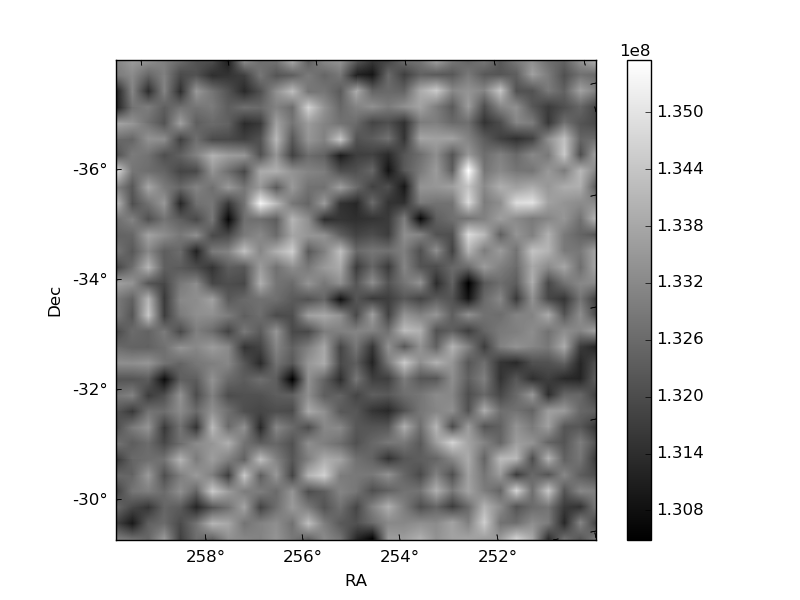
Histogram calculated using DETX and DETY for each event in the final _common_clean file
| Quadrant A | 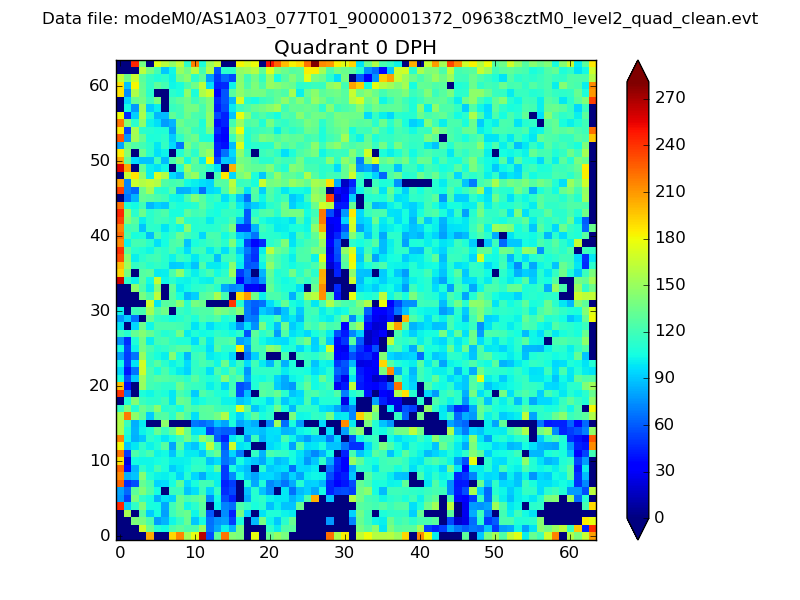 |
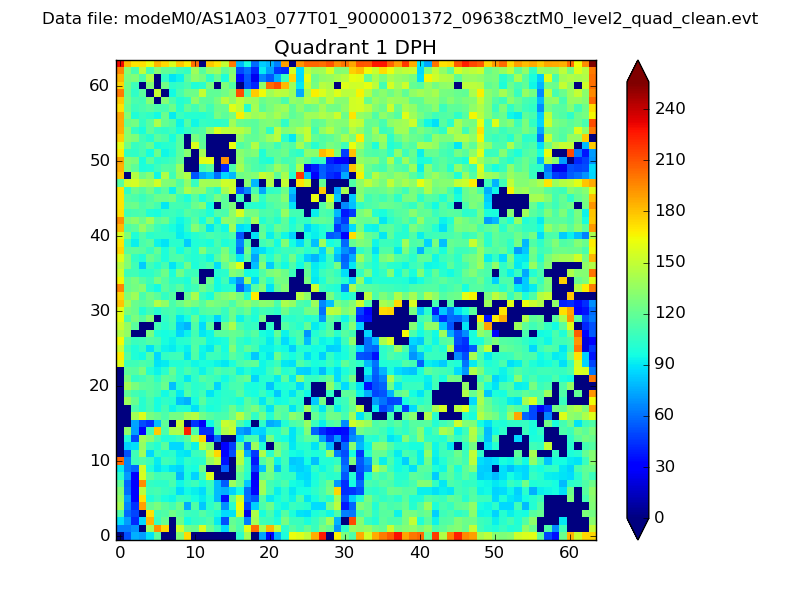 |
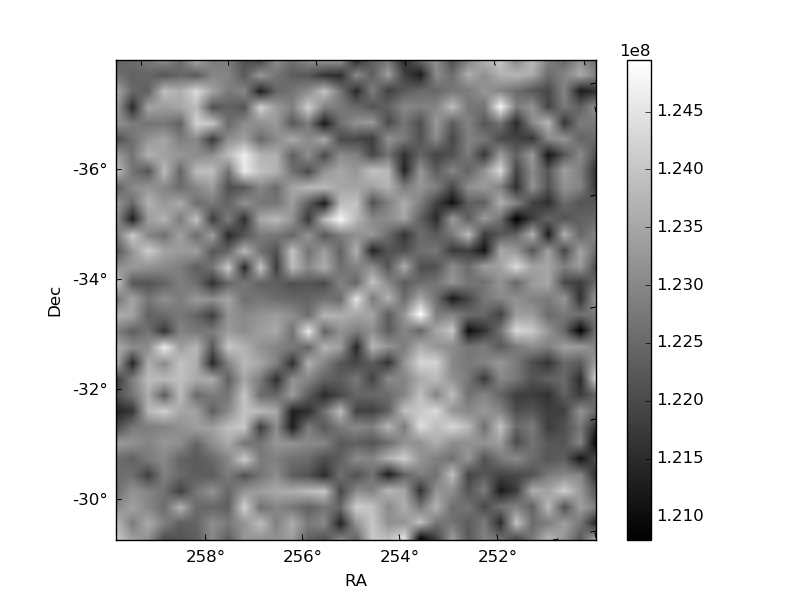
Quadrant B |
|---|---|---|---|
| Quadrant D | 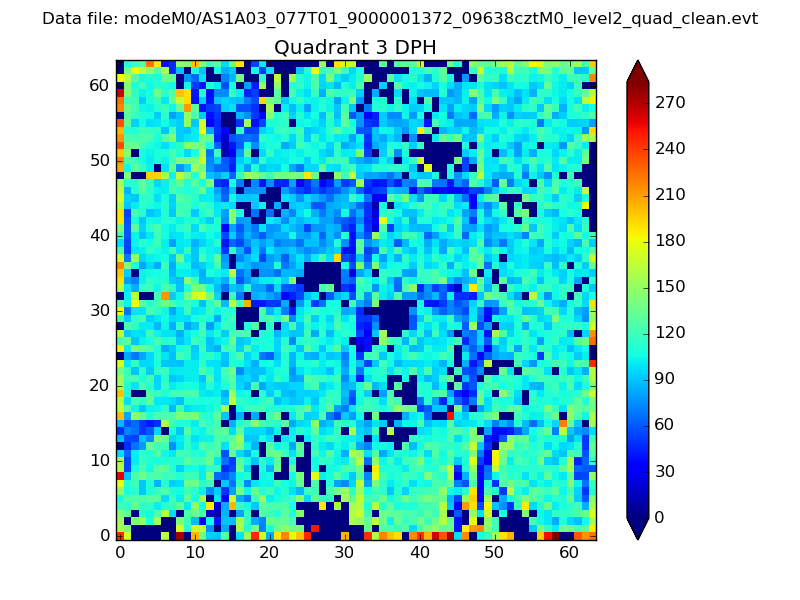 |
 |
Quadrant C |
| Plot type | Count rate plots | Images |
|---|---|---|
| Comparison with Poisson distribution Blue bars denote a histogram of data divided into 1 sec bins. Red curve is a Poisson curve with rate = median count rate of data. |
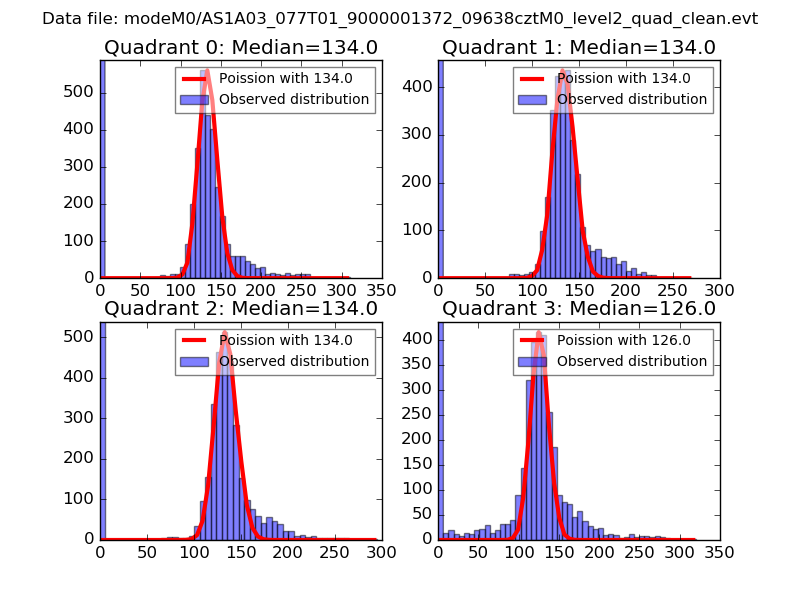 |
 |
| Quadrant-wise count rates Data is divided into 100 sec bins |
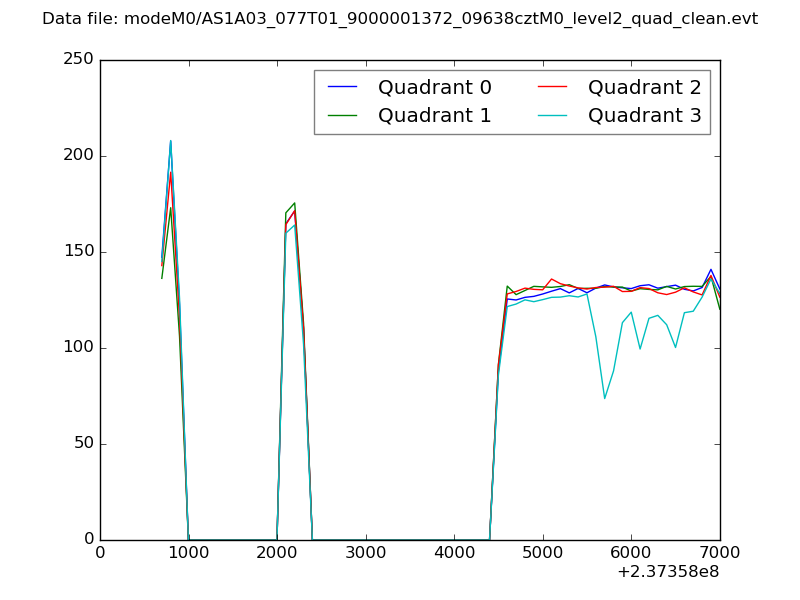 |
|
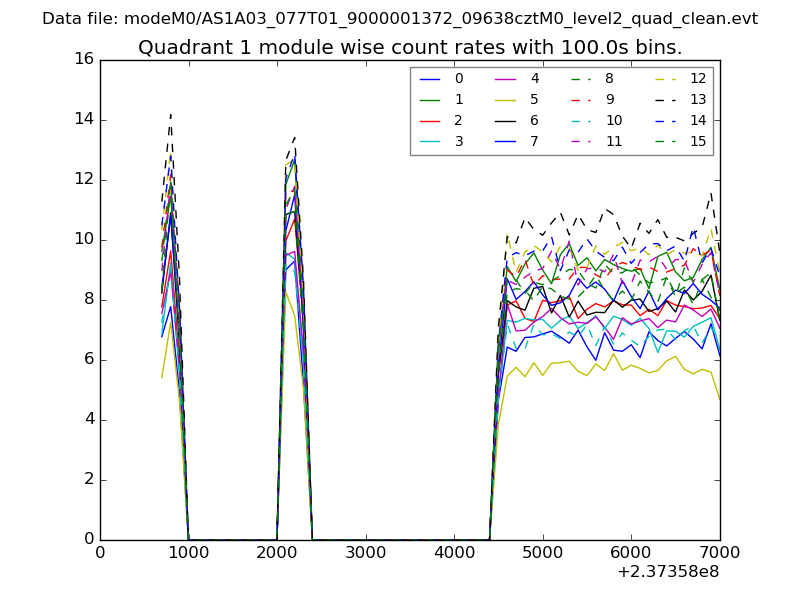
| Module-wise count rates for Quadrant A Data is divided into 100 sec bins |
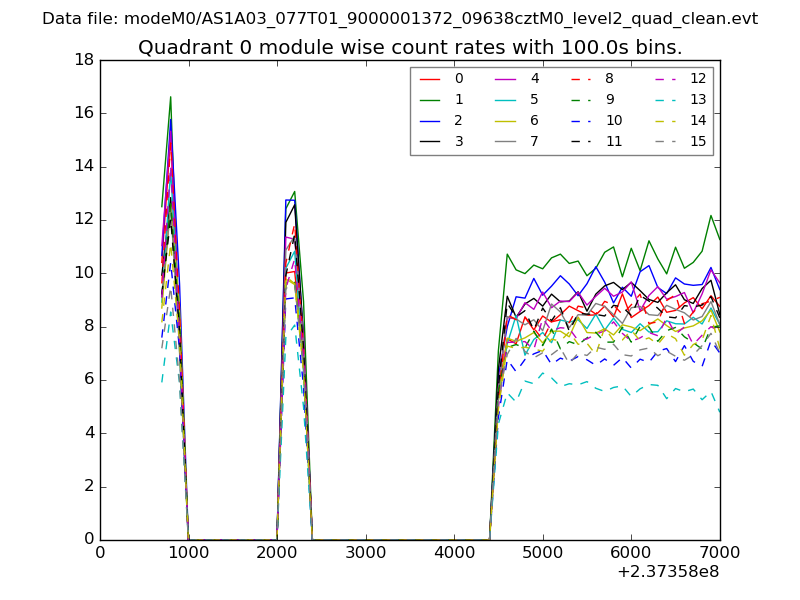 |
 |
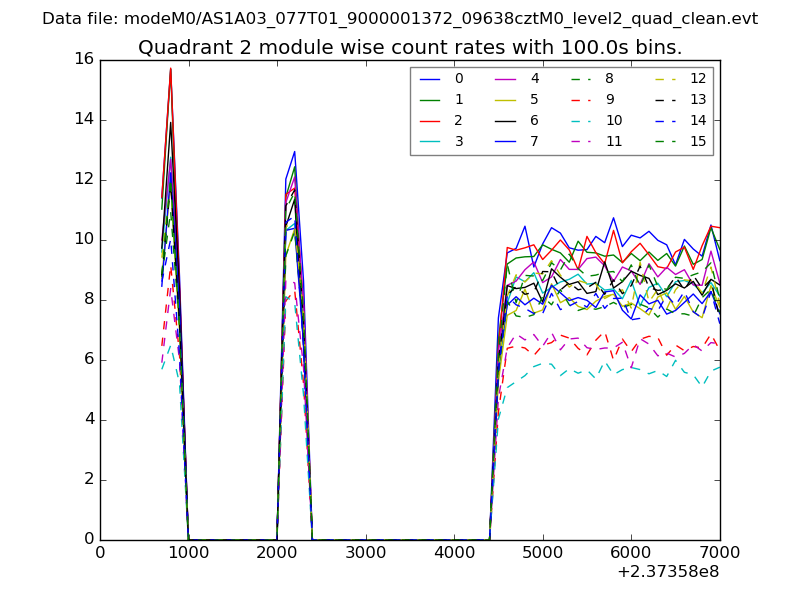
| Module-wise count rates for Quadrant B Data is divided into 100 sec bins |
 |
 |
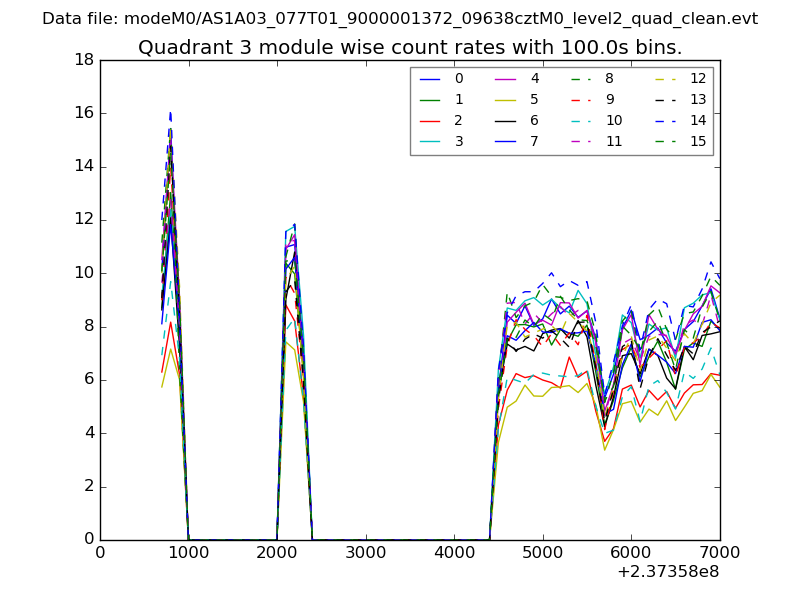
| Module-wise count rates for Quadrant C Data is divided into 100 sec bins |
 |
 |
| Module-wise count rates for Quadrant D Data is divided into 100 sec bins |
 |
 |
| Parameter | Plot |
|---|---|
| CZT HV Monitor | 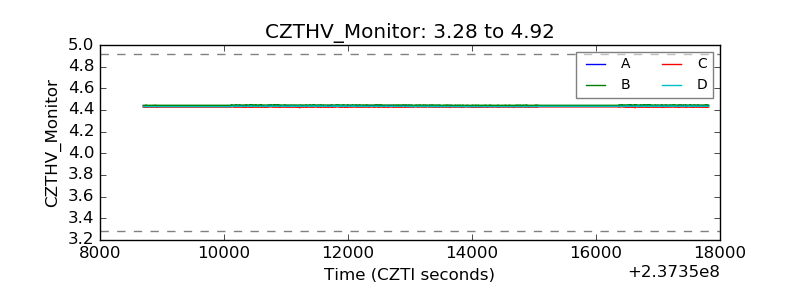 |
| D_VDD | 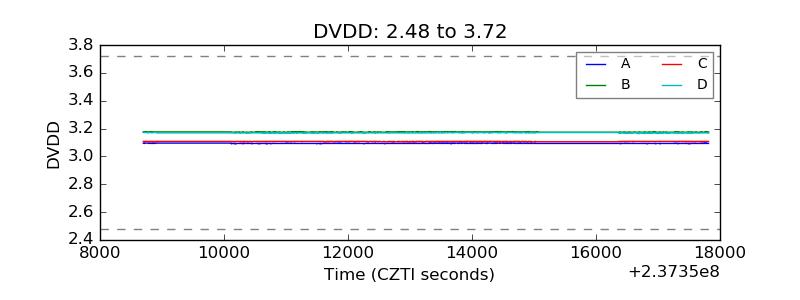 |
| Temperature 1 | 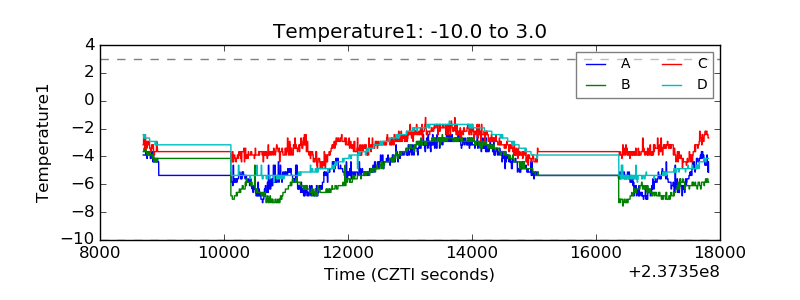 |
| Veto HV Monitor | 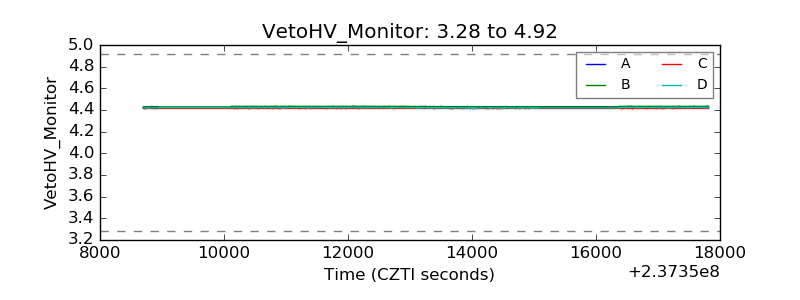 |
| Veto LLD | 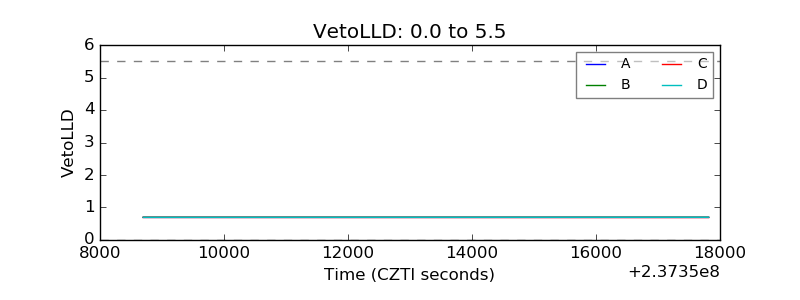 |
| Alpha Counter | 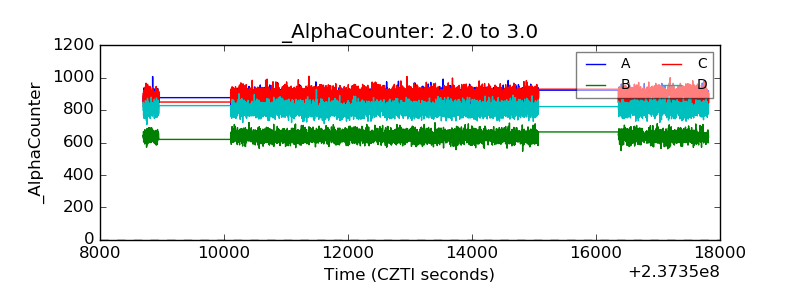 |
| _CPM_Rate | 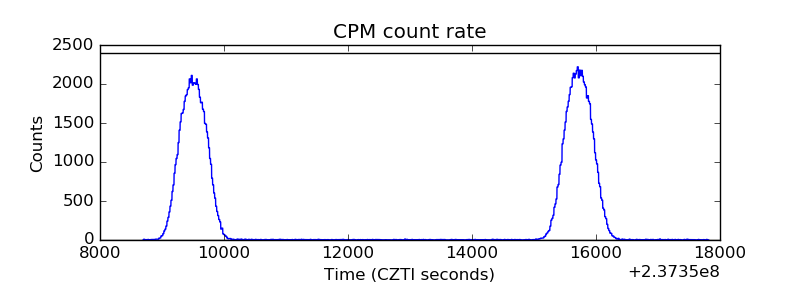 |
| CZT Counter | 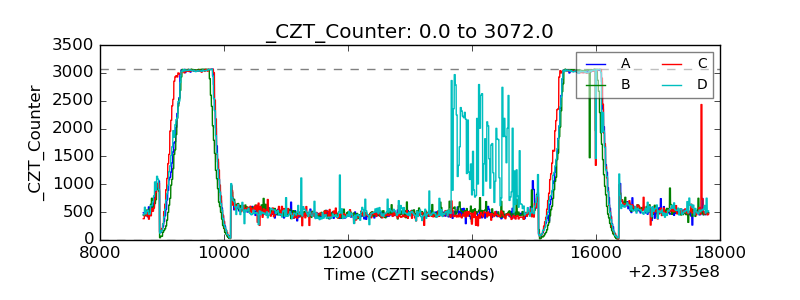 |
| +2.5 Volts monitor |  |
| +5 Volts monitor |  |
| _ROLL_ROT | 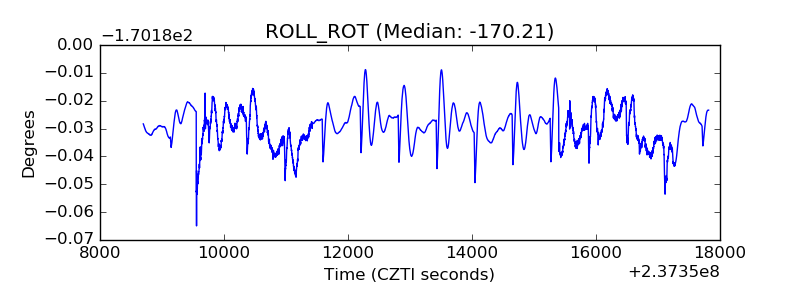 |
| _Roll_DEC | 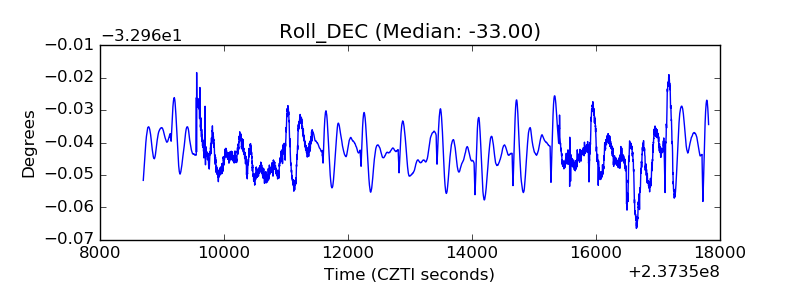 |
| _Roll_RA | 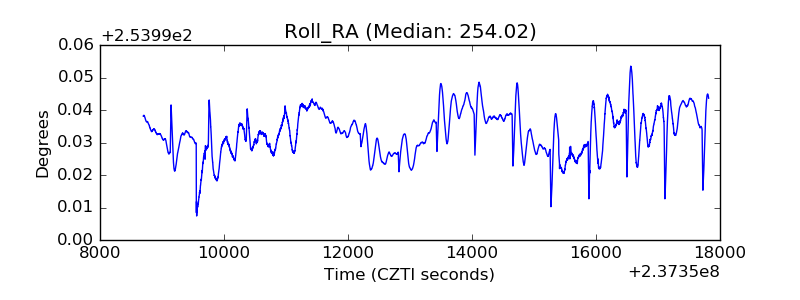 |
| Veto Counter | 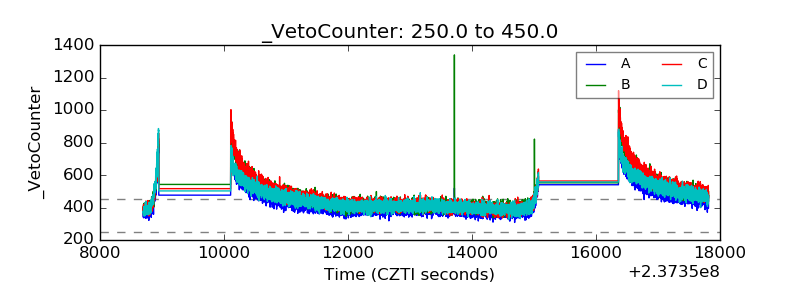 |