| Param | Original file | Final file |
|---|---|---|
| Filename | modeM0/AS1A03_077T01_9000001372_09639cztM0_level2.evt | modeM0/AS1A03_077T01_9000001372_09639cztM0_level2_quad_clean.evt |
| Size (bytes) | 109,710,720 | 14,699,520 |
| Size | 104.6 MB | 14.0 MB |
| Events in quadrant A | 791,721 | 88,016 |
| Events in quadrant B | 786,149 | 82,040 |
| Events in quadrant C | 806,466 | 89,930 |
| Events in quadrant D | 829,736 | 70,153 |
| Mode M9 | |||
|---|---|---|---|
| Quadrant | BADHDUFLAG | Total packets | Discarded packets |
| A | 0 | 19 | 14 |
| B | 0 | 20 | 14 |
| C | 0 | 19 | 13 |
| D | 0 | 21 | 14 |
| Mode SS | |||
|---|---|---|---|
| Quadrant | BADHDUFLAG | Total packets | Discarded packets |
| A | 0 | 123 | 95 |
| B | 0 | 126 | 96 |
| C | 0 | 121 | 88 |
| D | 0 | 125 | 95 |
| Mode M0 | |||
|---|---|---|---|
| Quadrant | BADHDUFLAG | Total packets | Discarded packets |
| A | 0 | 12660 | 9446 |
| B | 0 | 12947 | 9811 |
| C | 0 | 12749 | 9452 |
| D | 0 | 14694 | 11391 |
| Quadrant | Total seconds | Saturated seconds | Saturation percentage |
|---|---|---|---|
| A | 1567 | 2 | 0.127632% |
| B | 1515 | 5 | 0.330033% |
| C | 1616 | 3 | 0.185644% |
| D | 1472 | 8 | 0.543478% |
Noise dominated data is calculated using 1-second bins in cleaned event files. If a bin has >2000 counts, and if more than 50% of those come from <1% of pixels, then it is considered to be noise-dominated and hence unusable.
| Quadrant | # 1 sec bins | Bins with >0 counts | Bins with >2000 counts | High rate bins dominated by noise | Noise dominated (total time) | Noise dominated (detector-on time) | Marked lightcurve |
|---|---|---|---|---|---|---|---|
| A | 7420 | 2136 | 0 | 0 | 0.00% | 0.00% | 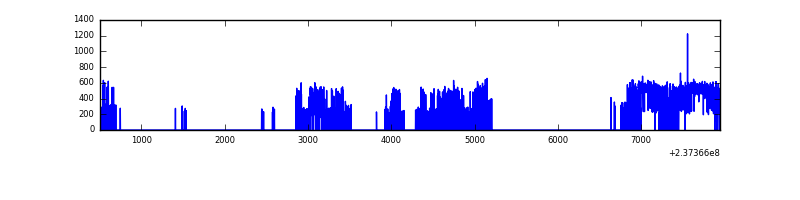 |
| B | 7442 | 2075 | 0 | 0 | 0.00% | 0.00% | 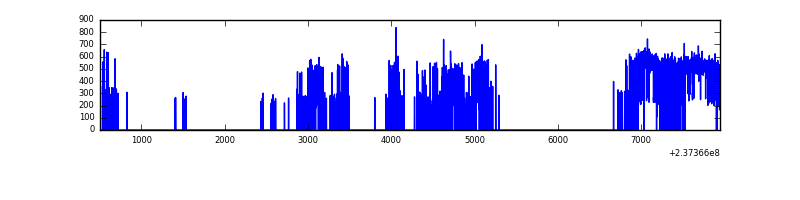 |
| C | 7427 | 2163 | 0 | 0 | 0.00% | 0.00% | 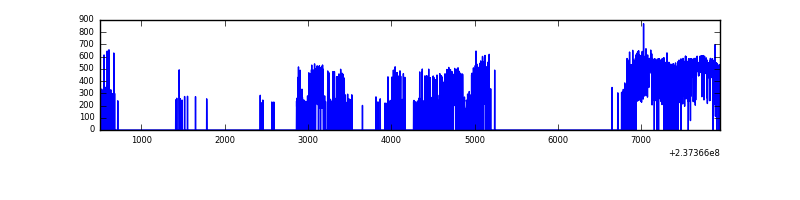 |
| D | 7417 | 1993 | 2 | 2 | 0.03% | 0.10% |  |
Top three noisy pixels from each quadrant. If the there are fewer than three noisy pixels in the level2.evt file, extra rows are filled as -1
| Pixel properties | Quadrant properties | ||||||
|---|---|---|---|---|---|---|---|
| Quadrant | DetID | PixID | Counts | Sigma | Mean | Median | Sigma |
| A | 14 | 111 | 2358 | 50.15 | 204 | 201 | 43.0 |
| A | 0 | 226 | 1893 | 39.34 | 204 | 201 | 43.0 |
| A | 12 | 194 | 1704 | 34.95 | 204 | 201 | 43.0 |
| B | 0 | 214 | 5773 | 142.52 | 199 | 195 | 39.1 |
| B | 12 | 111 | 4102 | 99.83 | 199 | 195 | 39.1 |
| B | 11 | 111 | 3237 | 77.73 | 199 | 195 | 39.1 |
| C | 13 | 61 | 1518 | 26.88 | 206 | 207 | 48.8 |
| C | 3 | 203 | 481 | 5.62 | 206 | 207 | 48.8 |
| C | 3 | 202 | 481 | 5.62 | 206 | 207 | 48.8 |
| D | 8 | 195 | 50575 | 1082.67 | 186 | 181 | 46.5 |
| D | 10 | 172 | 25163 | 536.72 | 186 | 181 | 46.5 |
| D | 7 | 71 | 12837 | 271.9 | 186 | 181 | 46.5 |
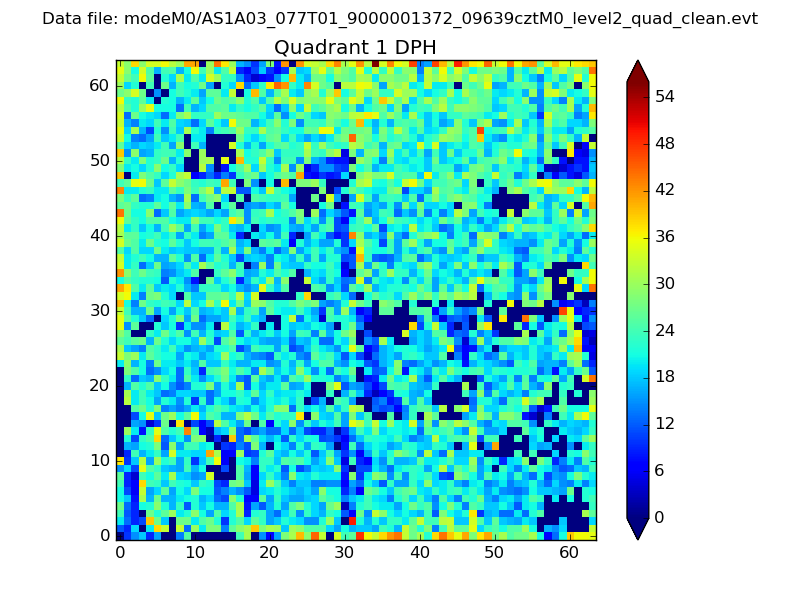
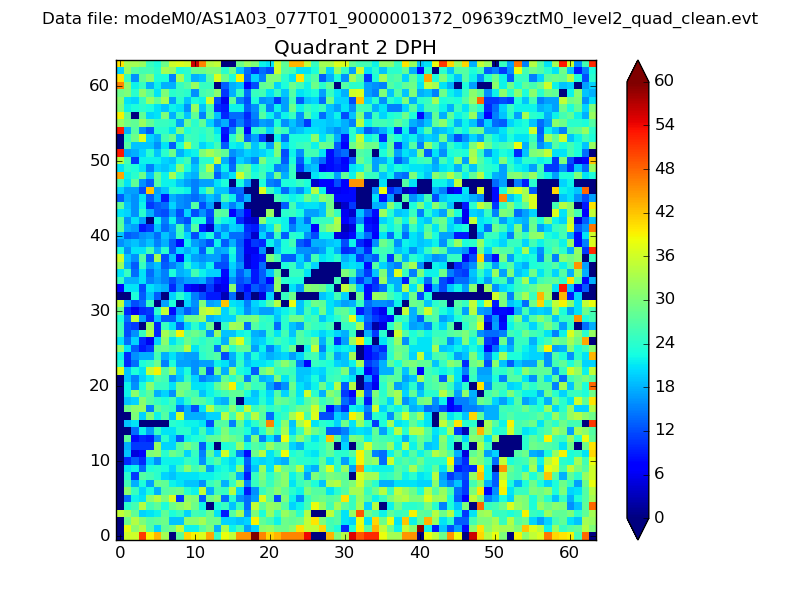
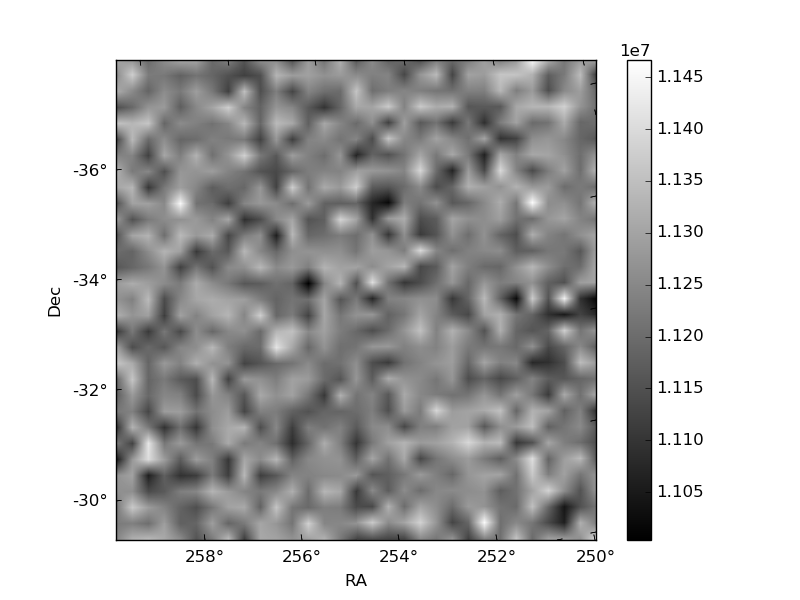
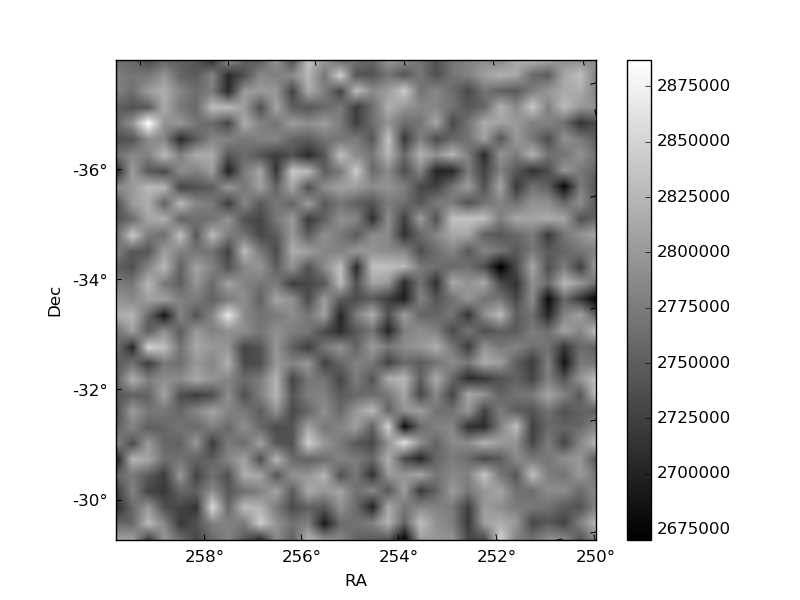
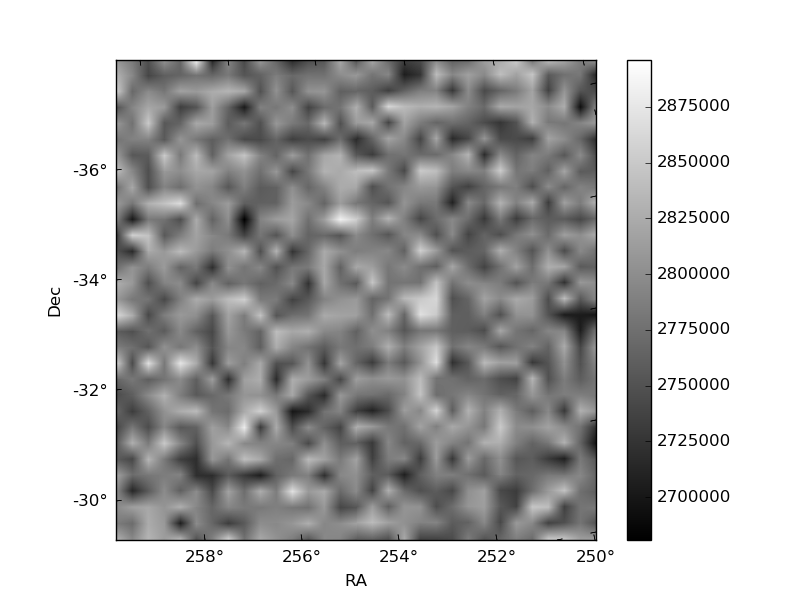
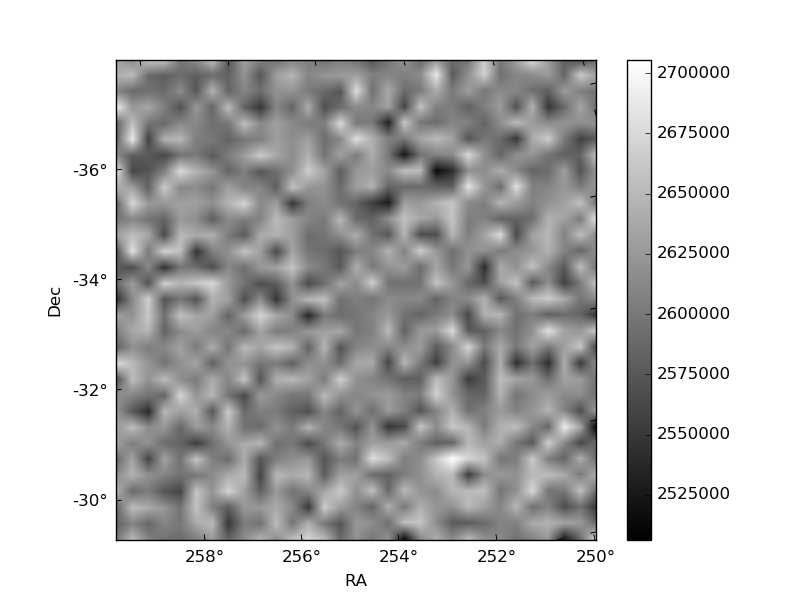
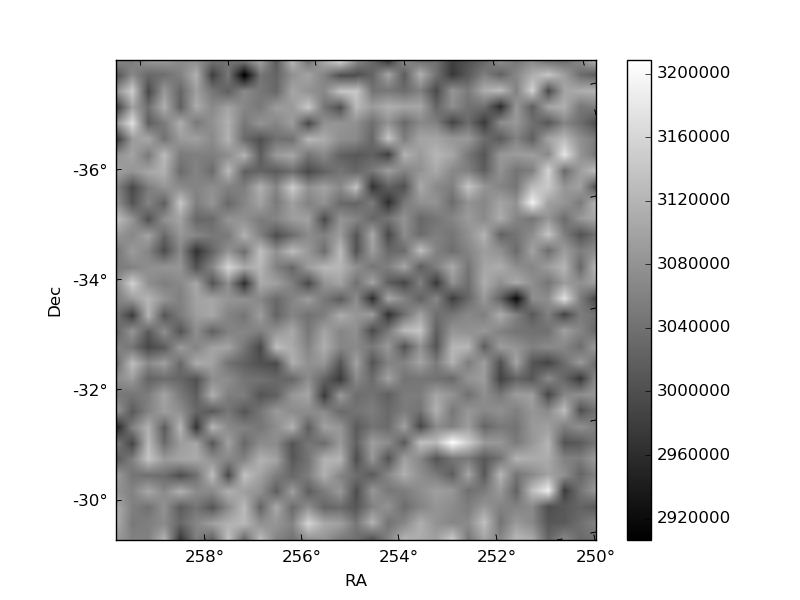
Histogram calculated using DETX and DETY for each event in the final _common_clean file
| Quadrant A | 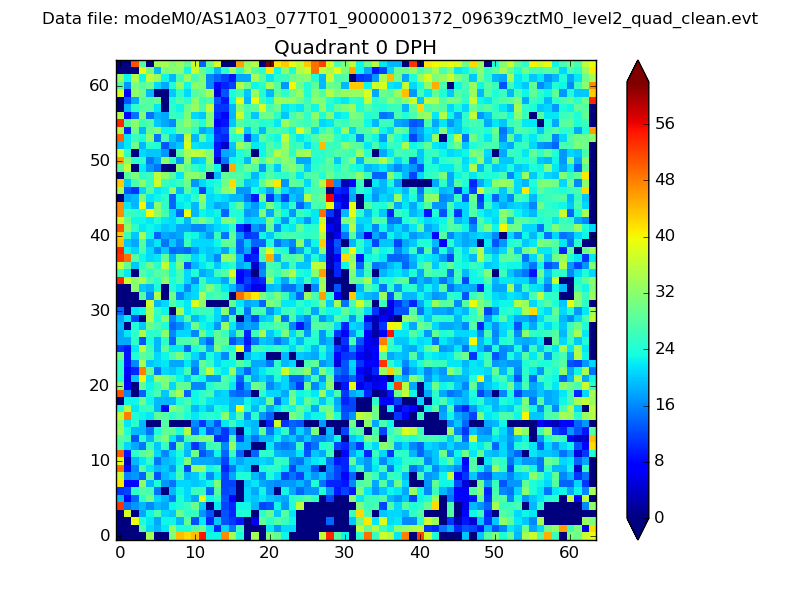 |
 |
Quadrant B |
|---|---|---|---|
| Quadrant D | 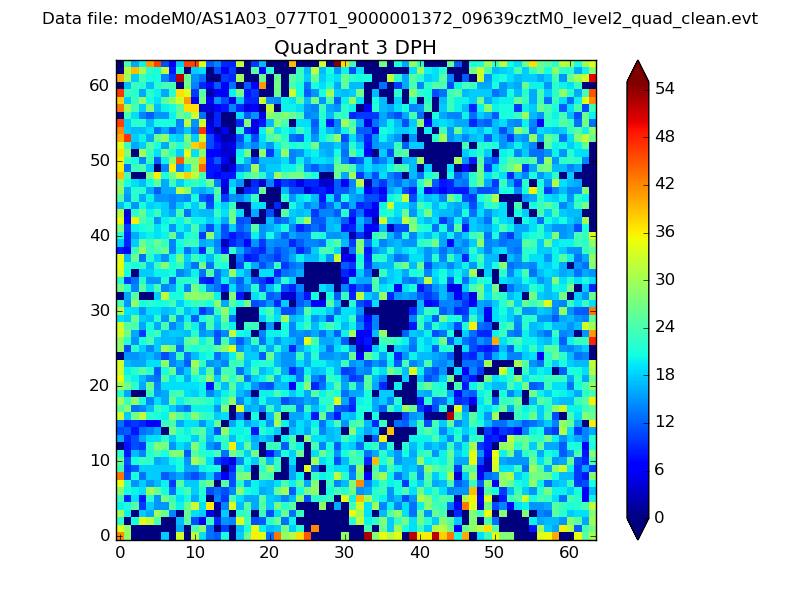 |
 |
Quadrant C |
| Plot type | Count rate plots | Images |
|---|---|---|
| Comparison with Poisson distribution Blue bars denote a histogram of data divided into 1 sec bins. Red curve is a Poisson curve with rate = median count rate of data. |
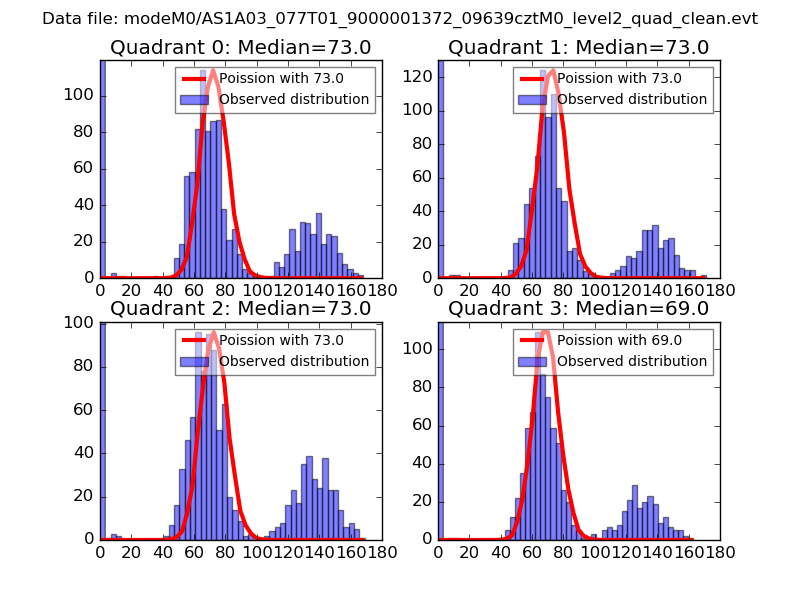 |
 |
| Quadrant-wise count rates Data is divided into 100 sec bins |
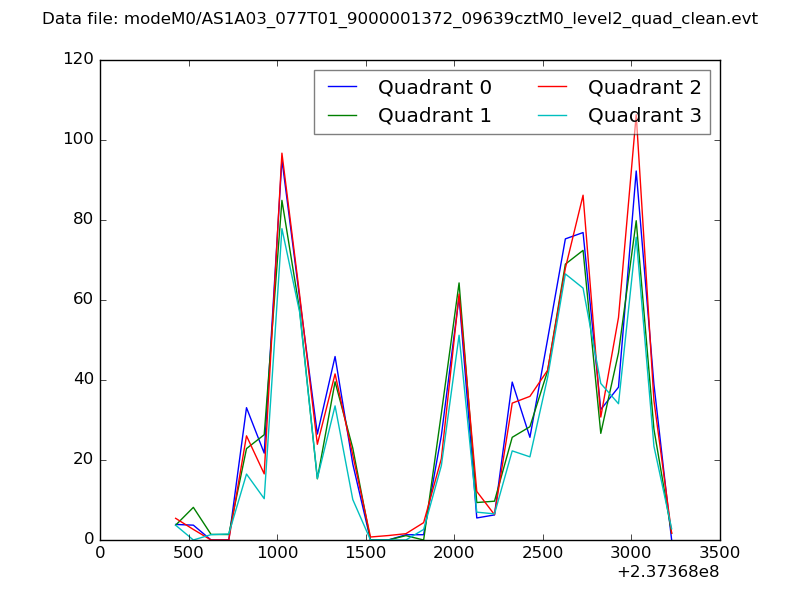 |
|
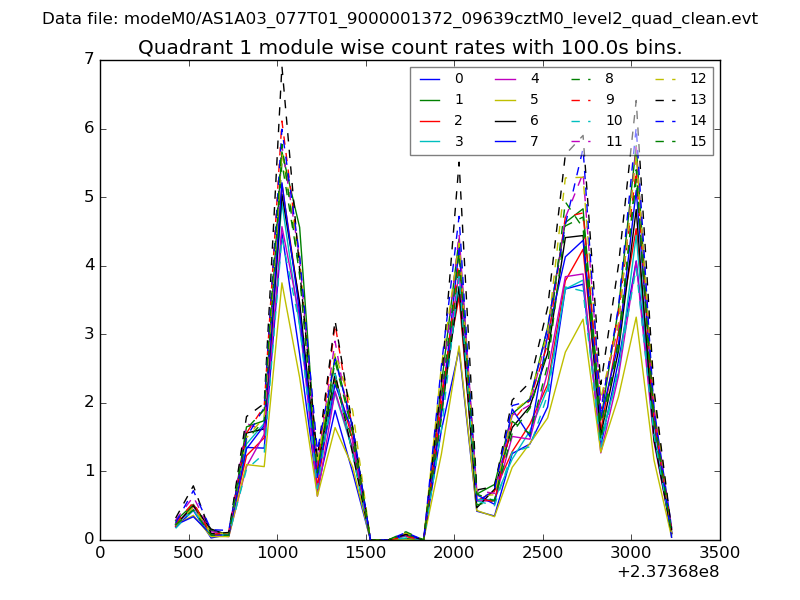
| Module-wise count rates for Quadrant A Data is divided into 100 sec bins |
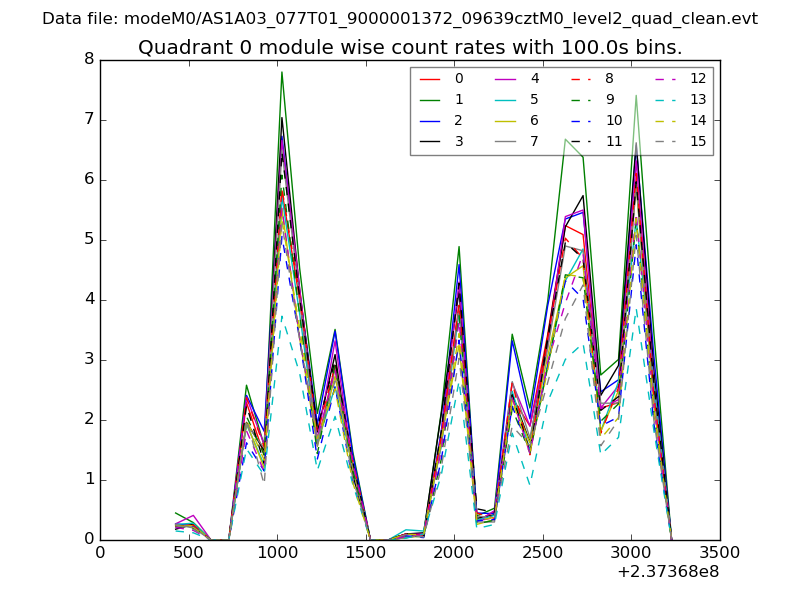 |
 |
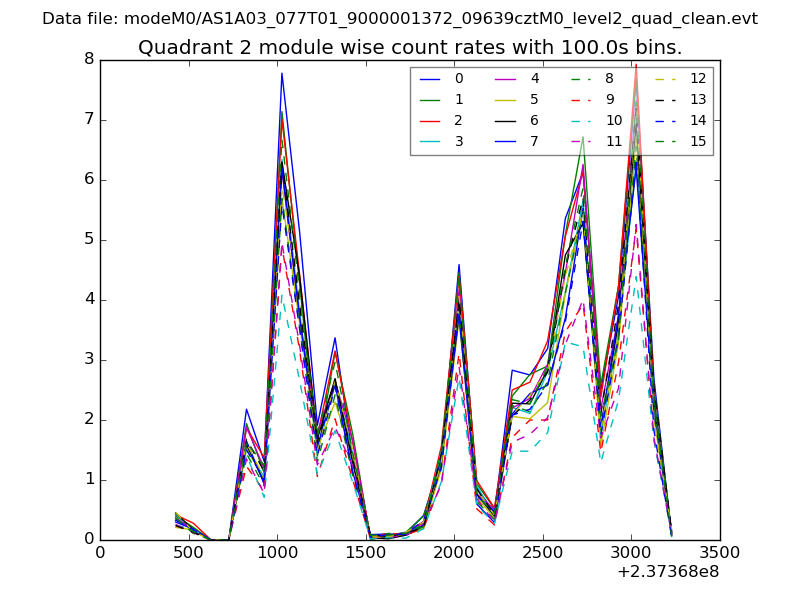
| Module-wise count rates for Quadrant B Data is divided into 100 sec bins |
 |
 |
| Module-wise count rates for Quadrant C Data is divided into 100 sec bins |
 |
 |
| Module-wise count rates for Quadrant D Data is divided into 100 sec bins |
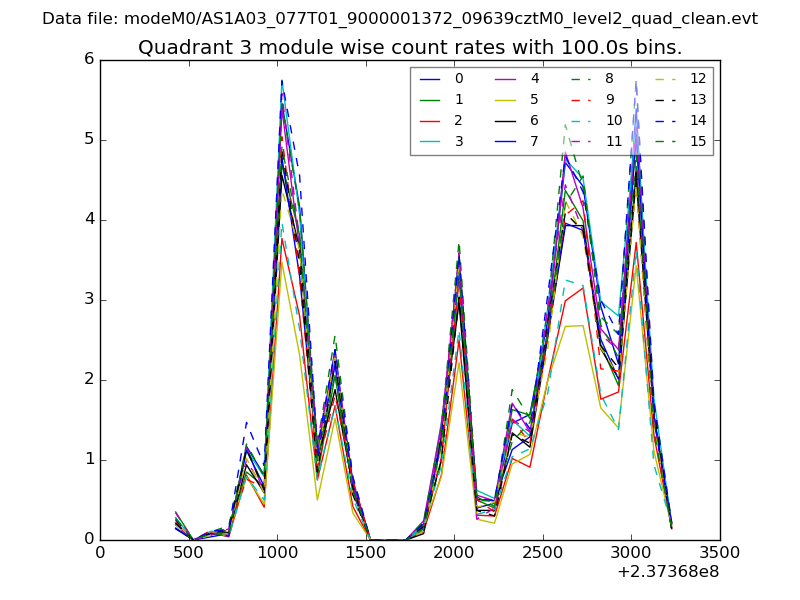 |
 |
| Parameter | Plot |
|---|---|
| CZT HV Monitor | 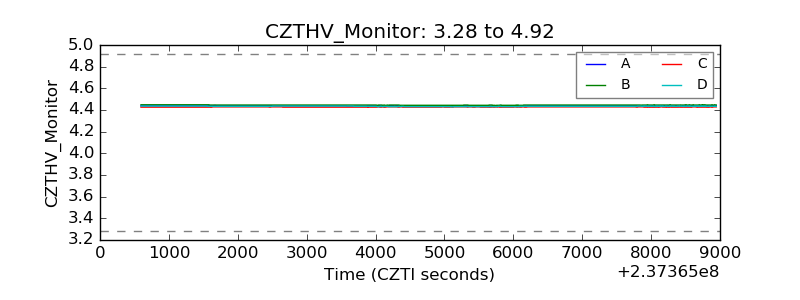 |
| D_VDD | 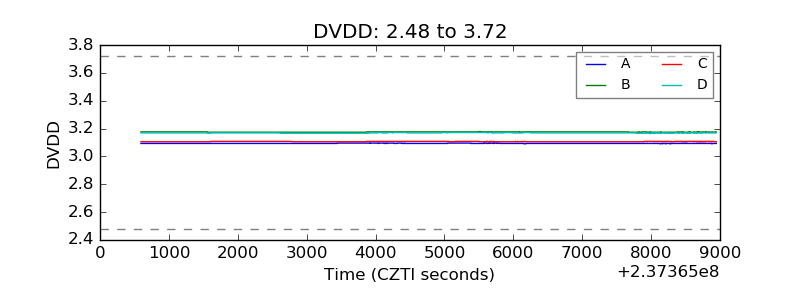 |
| Temperature 1 |  |
| Veto HV Monitor | 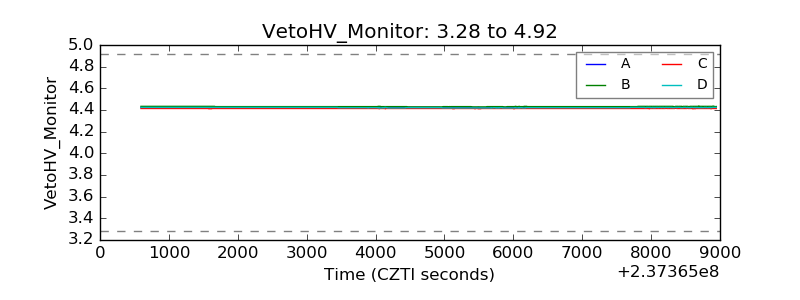 |
| Veto LLD | 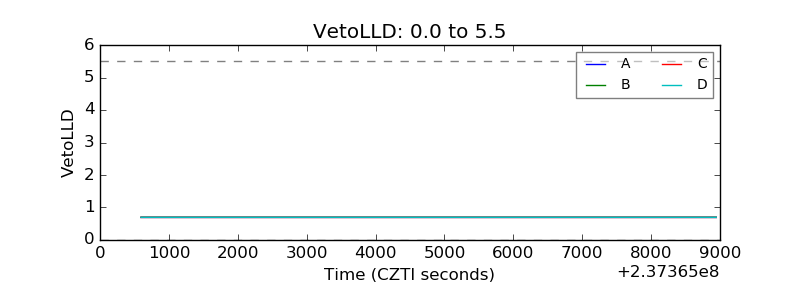 |
| Alpha Counter | 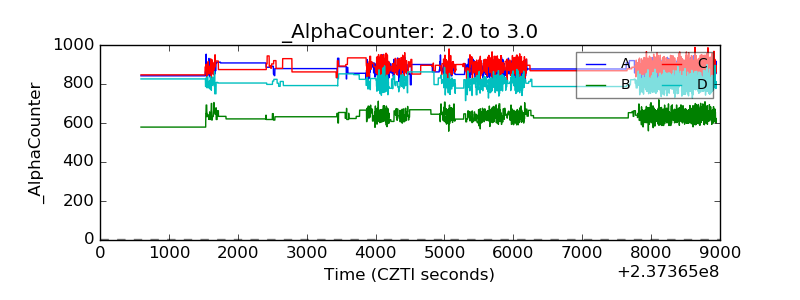 |
| _CPM_Rate | 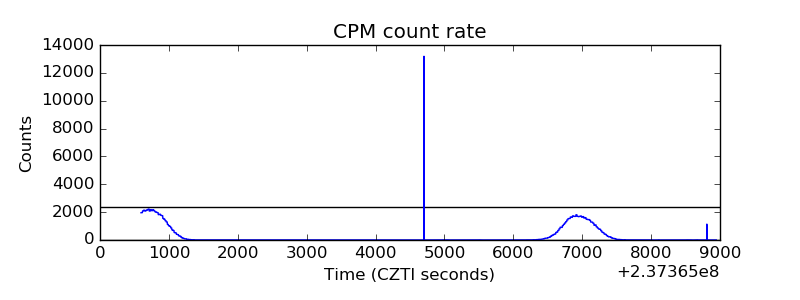 |
| CZT Counter | 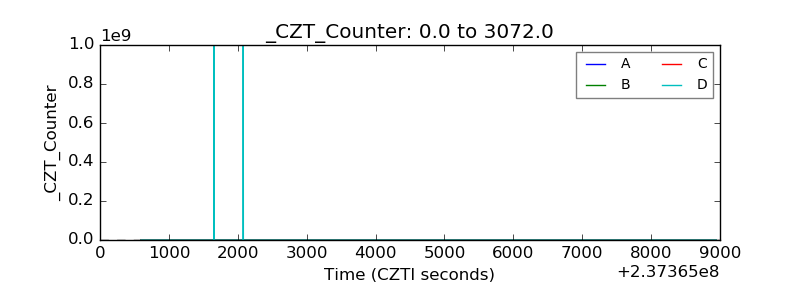 |
| +2.5 Volts monitor |  |
| +5 Volts monitor |  |
| _ROLL_ROT | 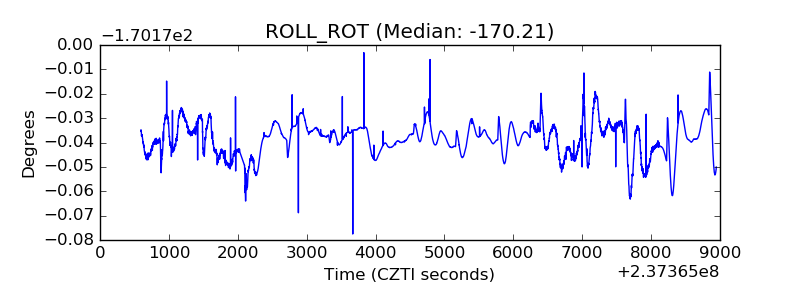 |
| _Roll_DEC | 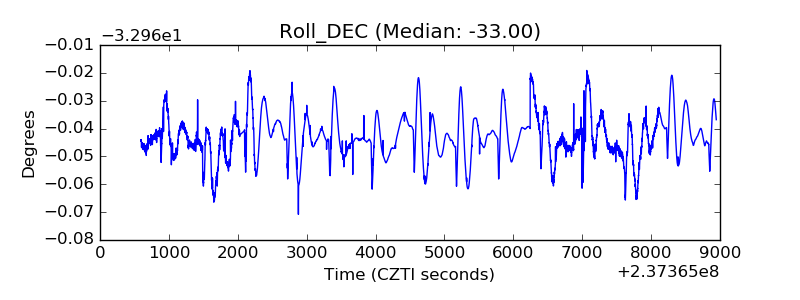 |
| _Roll_RA | 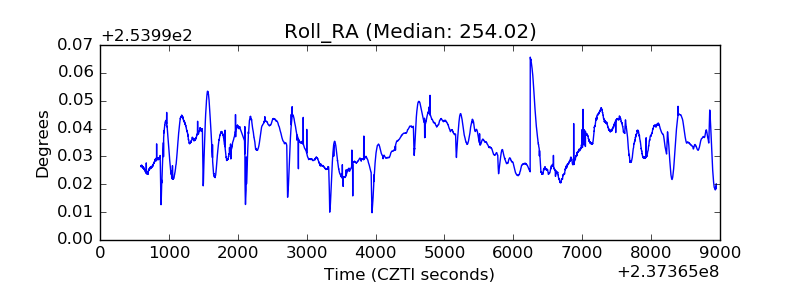 |
| Veto Counter |  |