| Param | Original file | Final file |
|---|---|---|
| Filename | modeM0/AS1A03_077T01_9000001372_09640cztM0_level2.evt | modeM0/AS1A03_077T01_9000001372_09640cztM0_level2_quad_clean.evt |
| Size (bytes) | 177,099,840 | 27,613,440 |
| Size | 168.9 MB | 26.3 MB |
| Events in quadrant A | 1,226,432 | 178,523 |
| Events in quadrant B | 1,257,321 | 173,038 |
| Events in quadrant C | 1,221,078 | 177,173 |
| Events in quadrant D | 1,496,544 | 138,086 |
| Mode M9 | |||
|---|---|---|---|
| Quadrant | BADHDUFLAG | Total packets | Discarded packets |
| A | 0 | 17 | 5 |
| B | 0 | 17 | 6 |
| C | 0 | 17 | 6 |
| D | 0 | 18 | 4 |
| Mode SS | |||
|---|---|---|---|
| Quadrant | BADHDUFLAG | Total packets | Discarded packets |
| A | 0 | 123 | 81 |
| B | 0 | 123 | 77 |
| C | 0 | 124 | 80 |
| D | 0 | 126 | 72 |
| Mode M0 | |||
|---|---|---|---|
| Quadrant | BADHDUFLAG | Total packets | Discarded packets |
| A | 0 | 12844 | 7783 |
| B | 0 | 13171 | 8109 |
| C | 0 | 12847 | 7749 |
| D | 0 | 16845 | 10859 |
| Quadrant | Total seconds | Saturated seconds | Saturation percentage |
|---|---|---|---|
| A | 2423 | 33 | 1.361948% |
| B | 2381 | 37 | 1.553969% |
| C | 2437 | 25 | 1.025851% |
| D | 2103 | 34 | 1.616738% |
Noise dominated data is calculated using 1-second bins in cleaned event files. If a bin has >2000 counts, and if more than 50% of those come from <1% of pixels, then it is considered to be noise-dominated and hence unusable.
| Quadrant | # 1 sec bins | Bins with >0 counts | Bins with >2000 counts | High rate bins dominated by noise | Noise dominated (total time) | Noise dominated (detector-on time) | Marked lightcurve |
|---|---|---|---|---|---|---|---|
| A | 7540 | 3113 | 0 | 0 | 0.00% | 0.00% |  |
| B | 7483 | 3099 | 0 | 0 | 0.00% | 0.00% | 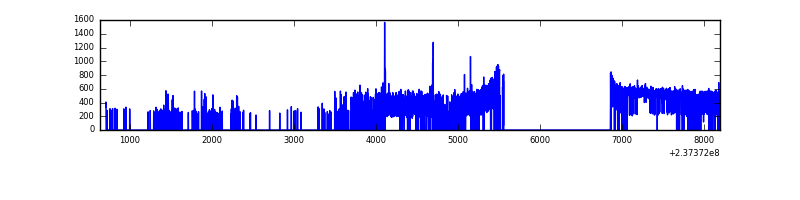 |
| C | 7555 | 3139 | 0 | 0 | 0.00% | 0.00% | 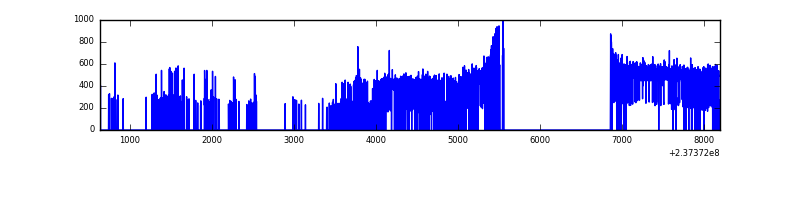 |
| D | 7514 | 2860 | 4 | 4 | 0.05% | 0.14% | 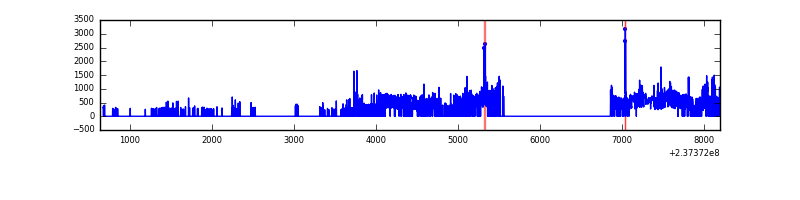 |
Top three noisy pixels from each quadrant. If the there are fewer than three noisy pixels in the level2.evt file, extra rows are filled as -1
| Pixel properties | Quadrant properties | ||||||
|---|---|---|---|---|---|---|---|
| Quadrant | DetID | PixID | Counts | Sigma | Mean | Median | Sigma |
| A | 0 | 226 | 2851 | 38.74 | 318 | 312 | 65.5 |
| A | 12 | 194 | 2621 | 35.23 | 318 | 312 | 65.5 |
| A | 13 | 248 | 1690 | 21.02 | 318 | 312 | 65.5 |
| B | 0 | 214 | 13612 | 217.2 | 315 | 307 | 61.3 |
| B | 0 | 229 | 11118 | 176.49 | 315 | 307 | 61.3 |
| B | 12 | 111 | 6560 | 102.08 | 315 | 307 | 61.3 |
| C | 13 | 61 | 2329 | 27.54 | 312 | 314 | 73.2 |
| C | 14 | 67 | 1017 | 9.61 | 312 | 314 | 73.2 |
| C | 3 | 202 | 766 | 6.18 | 312 | 314 | 73.2 |
| D | 8 | 195 | 347339 | 5269.33 | 269 | 263 | 65.9 |
| D | 1 | 52 | 55144 | 833.21 | 269 | 263 | 65.9 |
| D | 13 | 104 | 20583 | 308.5 | 269 | 263 | 65.9 |
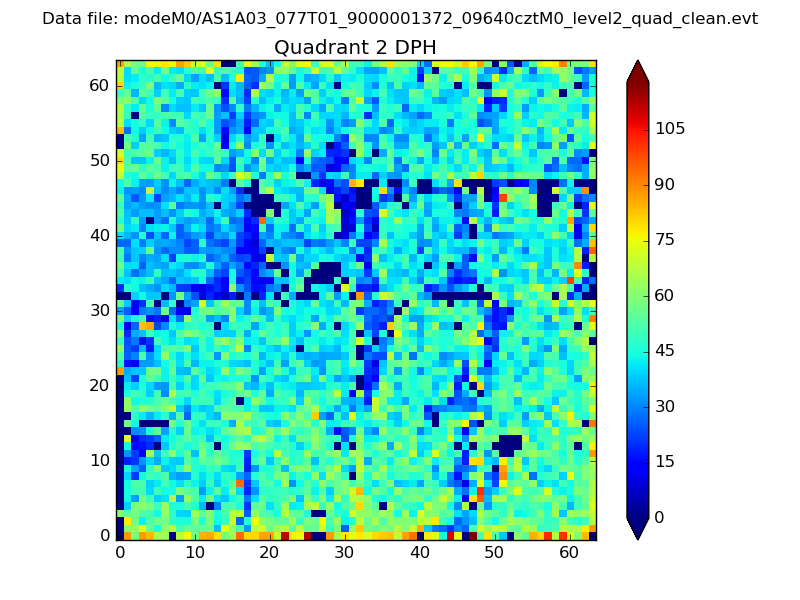
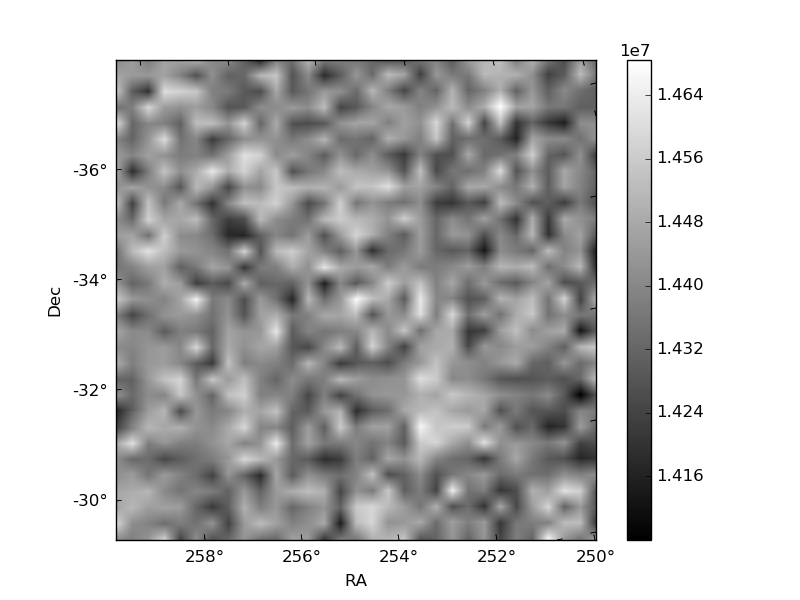
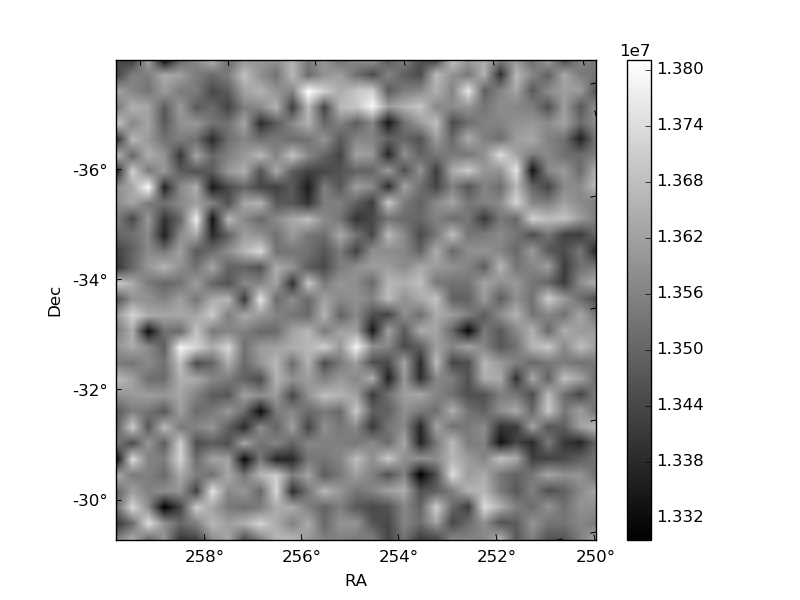
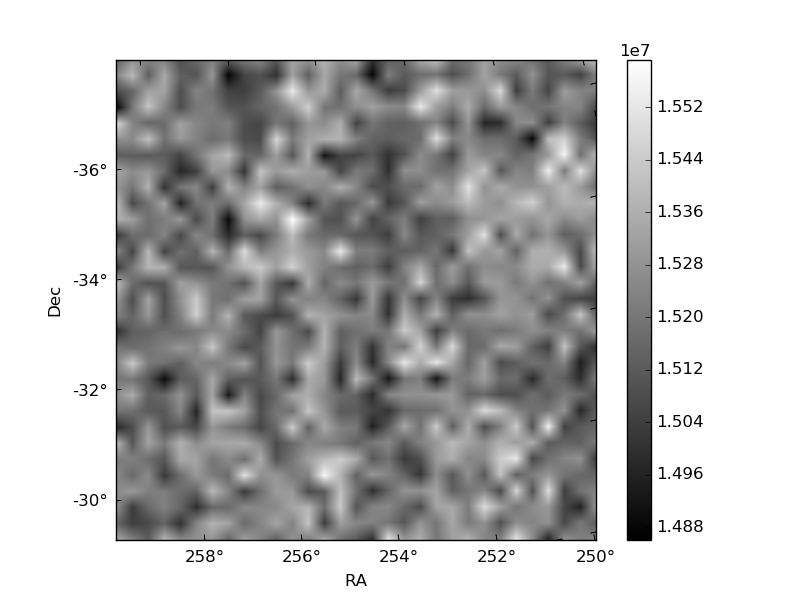
Histogram calculated using DETX and DETY for each event in the final _common_clean file
| Quadrant A | 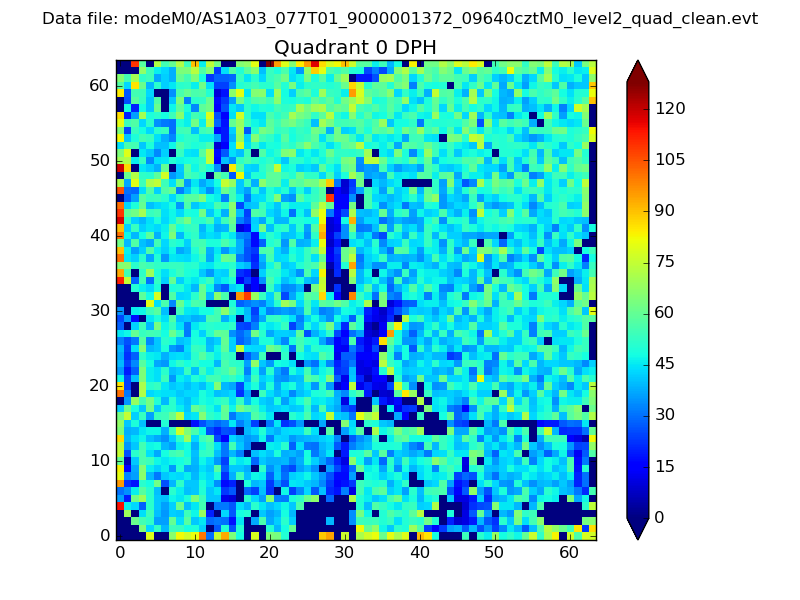 |
 |
Quadrant B |
|---|---|---|---|
| Quadrant D | 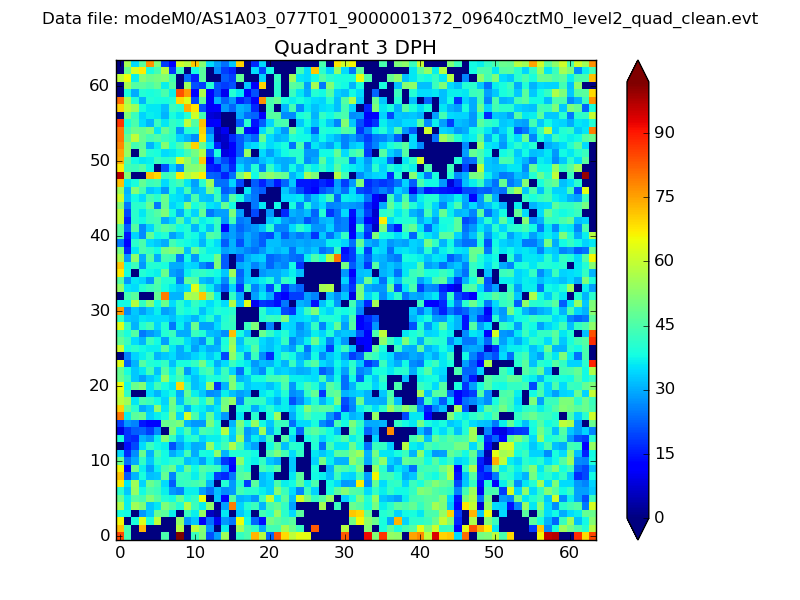 |
 |
Quadrant C |
| Plot type | Count rate plots | Images |
|---|---|---|
| Comparison with Poisson distribution Blue bars denote a histogram of data divided into 1 sec bins. Red curve is a Poisson curve with rate = median count rate of data. |
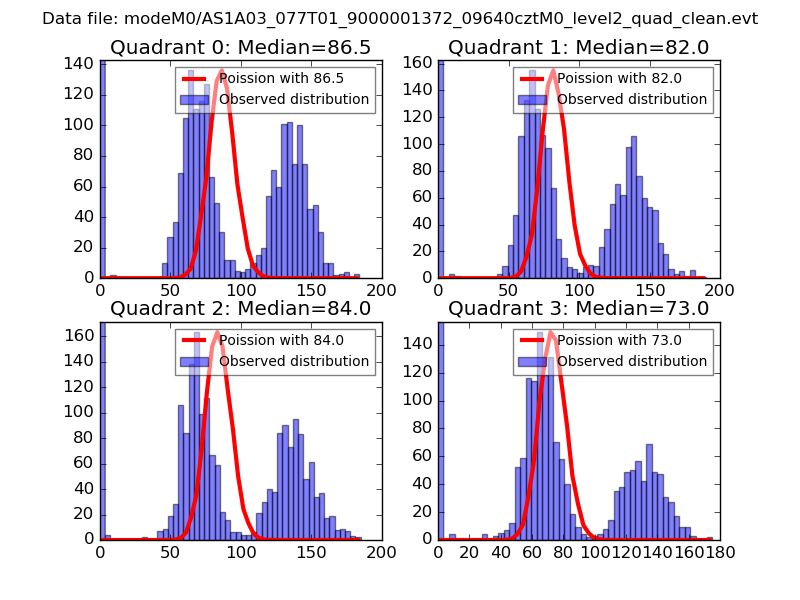 |
 |
| Quadrant-wise count rates Data is divided into 100 sec bins |
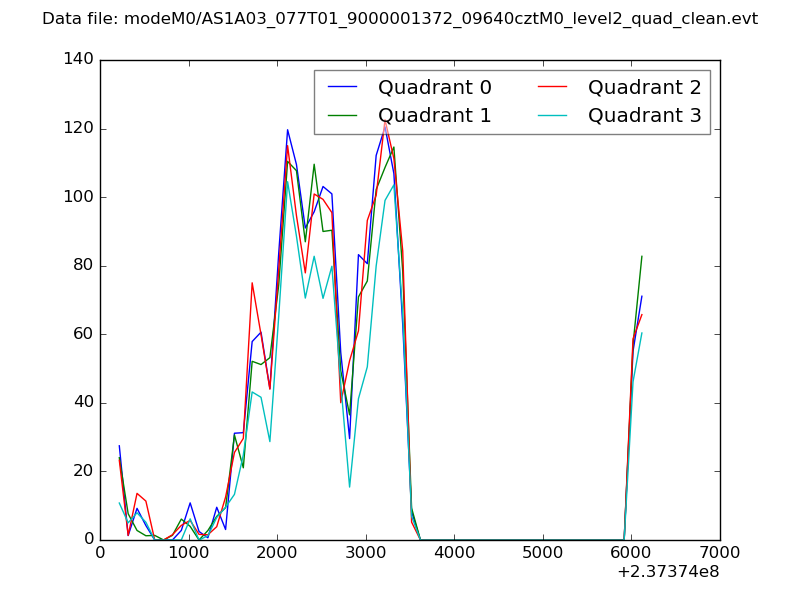 |
|
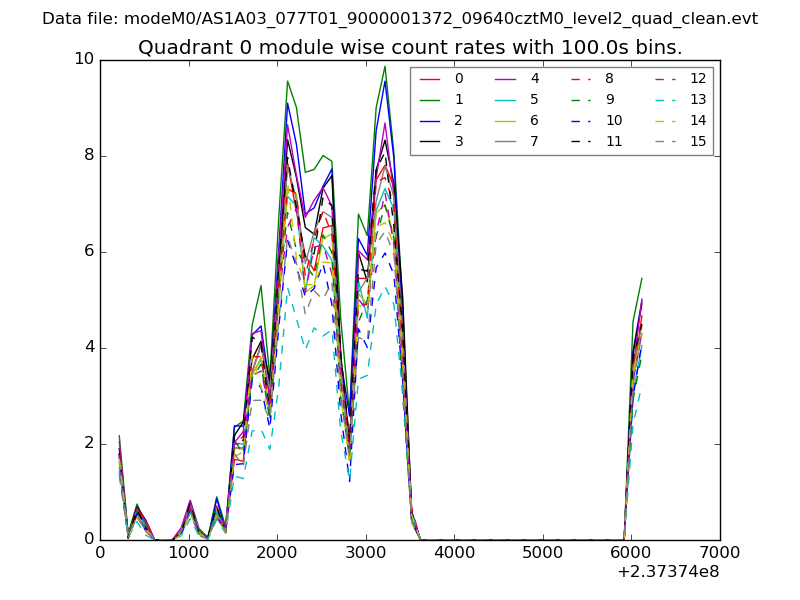
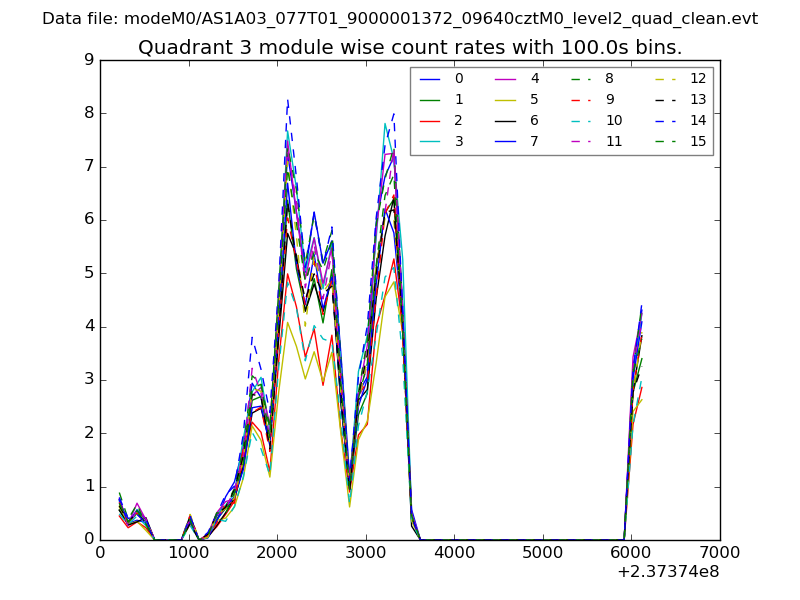
| Module-wise count rates for Quadrant A Data is divided into 100 sec bins |
 |
 |
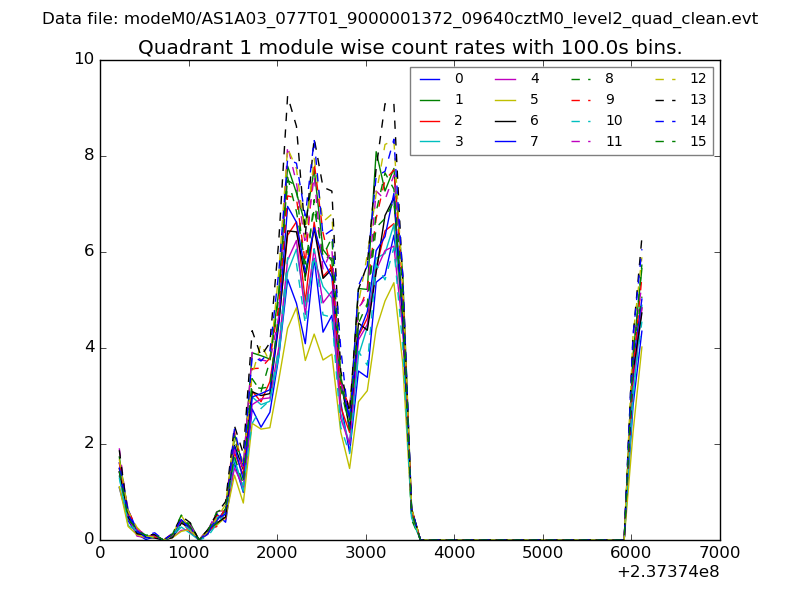
| Module-wise count rates for Quadrant B Data is divided into 100 sec bins |
 |
 |
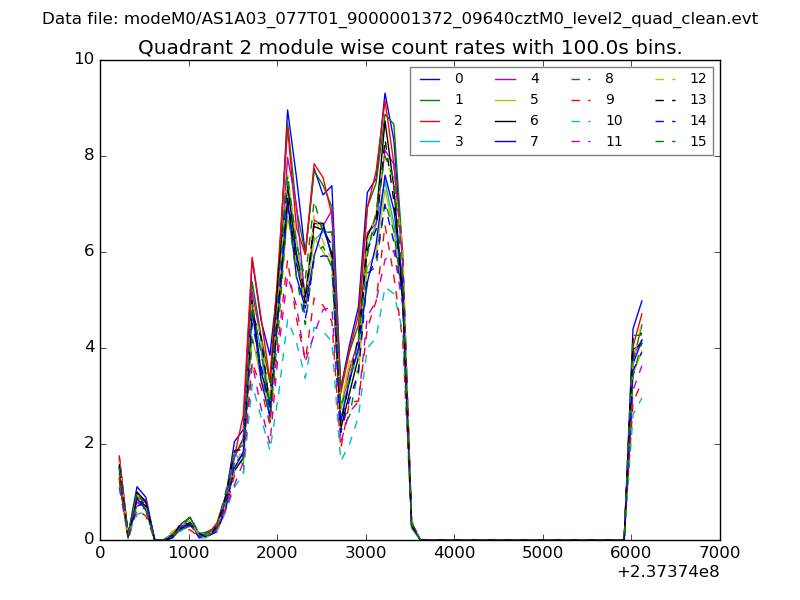
| Module-wise count rates for Quadrant C Data is divided into 100 sec bins |
 |
 |
| Module-wise count rates for Quadrant D Data is divided into 100 sec bins |
 |
 |
| Parameter | Plot |
|---|---|
| CZT HV Monitor | 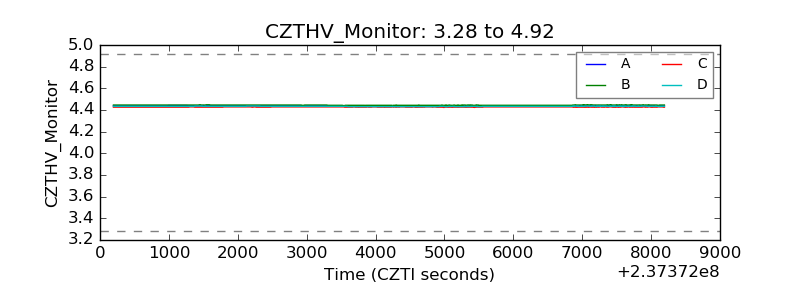 |
| D_VDD | 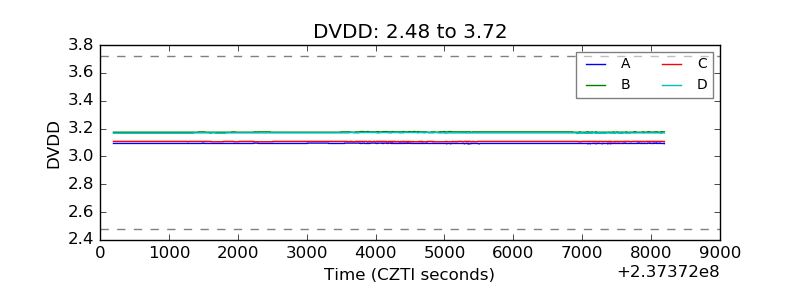 |
| Temperature 1 | 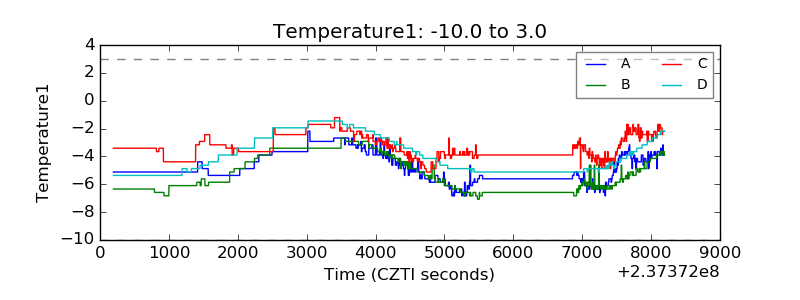 |
| Veto HV Monitor | 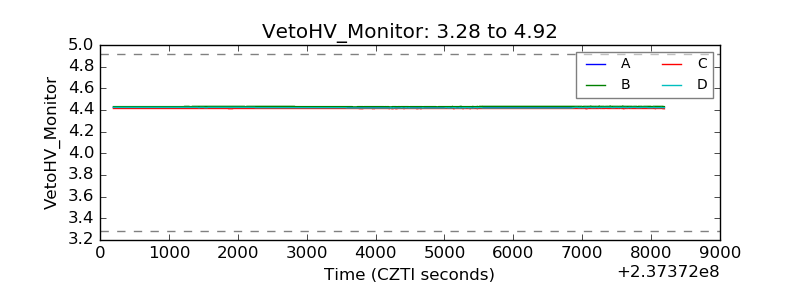 |
| Veto LLD | 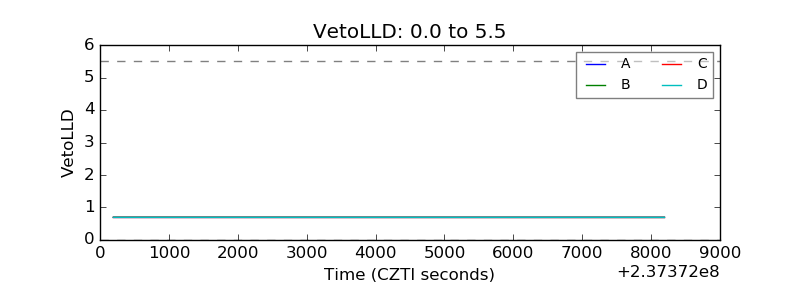 |
| Alpha Counter | 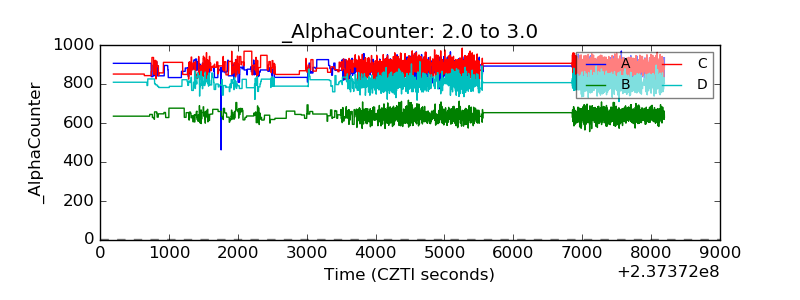 |
| _CPM_Rate | 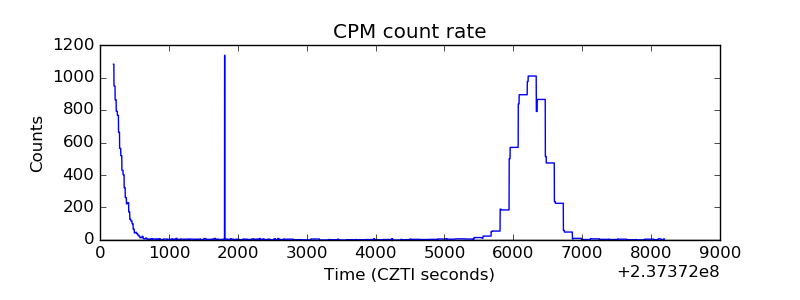 |
| CZT Counter | 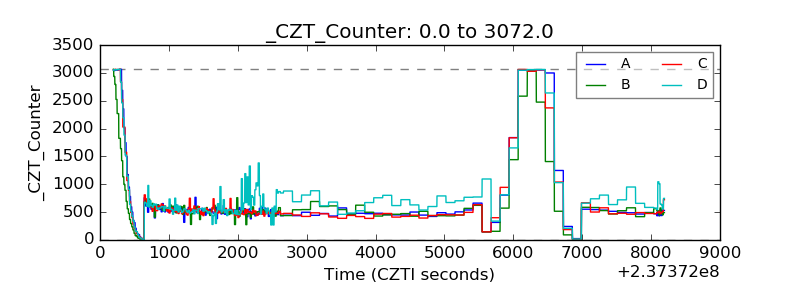 |
| +2.5 Volts monitor |  |
| +5 Volts monitor |  |
| _ROLL_ROT | 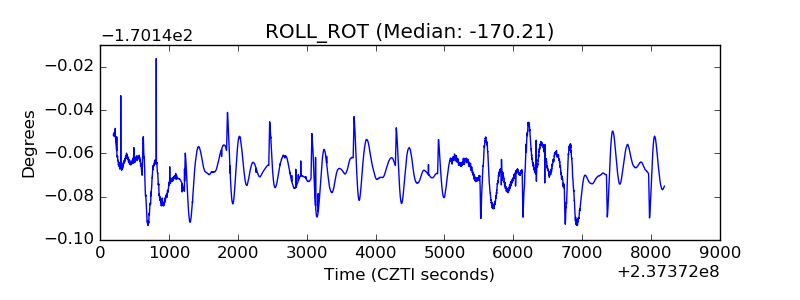 |
| _Roll_DEC | 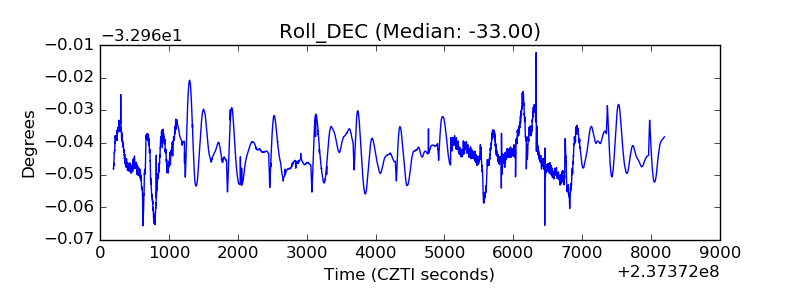 |
| _Roll_RA | 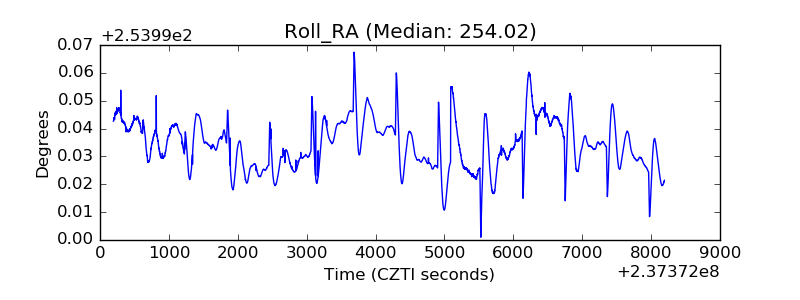 |
| Veto Counter | 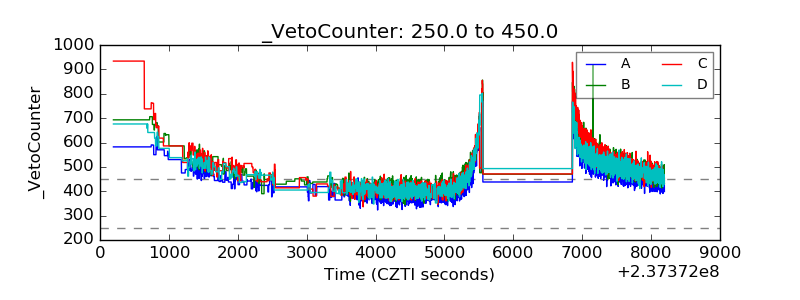 |