| Param | Original file | Final file |
|---|---|---|
| Filename | modeM0/AS1A03_077T01_9000001372_09642cztM0_level2.evt | modeM0/AS1A03_077T01_9000001372_09642cztM0_level2_quad_clean.evt |
| Size (bytes) | 314,291,520 | 58,815,360 |
| Size | 299.7 MB | 56.1 MB |
| Events in quadrant A | 2,122,507 | 387,353 |
| Events in quadrant B | 2,225,149 | 390,092 |
| Events in quadrant C | 2,054,428 | 385,935 |
| Events in quadrant D | 2,821,179 | 314,120 |
| Mode M9 | |||
|---|---|---|---|
| Quadrant | BADHDUFLAG | Total packets | Discarded packets |
| A | 0 | 21 | 9 |
| B | 0 | 21 | 8 |
| C | 0 | 19 | 9 |
| D | 0 | 21 | 8 |
| Mode SS | |||
|---|---|---|---|
| Quadrant | BADHDUFLAG | Total packets | Discarded packets |
| A | 0 | 146 | 48 |
| B | 0 | 146 | 56 |
| C | 0 | 146 | 42 |
| D | 0 | 146 | 48 |
| Mode M0 | |||
|---|---|---|---|
| Quadrant | BADHDUFLAG | Total packets | Discarded packets |
| A | 0 | 14853 | 5673 |
| B | 0 | 15106 | 5809 |
| C | 0 | 14825 | 5754 |
| D | 0 | 21404 | 10150 |
| Quadrant | Total seconds | Saturated seconds | Saturation percentage |
|---|---|---|---|
| A | 4421 | 108 | 2.442886% |
| B | 4413 | 110 | 2.492635% |
| C | 4382 | 80 | 1.825650% |
| D | 3767 | 119 | 3.159012% |
Noise dominated data is calculated using 1-second bins in cleaned event files. If a bin has >2000 counts, and if more than 50% of those come from <1% of pixels, then it is considered to be noise-dominated and hence unusable.
| Quadrant | # 1 sec bins | Bins with >0 counts | Bins with >2000 counts | High rate bins dominated by noise | Noise dominated (total time) | Noise dominated (detector-on time) | Marked lightcurve |
|---|---|---|---|---|---|---|---|
| A | 9137 | 5712 | 0 | 0 | 0.00% | 0.00% | 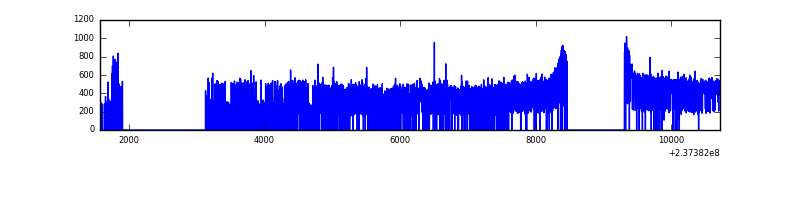 |
| B | 9146 | 5682 | 0 | 0 | 0.00% | 0.00% | 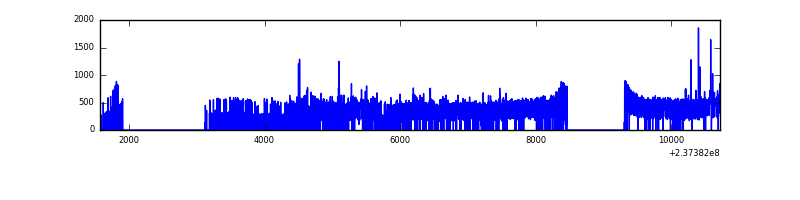 |
| C | 9109 | 5665 | 0 | 0 | 0.00% | 0.00% | 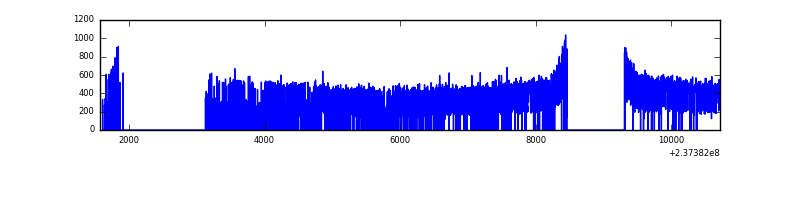 |
| D | 9076 | 5117 | 14 | 14 | 0.15% | 0.27% | 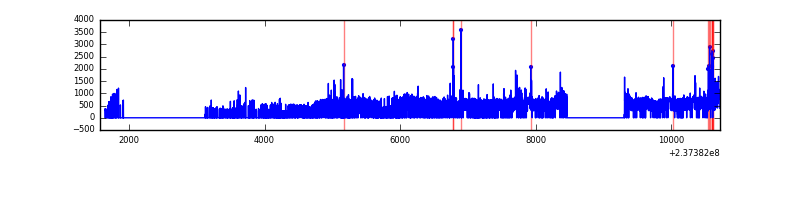 |
Top three noisy pixels from each quadrant. If the there are fewer than three noisy pixels in the level2.evt file, extra rows are filled as -1
| Pixel properties | Quadrant properties | ||||||
|---|---|---|---|---|---|---|---|
| Quadrant | DetID | PixID | Counts | Sigma | Mean | Median | Sigma |
| A | 13 | 248 | 11284 | 94.91 | 548 | 536 | 113.2 |
| A | 0 | 226 | 5066 | 40.0 | 548 | 536 | 113.2 |
| A | 12 | 194 | 4570 | 35.62 | 548 | 536 | 113.2 |
| B | 0 | 214 | 37188 | 345.83 | 544 | 529 | 106.0 |
| B | 0 | 229 | 30018 | 278.19 | 544 | 529 | 106.0 |
| B | 0 | 219 | 20611 | 189.45 | 544 | 529 | 106.0 |
| C | 13 | 61 | 3927 | 27.6 | 526 | 527 | 123.2 |
| C | 3 | 202 | 1353 | 6.71 | 526 | 527 | 123.2 |
| C | -1 | -1 | -1 | -1.0 | 526 | 527 | 123.2 |
| D | 8 | 195 | 891259 | 8094.59 | 449 | 438 | 110.1 |
| D | 12 | 233 | 108388 | 980.9 | 449 | 438 | 110.1 |
| D | 13 | 104 | 38938 | 349.84 | 449 | 438 | 110.1 |
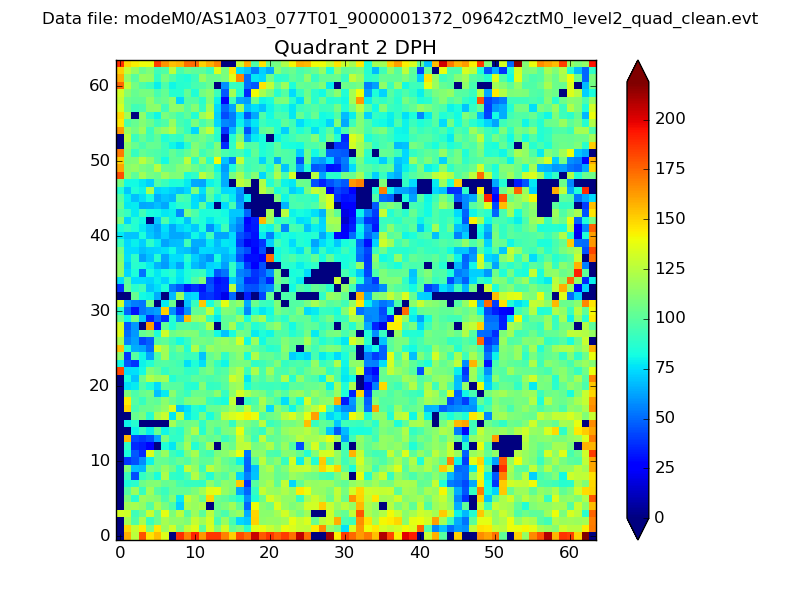
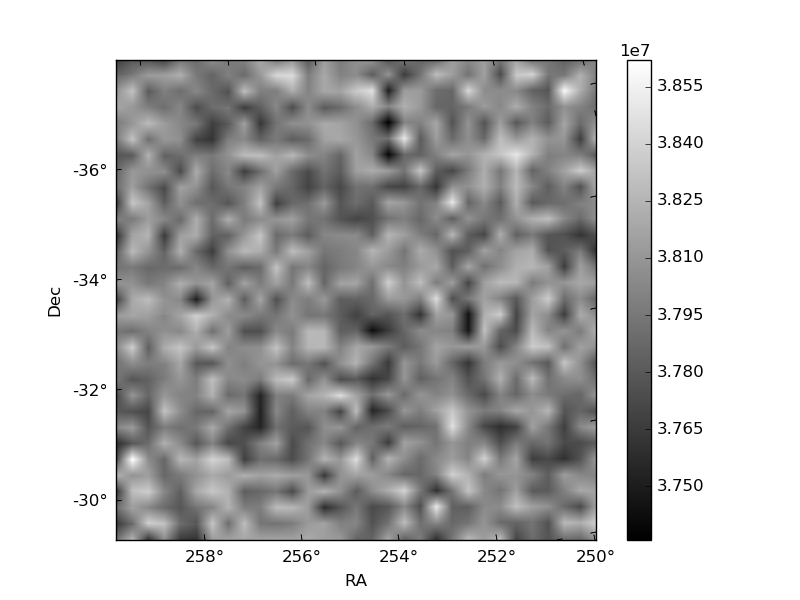
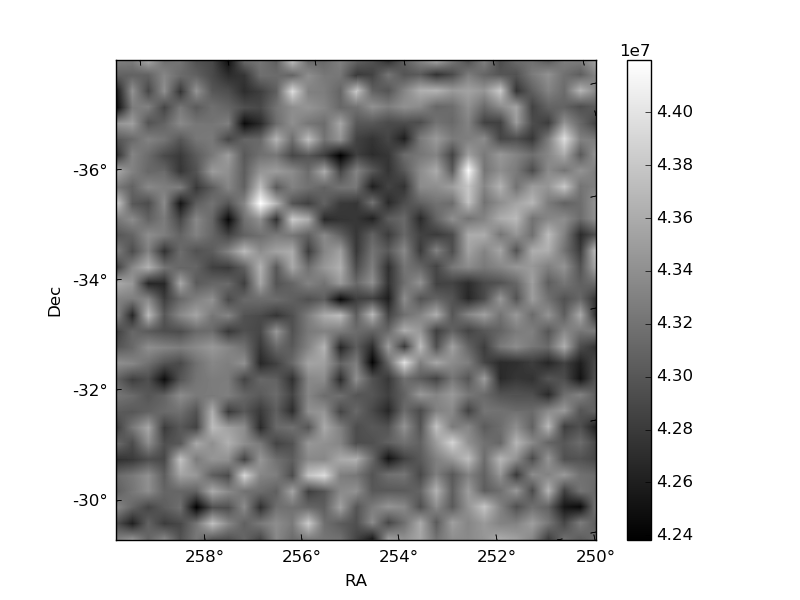
Histogram calculated using DETX and DETY for each event in the final _common_clean file
| Quadrant A | 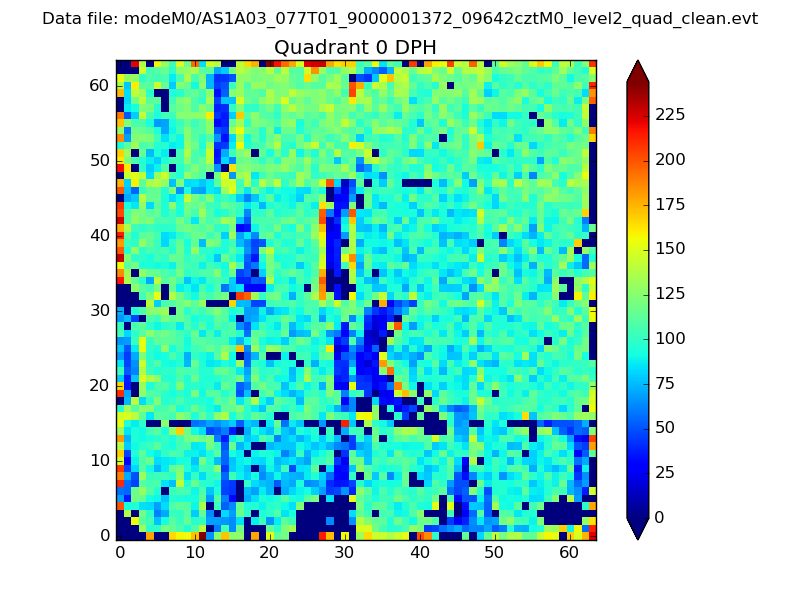 |
 |
Quadrant B |
|---|---|---|---|
| Quadrant D |  |
 |
Quadrant C |
| Plot type | Count rate plots | Images |
|---|---|---|
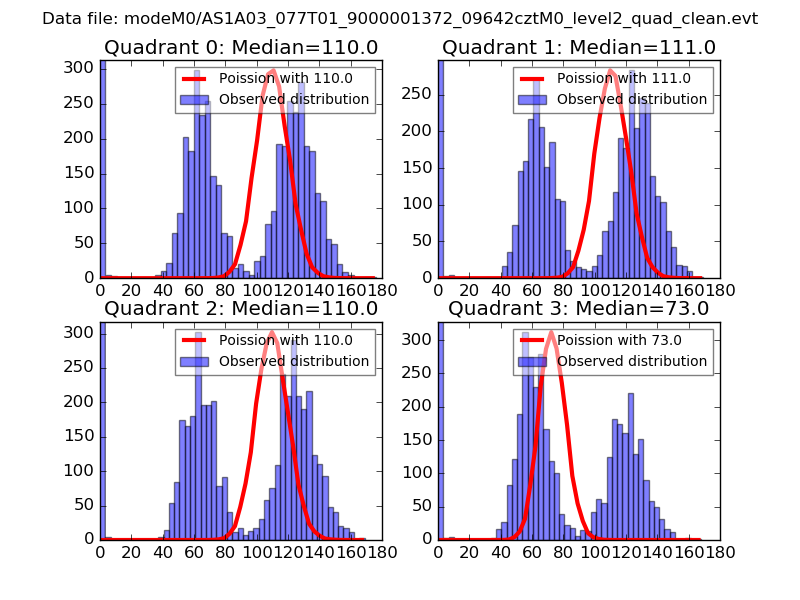
| Comparison with Poisson distribution Blue bars denote a histogram of data divided into 1 sec bins. Red curve is a Poisson curve with rate = median count rate of data. |
 |
 |
| Quadrant-wise count rates Data is divided into 100 sec bins |
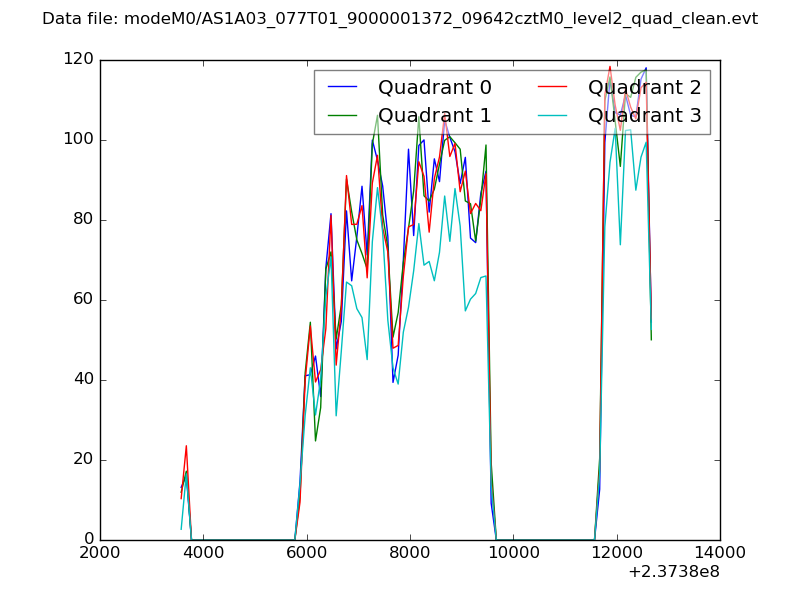 |
|
| Module-wise count rates for Quadrant A Data is divided into 100 sec bins |
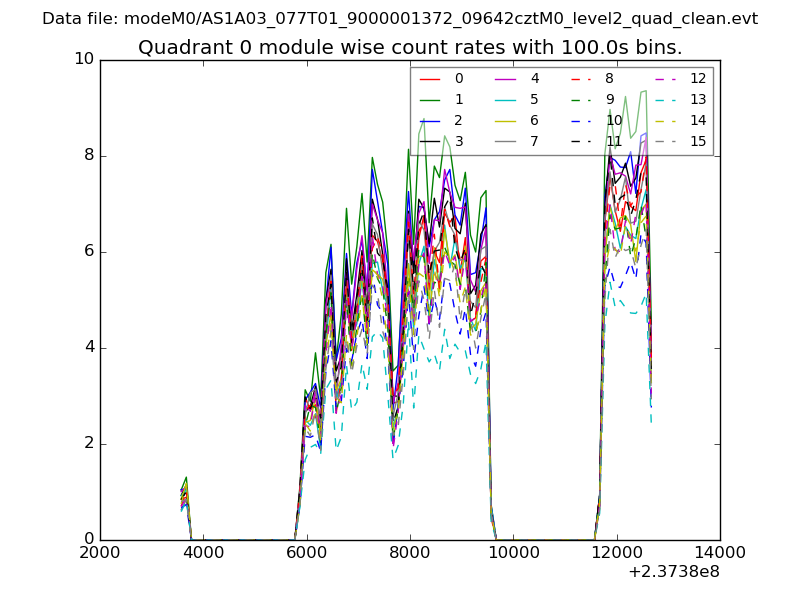 |
 |
| Module-wise count rates for Quadrant B Data is divided into 100 sec bins |
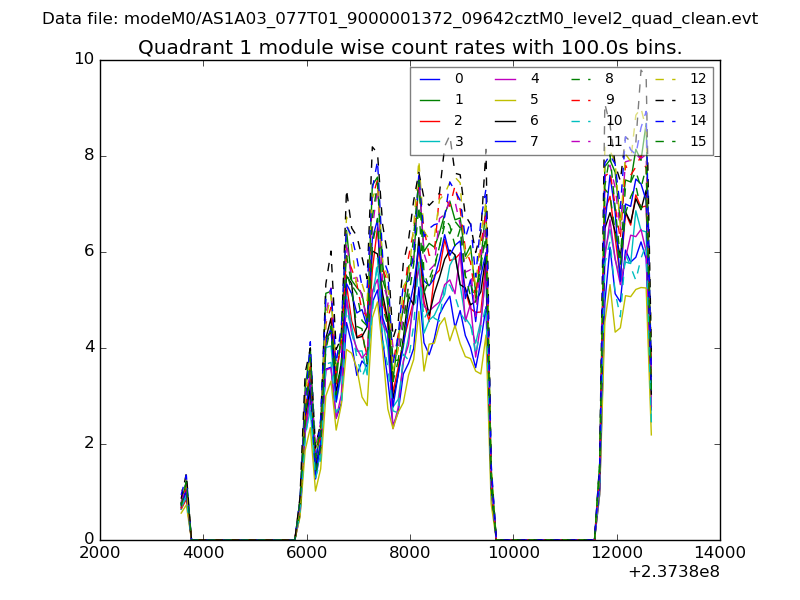 |
 |
| Module-wise count rates for Quadrant C Data is divided into 100 sec bins |
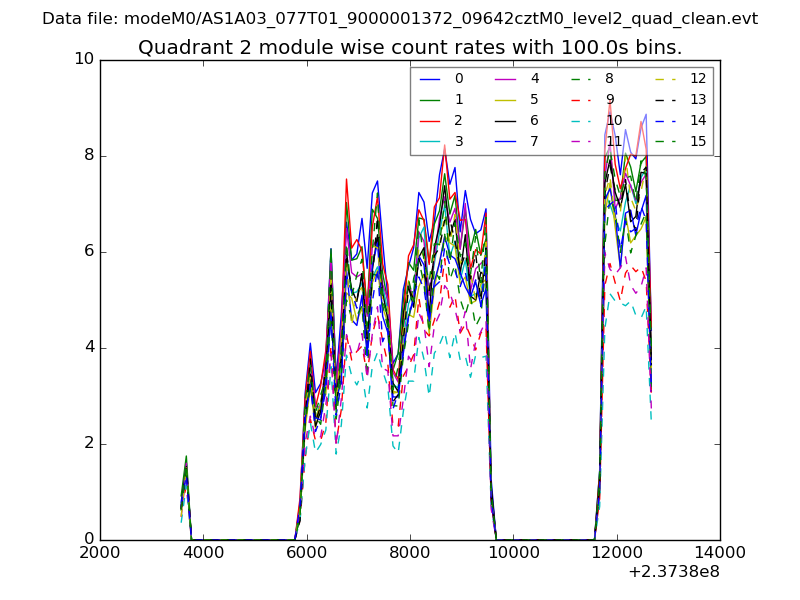 |
 |
| Module-wise count rates for Quadrant D Data is divided into 100 sec bins |
 |
 |
| Parameter | Plot |
|---|---|
| CZT HV Monitor | 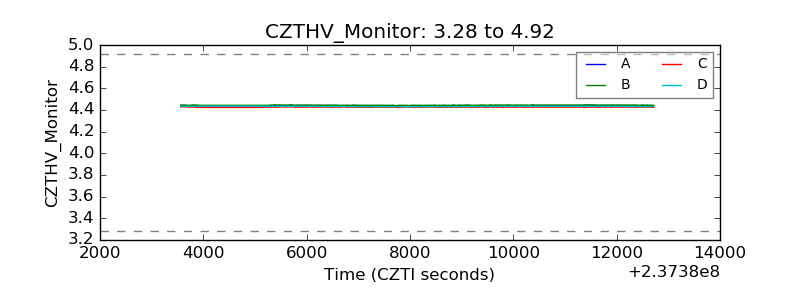 |
| D_VDD | 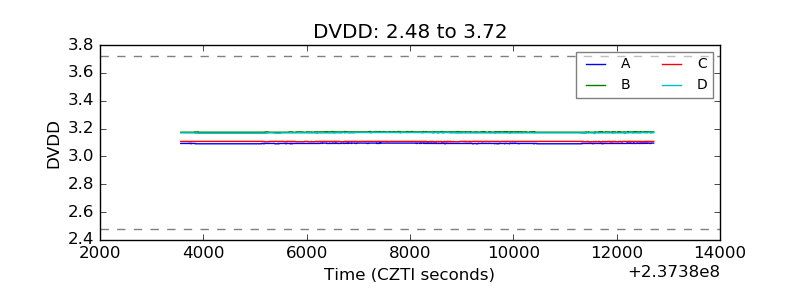 |
| Temperature 1 | 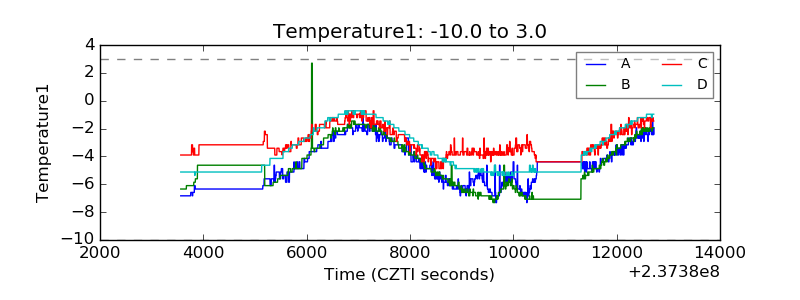 |
| Veto HV Monitor | 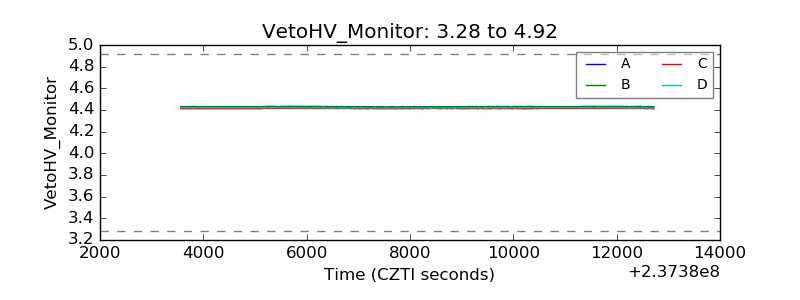 |
| Veto LLD | 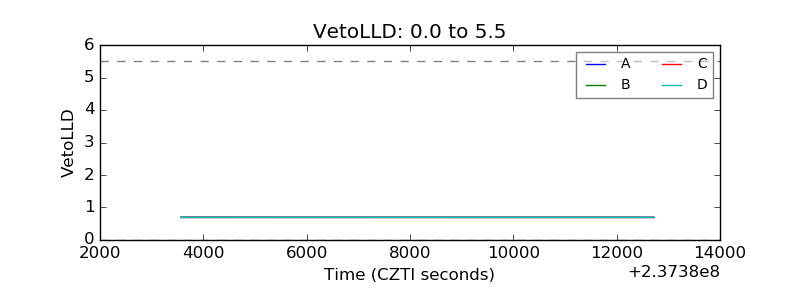 |
| Alpha Counter | 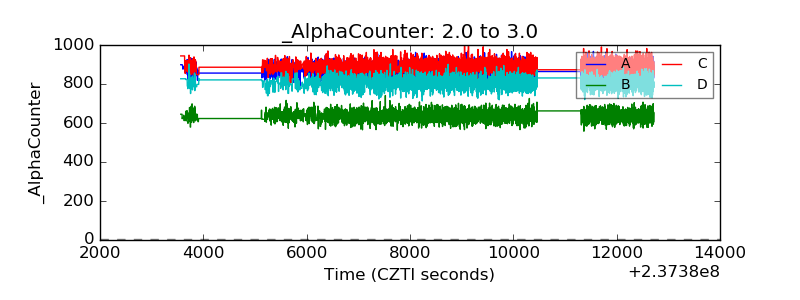 |
| _CPM_Rate | 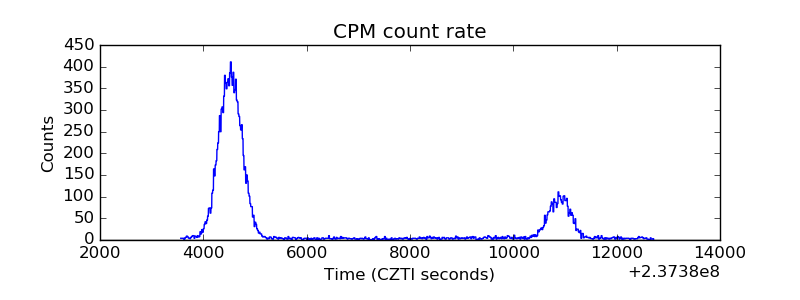 |
| CZT Counter | 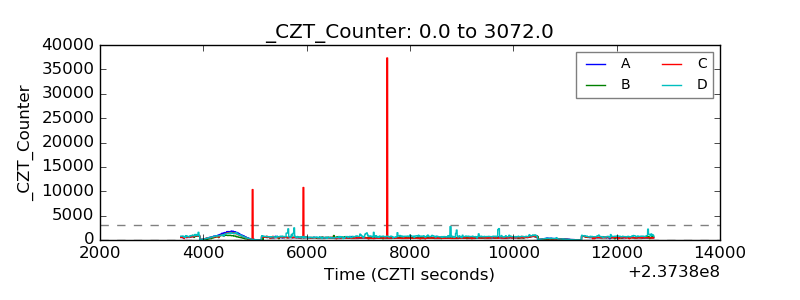 |
| +2.5 Volts monitor |  |
| +5 Volts monitor |  |
| _ROLL_ROT | 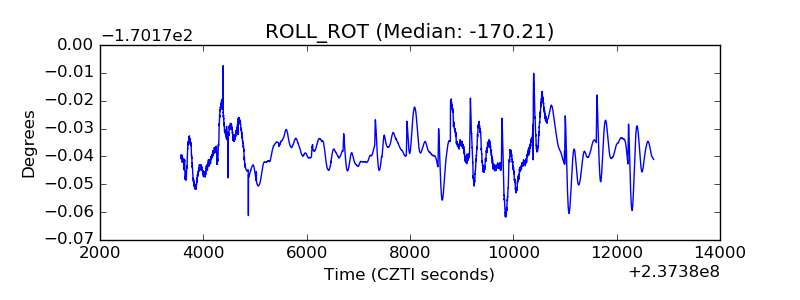 |
| _Roll_DEC | 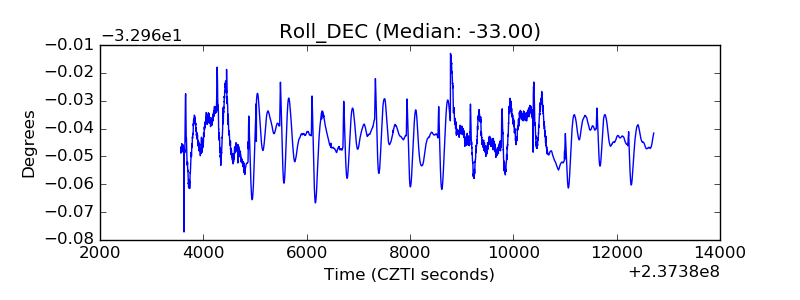 |
| _Roll_RA | 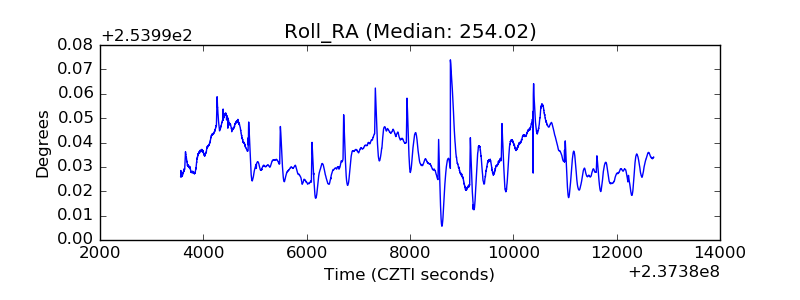 |
| Veto Counter | 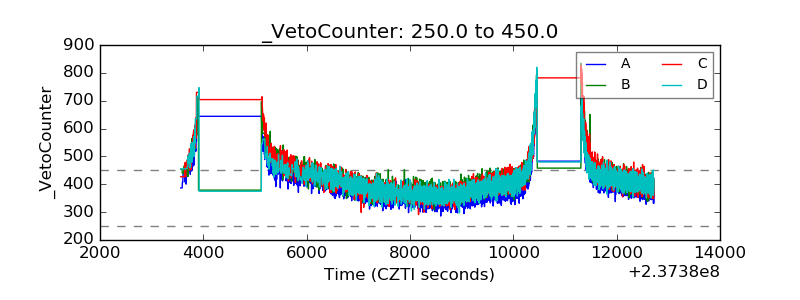 |