| Param | Original file | Final file |
|---|---|---|
| Filename | modeM0/AS1A03_077T01_9000001372_09643cztM0_level2.evt | modeM0/AS1A03_077T01_9000001372_09643cztM0_level2_quad_clean.evt |
| Size (bytes) | 1,733,875,200 | 327,954,240 |
| Size | 1.6 GB | 312.8 MB |
| Events in quadrant A | 11,525,361 | 2,103,683 |
| Events in quadrant B | 12,113,820 | 2,114,819 |
| Events in quadrant C | 11,327,639 | 2,109,185 |
| Events in quadrant D | 15,945,651 | 1,978,082 |
| Mode M9 | |||
|---|---|---|---|
| Quadrant | BADHDUFLAG | Total packets | Discarded packets |
| A | 0 | 51 | 1 |
| B | 0 | 51 | 1 |
| C | 0 | 51 | 2 |
| D | 0 | 51 | 2 |
| Mode SS | |||
|---|---|---|---|
| Quadrant | BADHDUFLAG | Total packets | Discarded packets |
| A | 0 | 552 | 52 |
| B | 0 | 549 | 55 |
| C | 0 | 552 | 64 |
| D | 0 | 549 | 59 |
| Mode M0 | |||
|---|---|---|---|
| Quadrant | BADHDUFLAG | Total packets | Discarded packets |
| A | 0 | 56035 | 7082 |
| B | 0 | 57306 | 7212 |
| C | 0 | 56012 | 6910 |
| D | 0 | 73469 | 9768 |
| Quadrant | Total seconds | Saturated seconds | Saturation percentage |
|---|---|---|---|
| A | 23643 | 374 | 1.581864% |
| B | 23681 | 417 | 1.760905% |
| C | 23695 | 323 | 1.363157% |
| D | 23373 | 554 | 2.370256% |
Noise dominated data is calculated using 1-second bins in cleaned event files. If a bin has >2000 counts, and if more than 50% of those come from <1% of pixels, then it is considered to be noise-dominated and hence unusable.
| Quadrant | # 1 sec bins | Bins with >0 counts | Bins with >2000 counts | High rate bins dominated by noise | Noise dominated (total time) | Noise dominated (detector-on time) | Marked lightcurve |
|---|---|---|---|---|---|---|---|
| A | 32234 | 24890 | 2 | 2 | 0.01% | 0.01% |  |
| B | 32234 | 24894 | 10 | 10 | 0.03% | 0.04% |  |
| C | 32234 | 24919 | 7 | 7 | 0.02% | 0.03% |  |
| D | 32234 | 24566 | 136 | 136 | 0.42% | 0.55% | 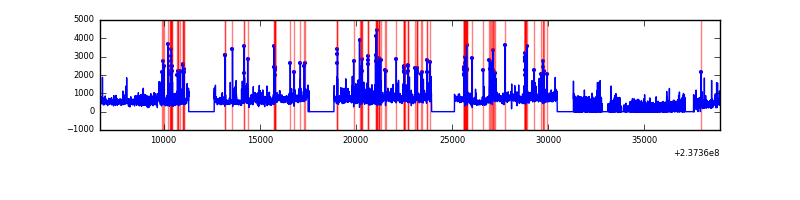 |
Top three noisy pixels from each quadrant. If the there are fewer than three noisy pixels in the level2.evt file, extra rows are filled as -1
| Pixel properties | Quadrant properties | ||||||
|---|---|---|---|---|---|---|---|
| Quadrant | DetID | PixID | Counts | Sigma | Mean | Median | Sigma |
| A | 13 | 248 | 36087 | 55.52 | 2978 | 2920 | 597.4 |
| A | 0 | 226 | 27905 | 41.82 | 2978 | 2920 | 597.4 |
| A | 14 | 111 | 26809 | 39.99 | 2978 | 2920 | 597.4 |
| B | 0 | 214 | 246930 | 435.81 | 2977 | 2913 | 559.9 |
| B | 0 | 229 | 108604 | 188.76 | 2977 | 2913 | 559.9 |
| B | 0 | 219 | 96158 | 166.53 | 2977 | 2913 | 559.9 |
| C | 14 | 234 | 50271 | 71.9 | 2891 | 2905 | 658.8 |
| C | 13 | 61 | 21709 | 28.54 | 2891 | 2905 | 658.8 |
| C | 3 | 202 | 7321 | 6.7 | 2891 | 2905 | 658.8 |
| D | 8 | 195 | 3594187 | 5309.36 | 2841 | 2775 | 676.4 |
| D | 13 | 104 | 416789 | 612.06 | 2841 | 2775 | 676.4 |
| D | 1 | 52 | 405899 | 595.96 | 2841 | 2775 | 676.4 |
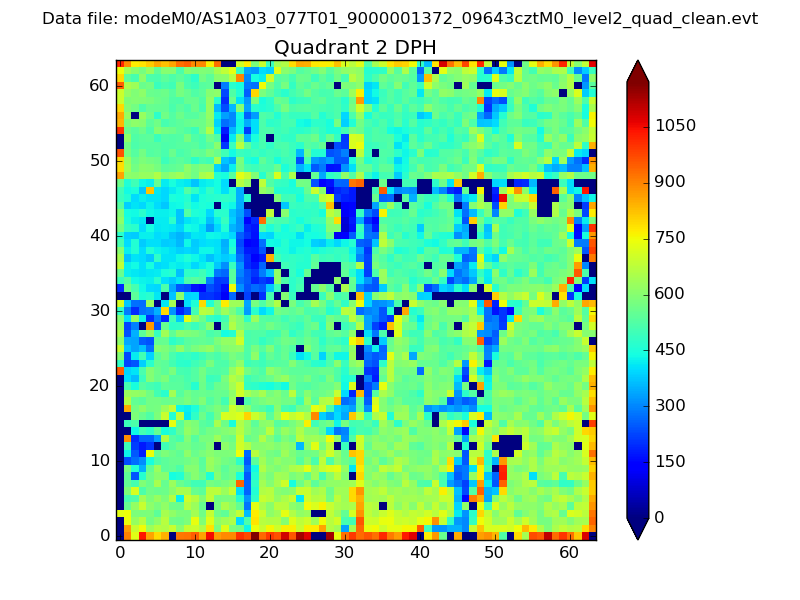
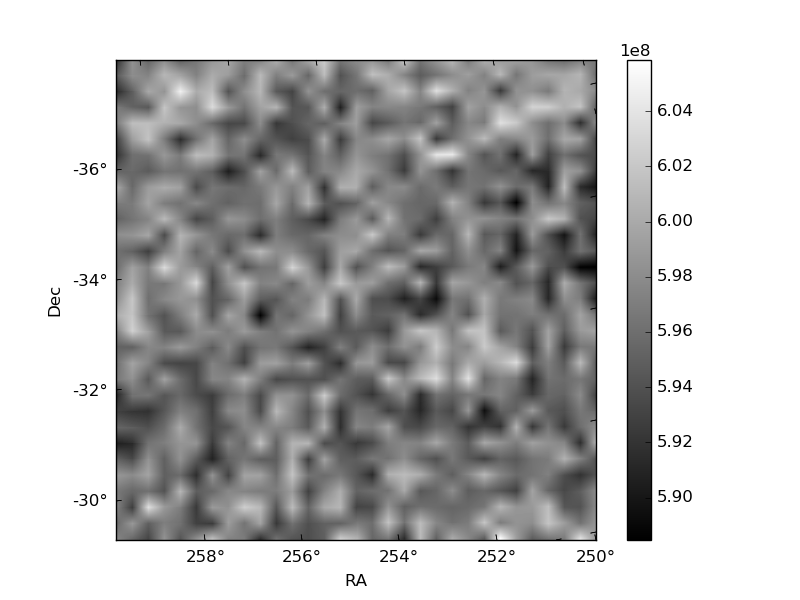
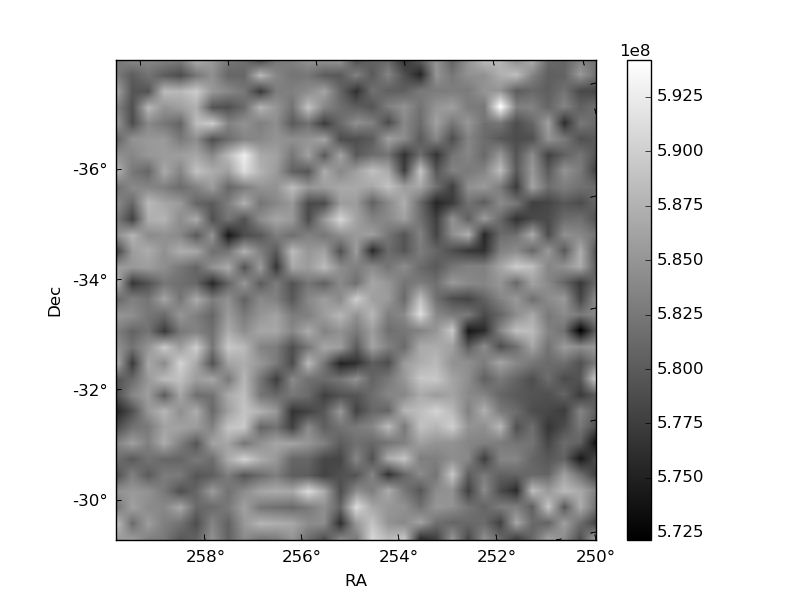
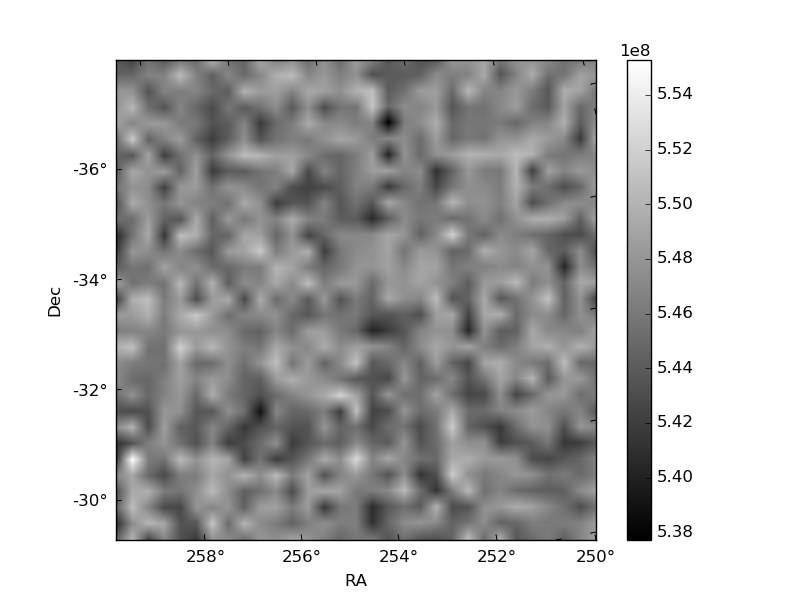
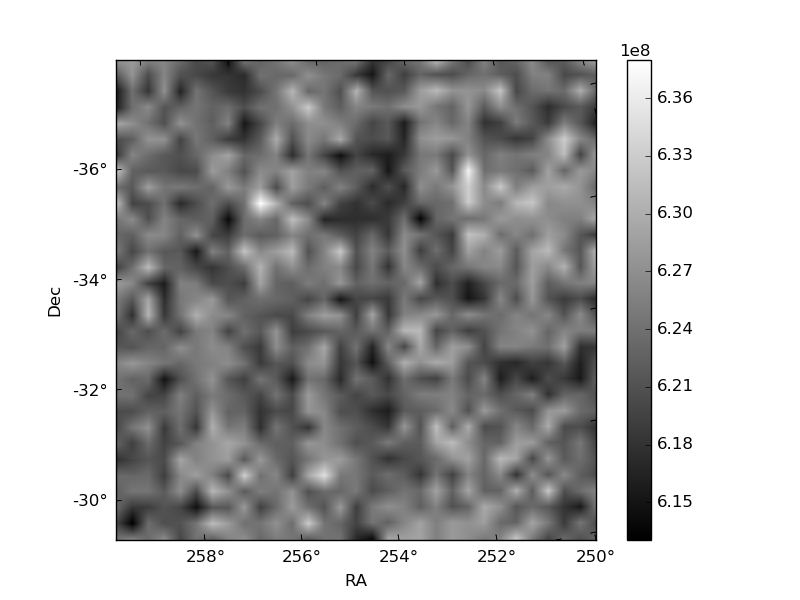
Histogram calculated using DETX and DETY for each event in the final _common_clean file
| Quadrant A | 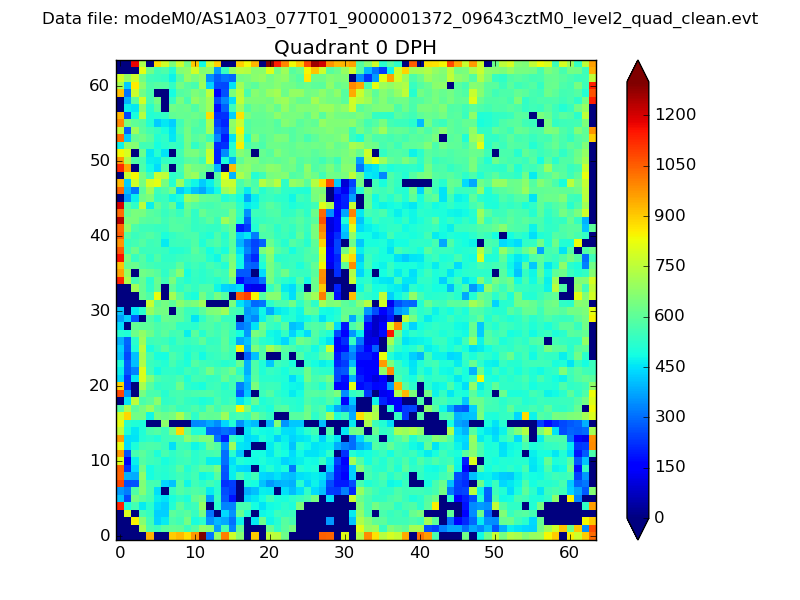 |
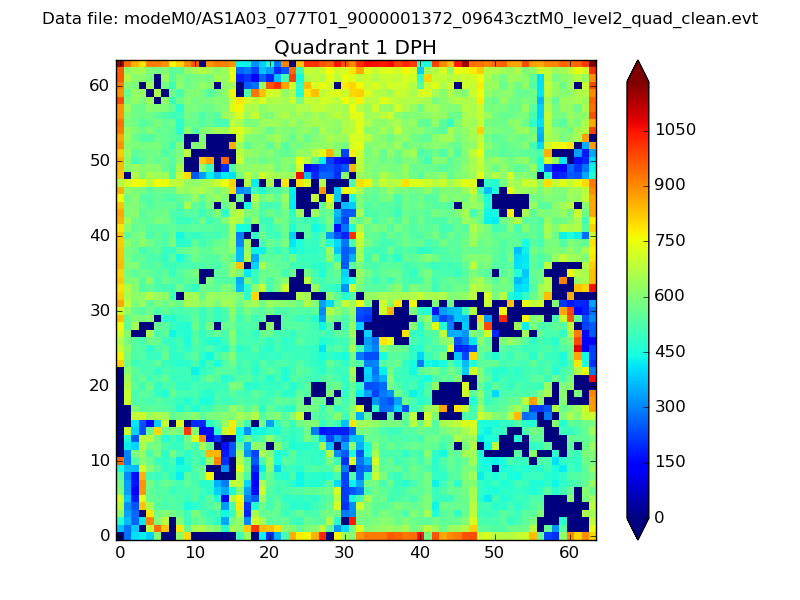 |
Quadrant B |
|---|---|---|---|
| Quadrant D | 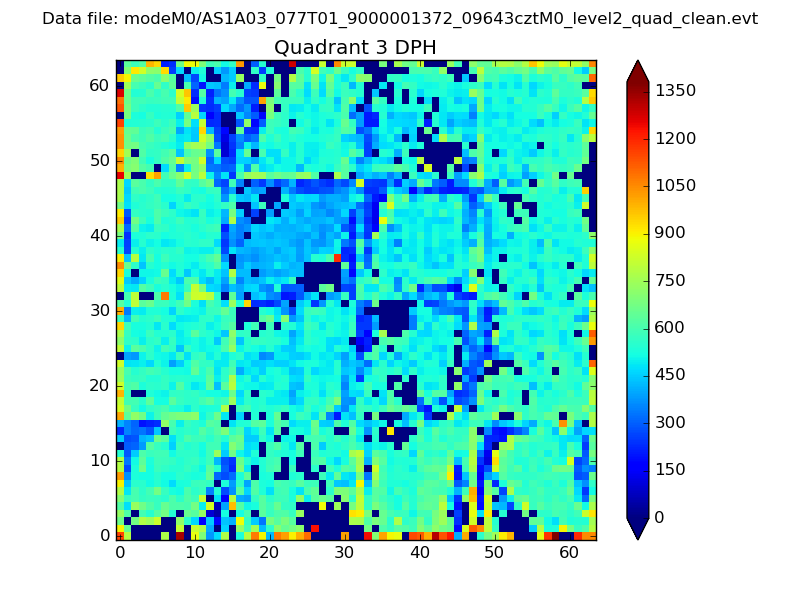 |
 |
Quadrant C |
| Plot type | Count rate plots | Images |
|---|---|---|
| Comparison with Poisson distribution Blue bars denote a histogram of data divided into 1 sec bins. Red curve is a Poisson curve with rate = median count rate of data. |
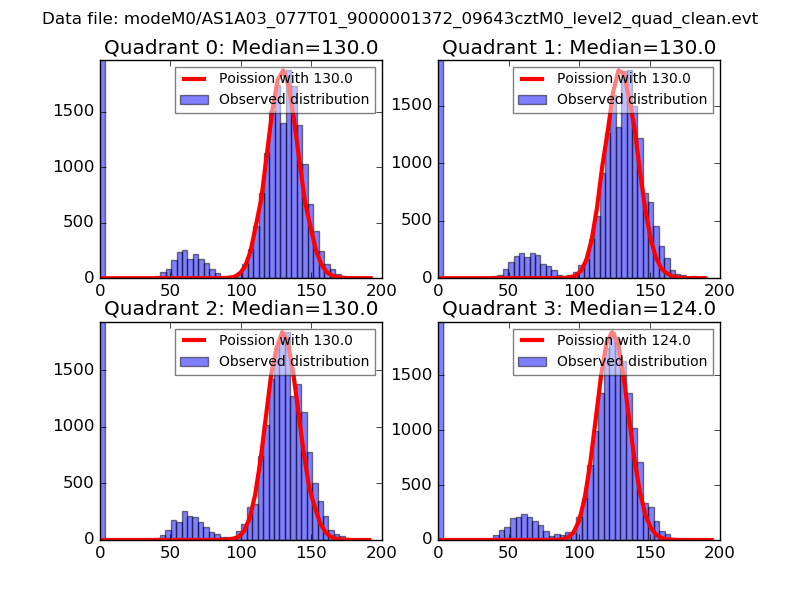 |
 |
| Quadrant-wise count rates Data is divided into 100 sec bins |
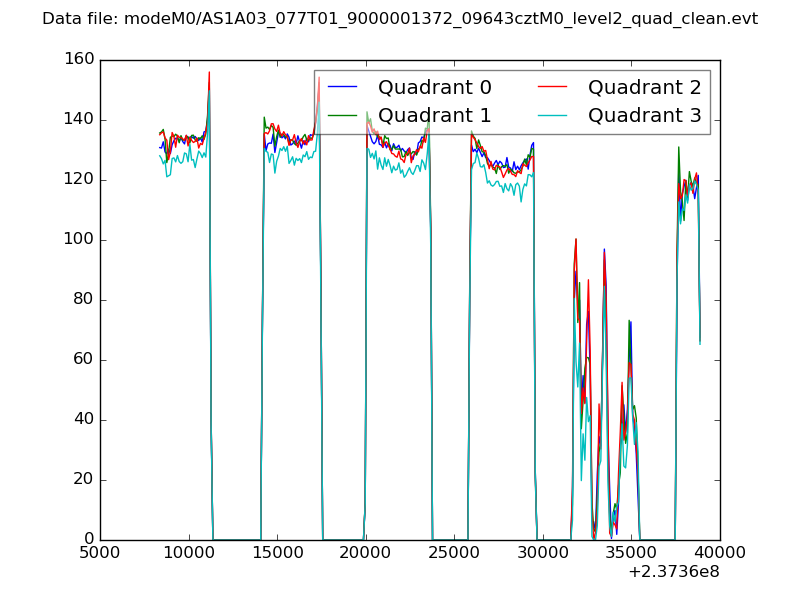 |
|
| Module-wise count rates for Quadrant A Data is divided into 100 sec bins |
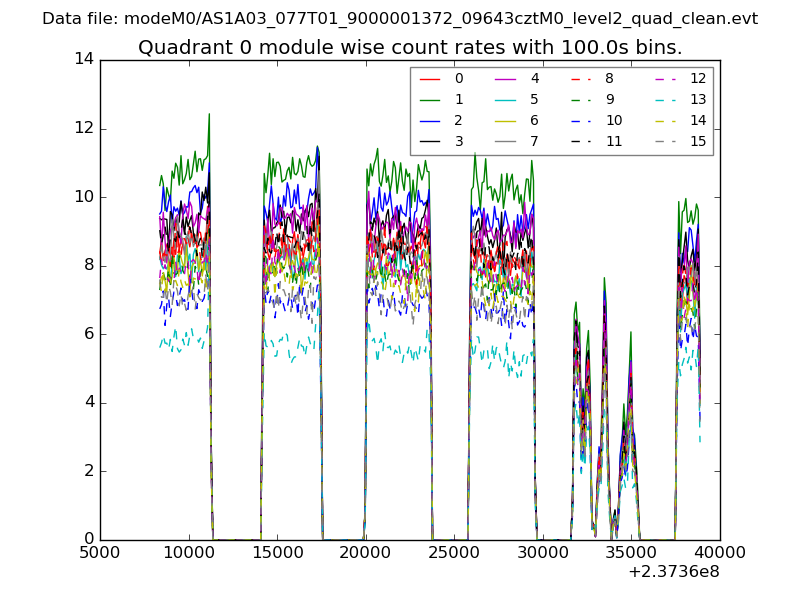 |
 |
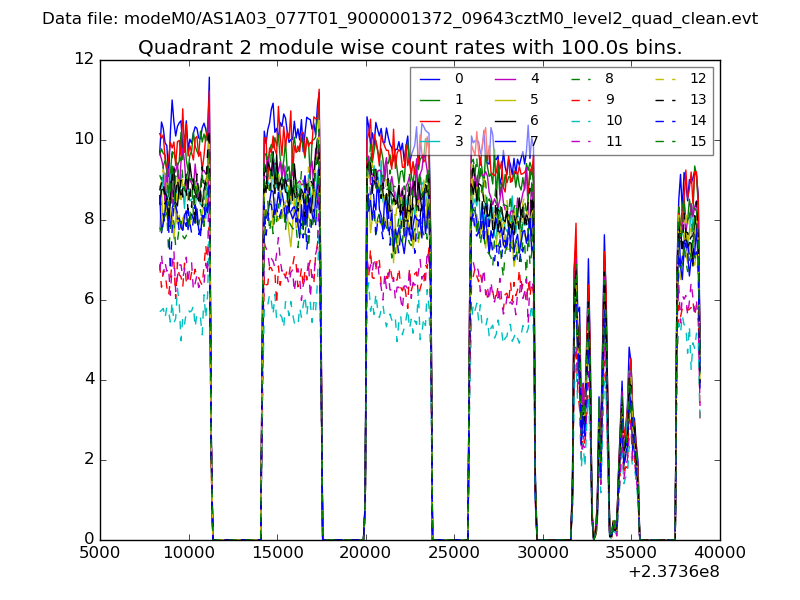
| Module-wise count rates for Quadrant B Data is divided into 100 sec bins |
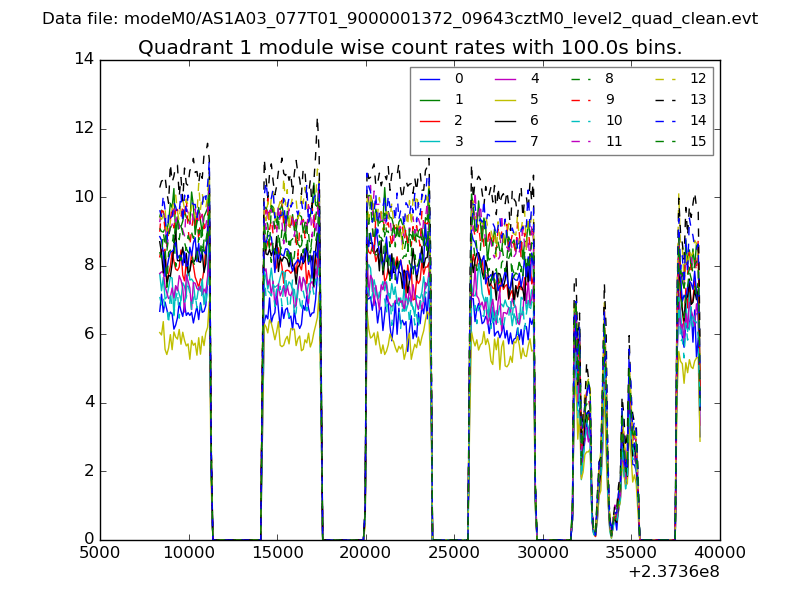 |
 |
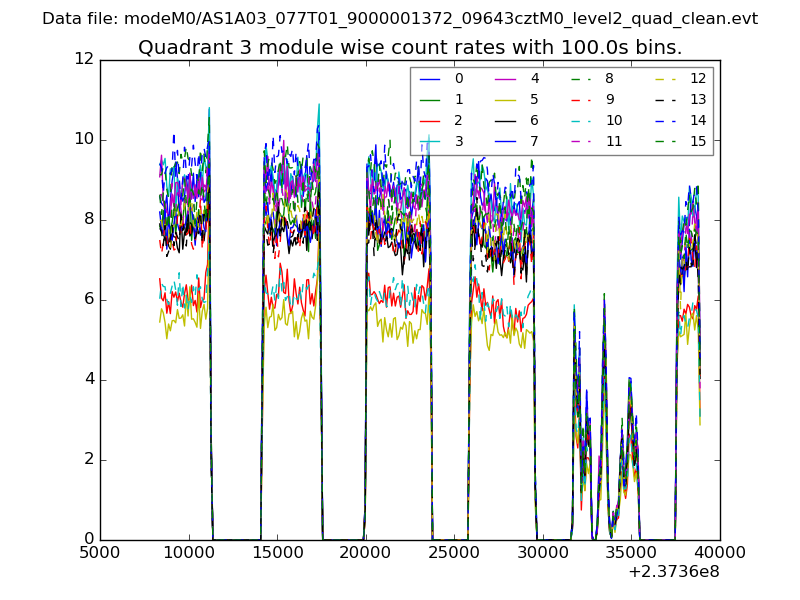
| Module-wise count rates for Quadrant C Data is divided into 100 sec bins |
 |
 |
| Module-wise count rates for Quadrant D Data is divided into 100 sec bins |
 |
 |
| Parameter | Plot |
|---|---|
| CZT HV Monitor | 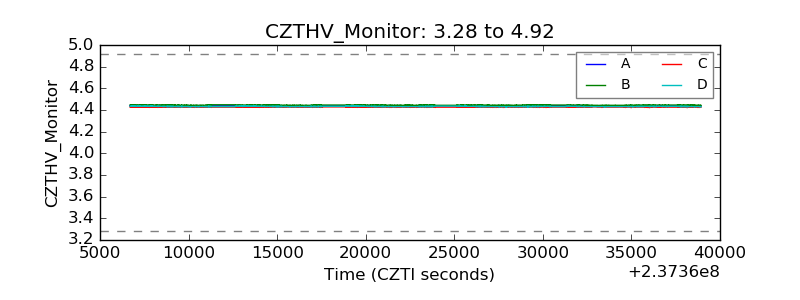 |
| D_VDD | 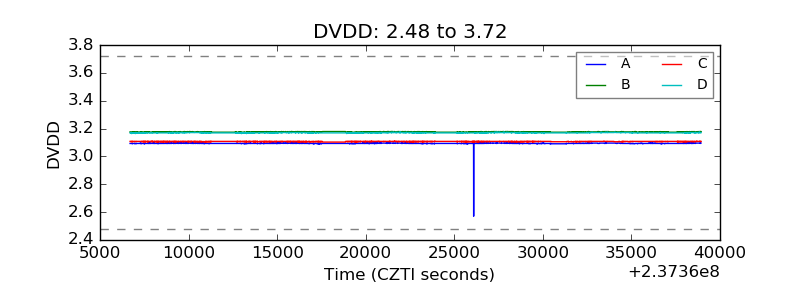 |
| Temperature 1 | 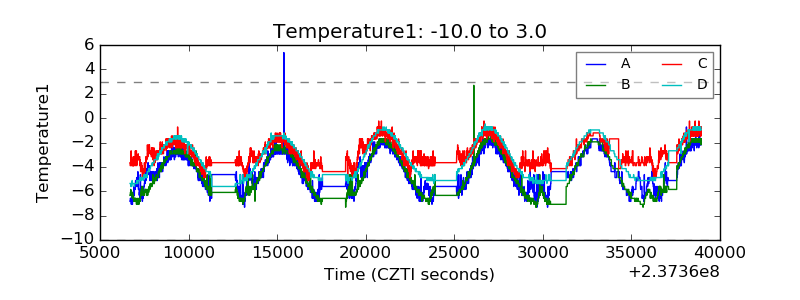 |
| Veto HV Monitor | 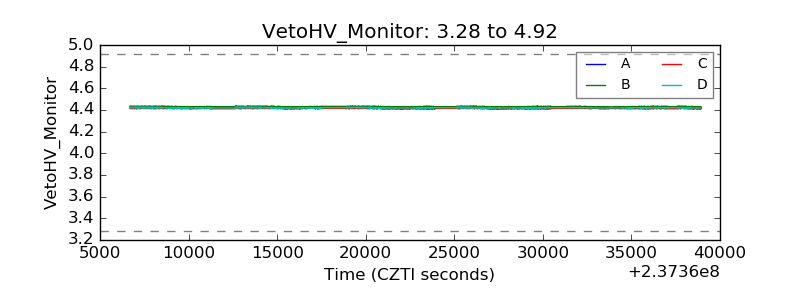 |
| Veto LLD | 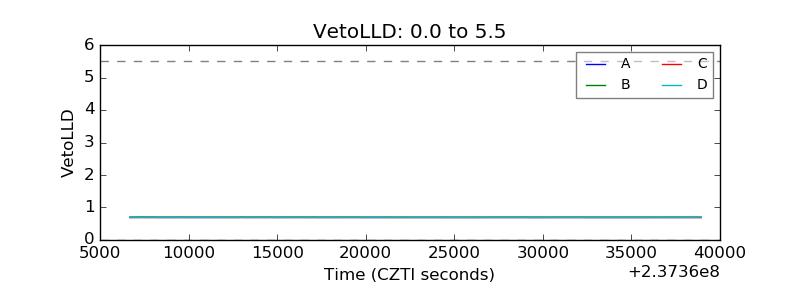 |
| Alpha Counter | 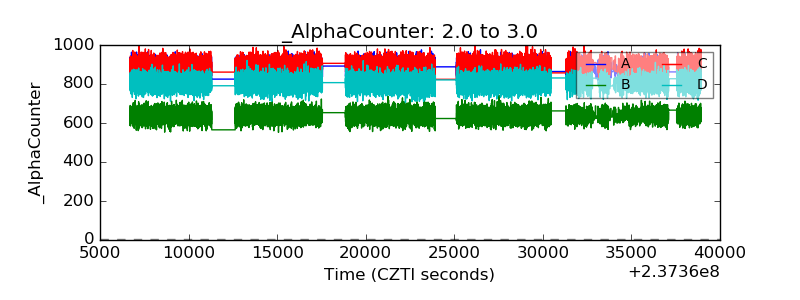 |
| _CPM_Rate | 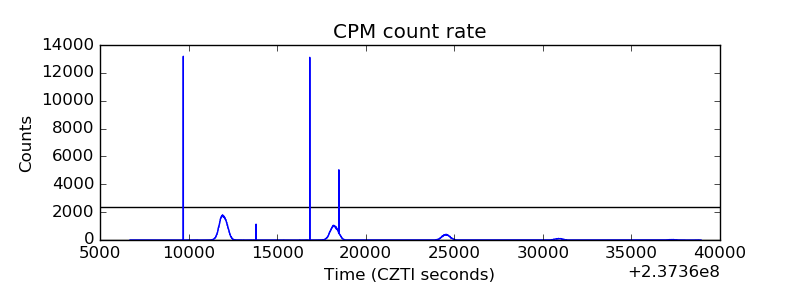 |
| CZT Counter | 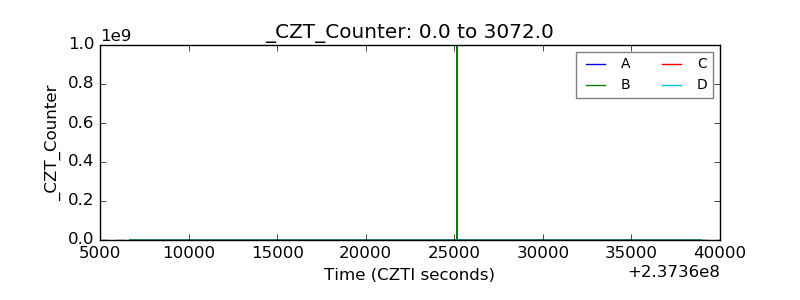 |
| +2.5 Volts monitor |  |
| +5 Volts monitor |  |
| _ROLL_ROT | 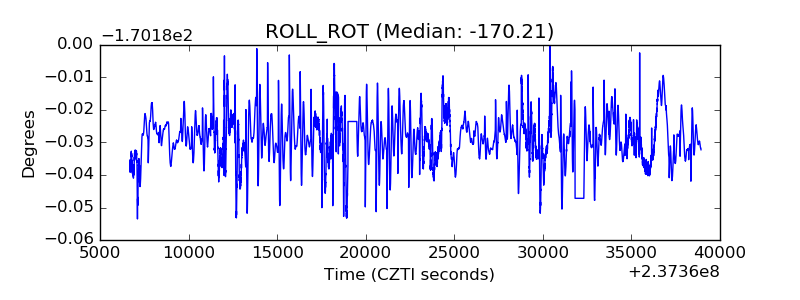 |
| _Roll_DEC | 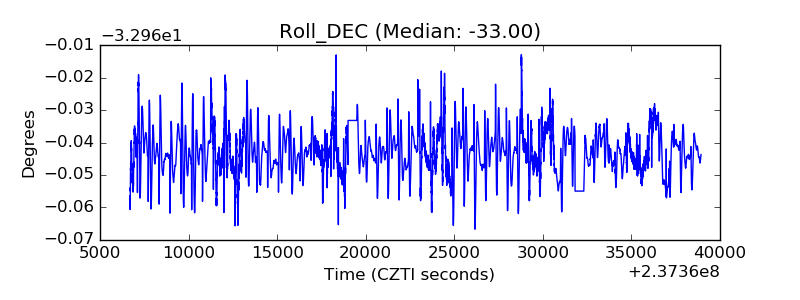 |
| _Roll_RA | 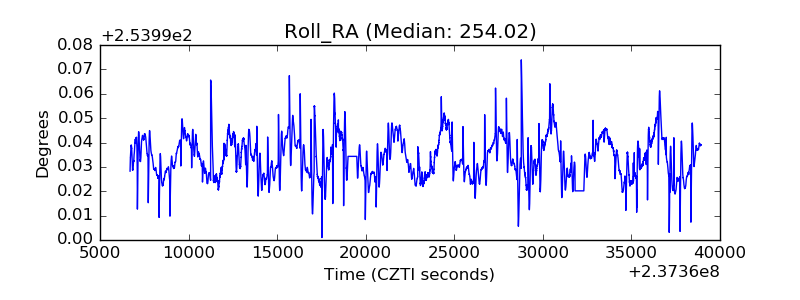 |
| Veto Counter | 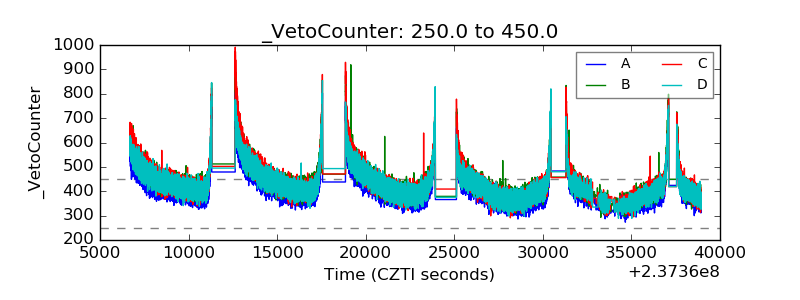 |