| Param | Original file | Final file |
|---|---|---|
| Filename | modeM0/AS1A03_077T01_9000001372_09644cztM0_level2.evt | modeM0/AS1A03_077T01_9000001372_09644cztM0_level2_quad_clean.evt |
| Size (bytes) | 176,806,080 | 33,114,240 |
| Size | 168.6 MB | 31.6 MB |
| Events in quadrant A | 1,322,069 | 209,939 |
| Events in quadrant B | 1,294,028 | 195,845 |
| Events in quadrant C | 1,267,880 | 218,477 |
| Events in quadrant D | 1,277,849 | 178,985 |
| Mode M9 | |||
|---|---|---|---|
| Quadrant | BADHDUFLAG | Total packets | Discarded packets |
| A | 0 | 7 | 4 |
| B | 0 | 7 | 2 |
| C | 0 | 7 | 4 |
| D | 0 | 7 | 4 |
| Mode SS | |||
|---|---|---|---|
| Quadrant | BADHDUFLAG | Total packets | Discarded packets |
| A | 0 | 164 | 98 |
| B | 0 | 163 | 103 |
| C | 0 | 164 | 98 |
| D | 0 | 163 | 97 |
| Mode M0 | |||
|---|---|---|---|
| Quadrant | BADHDUFLAG | Total packets | Discarded packets |
| A | 0 | 16677 | 10862 |
| B | 0 | 17149 | 11593 |
| C | 0 | 16485 | 10698 |
| D | 0 | 19603 | 14106 |
| Quadrant | Total seconds | Saturated seconds | Saturation percentage |
|---|---|---|---|
| A | 2796 | 39 | 1.394850% |
| B | 2692 | 29 | 1.077266% |
| C | 2837 | 8 | 0.281988% |
| D | 2579 | 24 | 0.930593% |
Noise dominated data is calculated using 1-second bins in cleaned event files. If a bin has >2000 counts, and if more than 50% of those come from <1% of pixels, then it is considered to be noise-dominated and hence unusable.
| Quadrant | # 1 sec bins | Bins with >0 counts | Bins with >2000 counts | High rate bins dominated by noise | Noise dominated (total time) | Noise dominated (detector-on time) | Marked lightcurve |
|---|---|---|---|---|---|---|---|
| A | 8657 | 4380 | 4 | 4 | 0.05% | 0.09% | 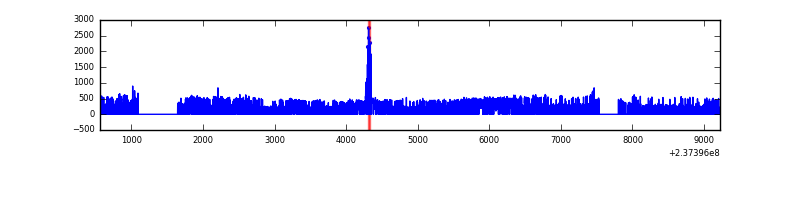 |
| B | 8660 | 4231 | 0 | 0 | 0.00% | 0.00% | 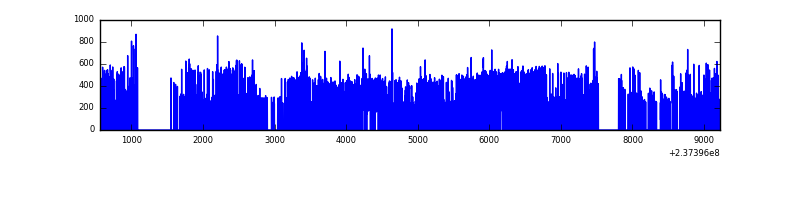 |
| C | 8655 | 4436 | 0 | 0 | 0.00% | 0.00% | 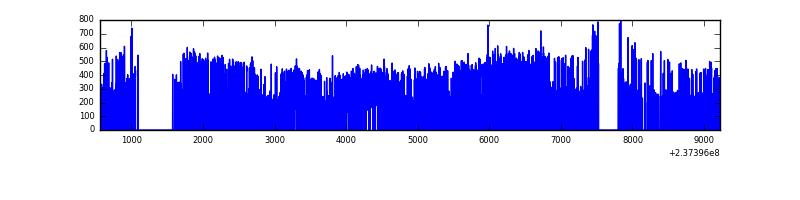 |
| D | 8655 | 4054 | 0 | 0 | 0.00% | 0.00% | 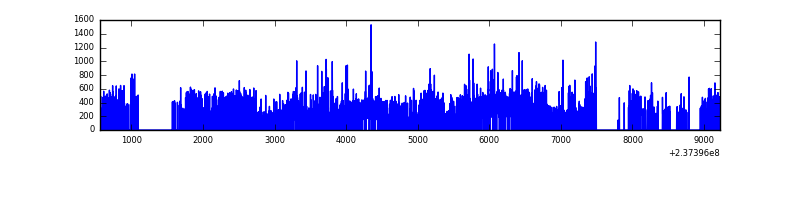 |
Top three noisy pixels from each quadrant. If the there are fewer than three noisy pixels in the level2.evt file, extra rows are filled as -1
| Pixel properties | Quadrant properties | ||||||
|---|---|---|---|---|---|---|---|
| Quadrant | DetID | PixID | Counts | Sigma | Mean | Median | Sigma |
| A | 15 | 174 | 40114 | 567.31 | 332 | 323 | 70.1 |
| A | 0 | 226 | 3159 | 40.43 | 332 | 323 | 70.1 |
| A | 12 | 194 | 2759 | 34.73 | 332 | 323 | 70.1 |
| B | 0 | 214 | 23273 | 366.15 | 318 | 310 | 62.7 |
| B | 0 | 219 | 13568 | 211.4 | 318 | 310 | 62.7 |
| B | 0 | 229 | 9902 | 152.95 | 318 | 310 | 62.7 |
| C | 13 | 61 | 2515 | 28.27 | 324 | 326 | 77.4 |
| C | 8 | 222 | 1674 | 17.41 | 324 | 326 | 77.4 |
| C | 14 | 234 | 1062 | 9.51 | 324 | 326 | 77.4 |
| D | 8 | 195 | 54192 | 722.81 | 293 | 285 | 74.6 |
| D | 12 | 233 | 23728 | 314.33 | 293 | 285 | 74.6 |
| D | 1 | 52 | 22308 | 295.29 | 293 | 285 | 74.6 |
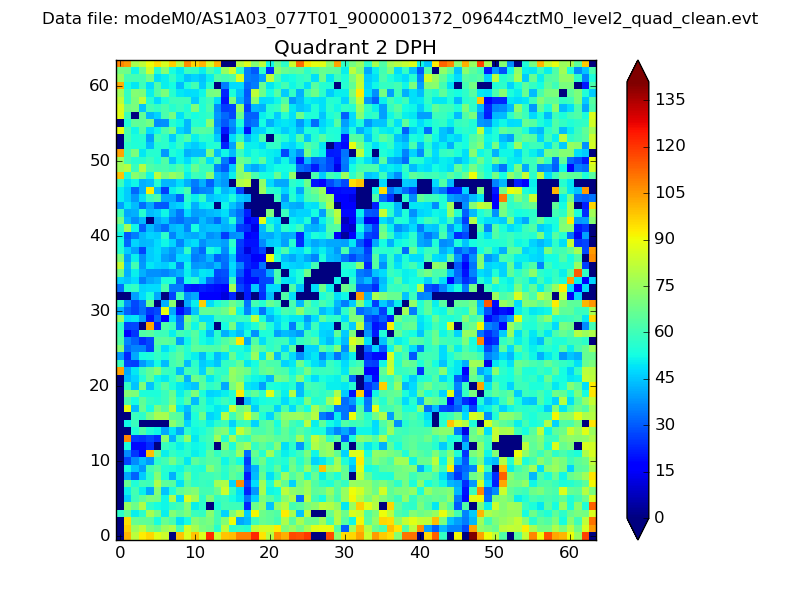
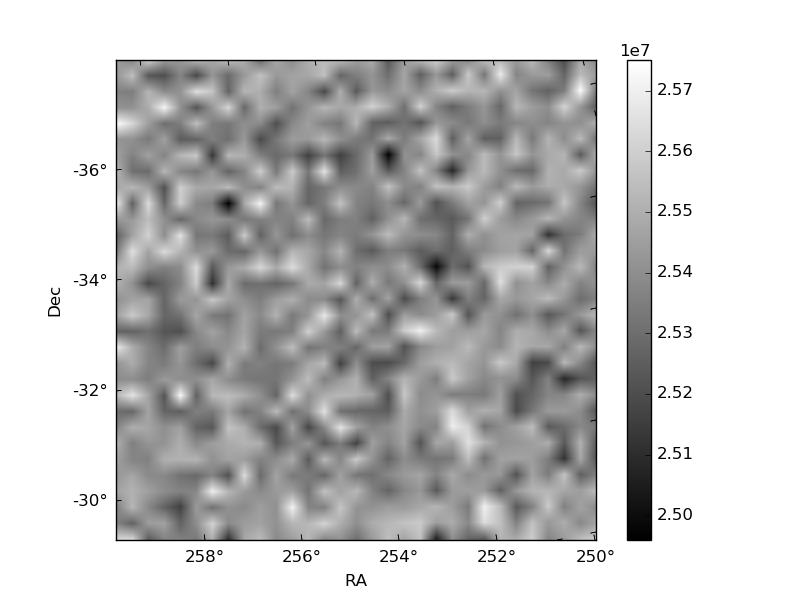
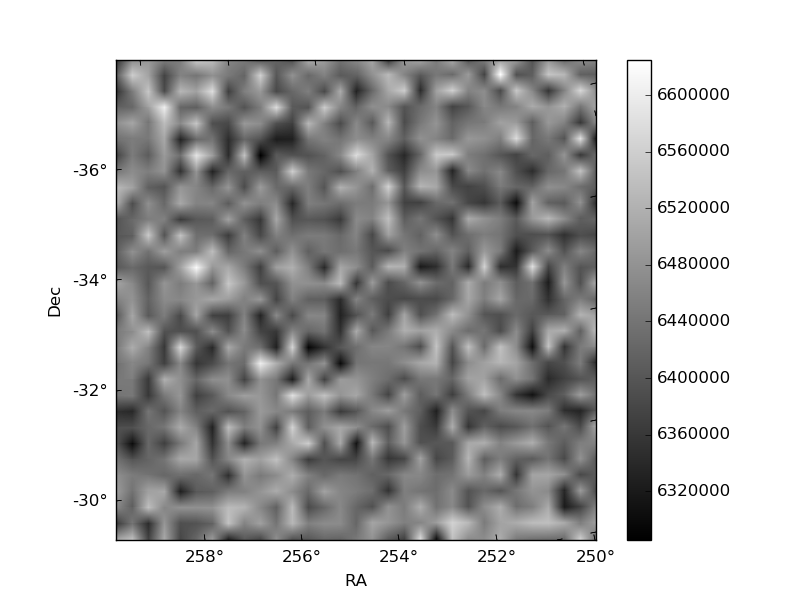
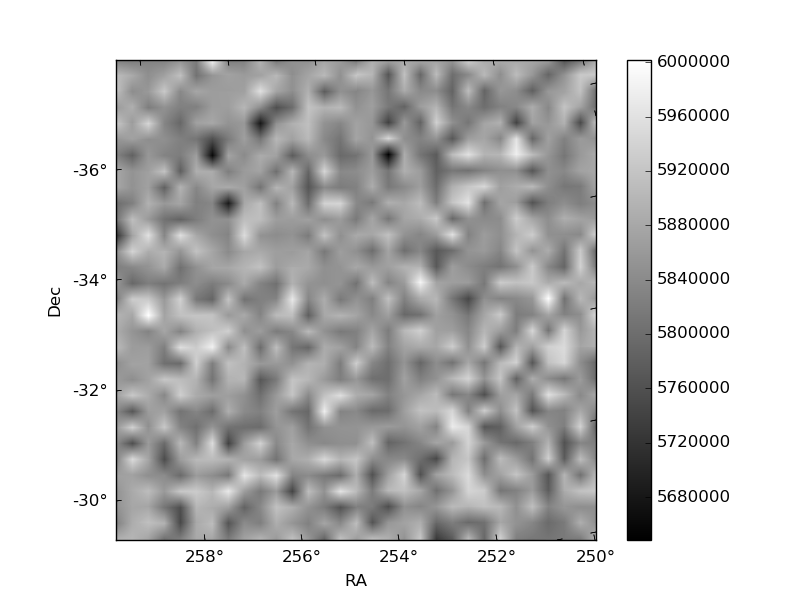
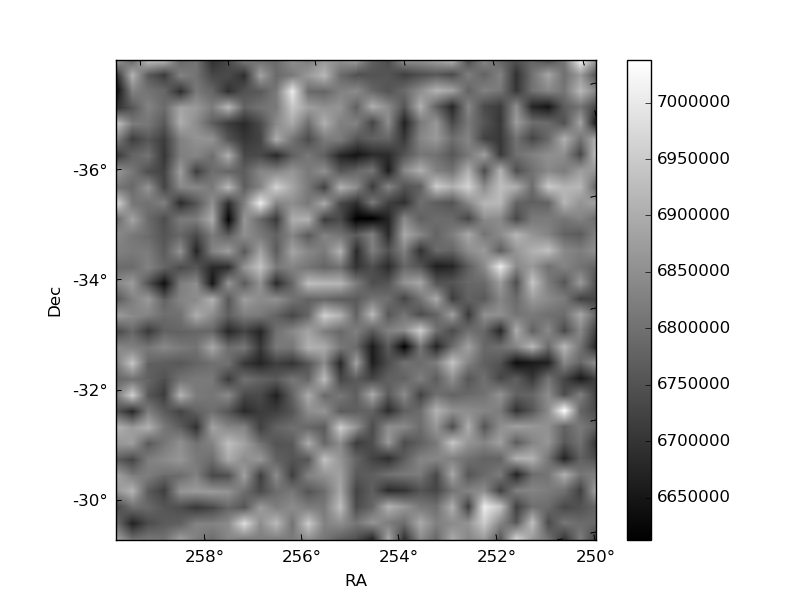
Histogram calculated using DETX and DETY for each event in the final _common_clean file
| Quadrant A | 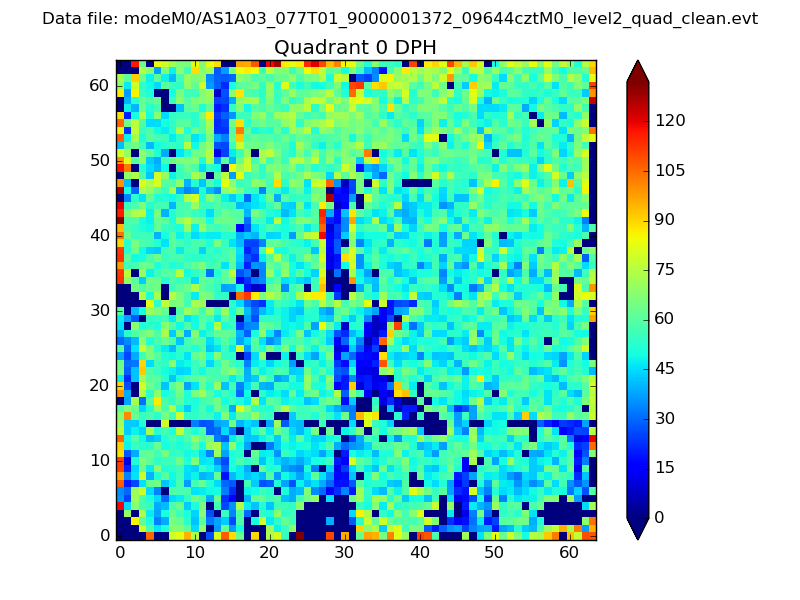 |
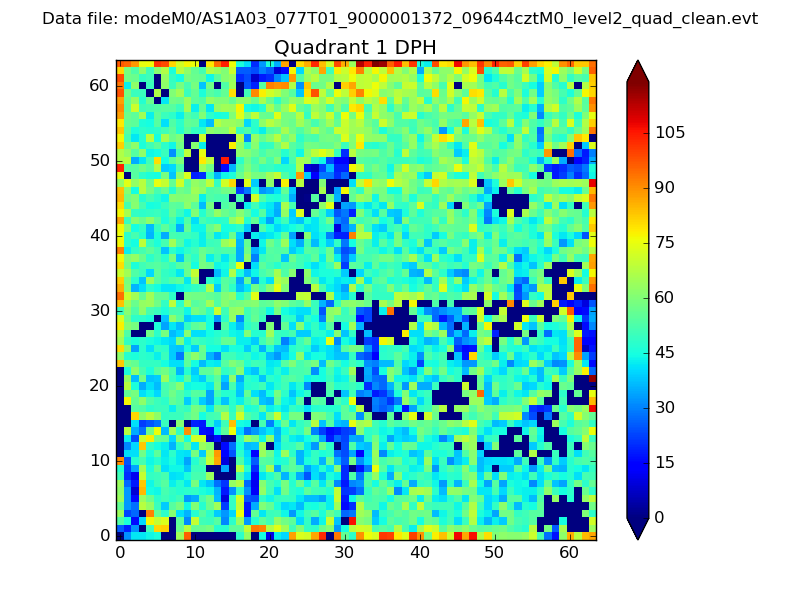 |
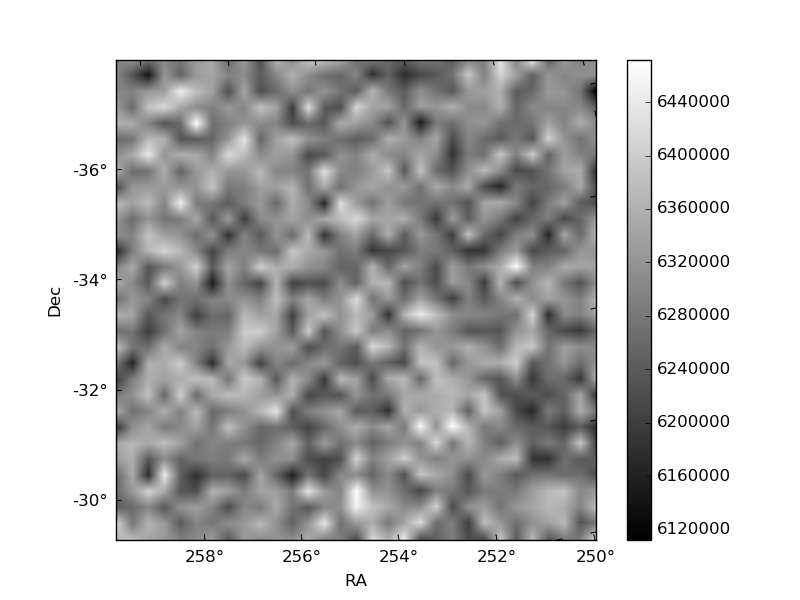
Quadrant B |
|---|---|---|---|
| Quadrant D | 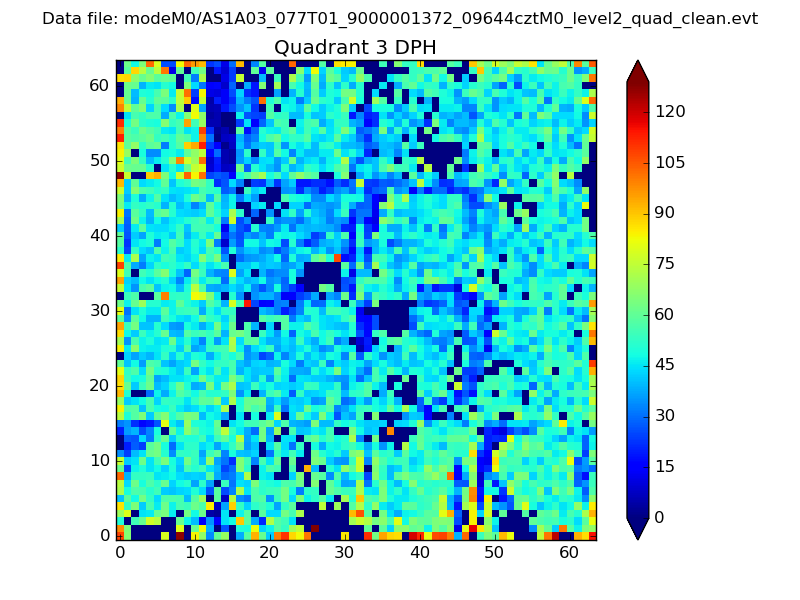 |
 |
Quadrant C |
| Plot type | Count rate plots | Images |
|---|---|---|
| Comparison with Poisson distribution Blue bars denote a histogram of data divided into 1 sec bins. Red curve is a Poisson curve with rate = median count rate of data. |
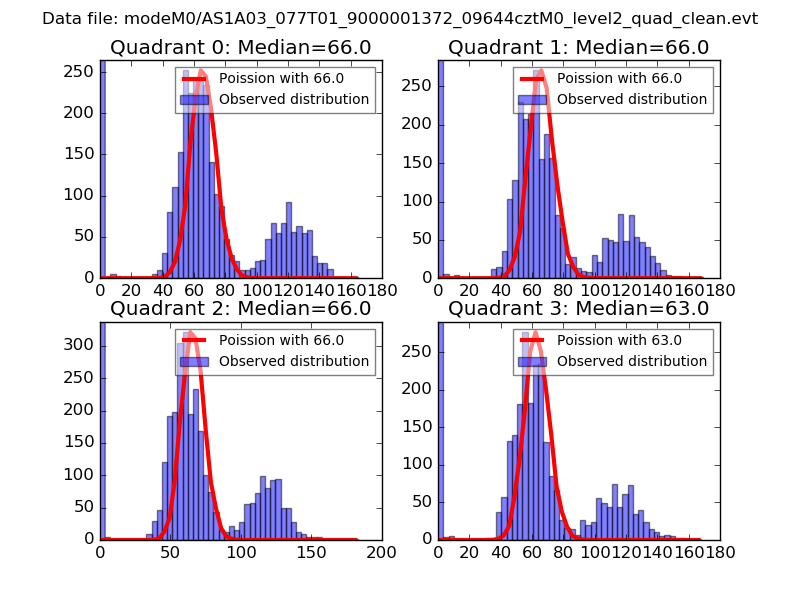 |
 |
| Quadrant-wise count rates Data is divided into 100 sec bins |
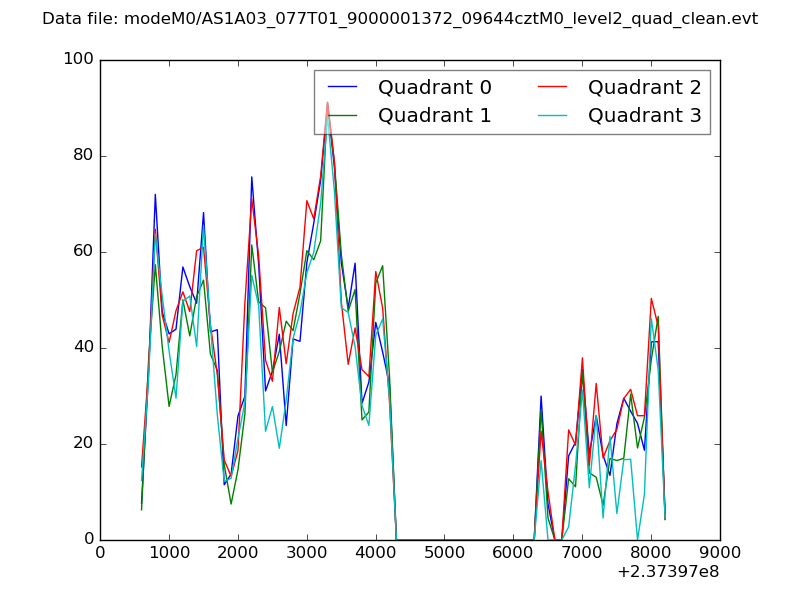 |
|
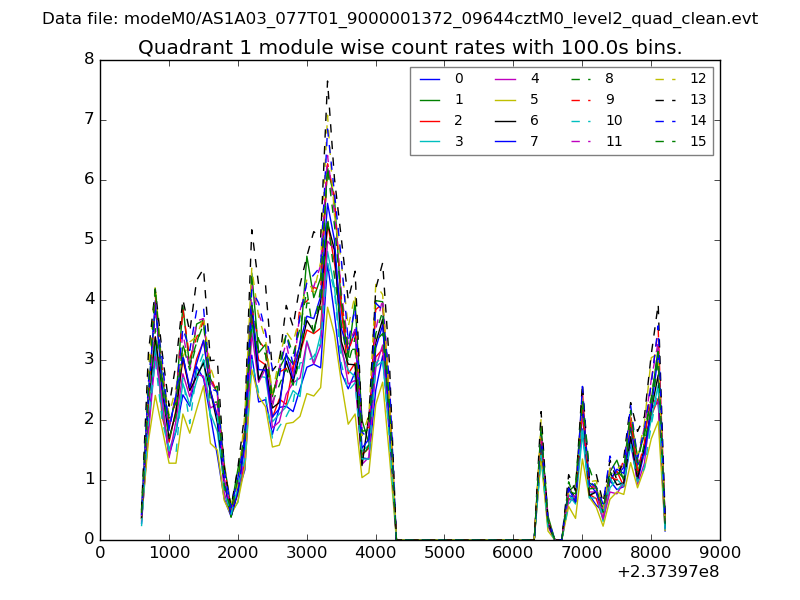
| Module-wise count rates for Quadrant A Data is divided into 100 sec bins |
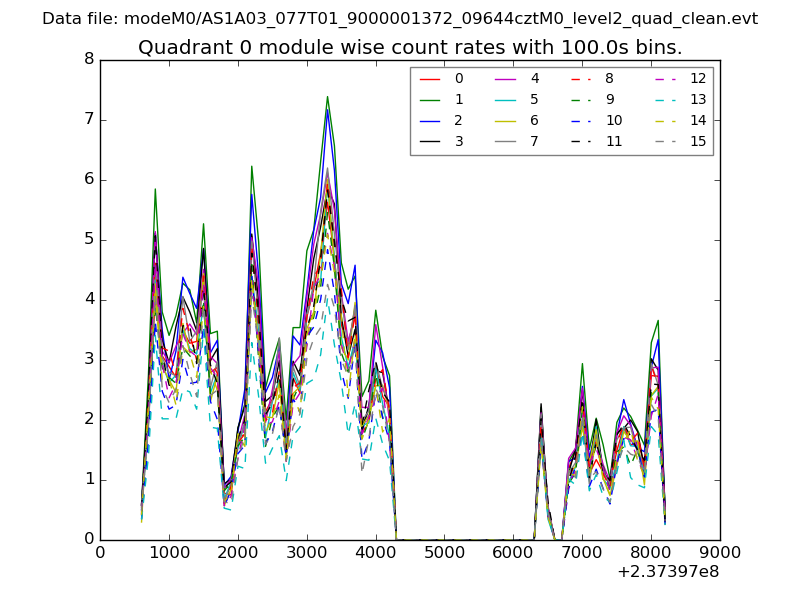 |
 |
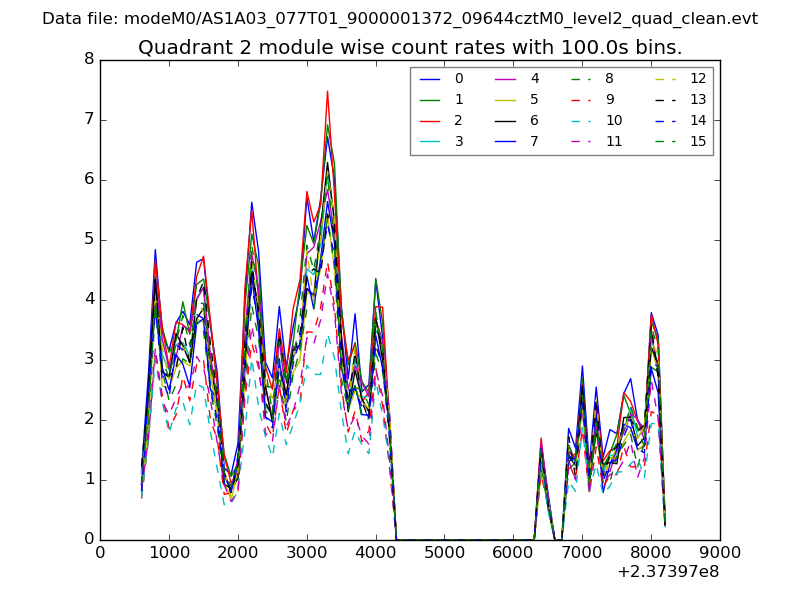
| Module-wise count rates for Quadrant B Data is divided into 100 sec bins |
 |
 |
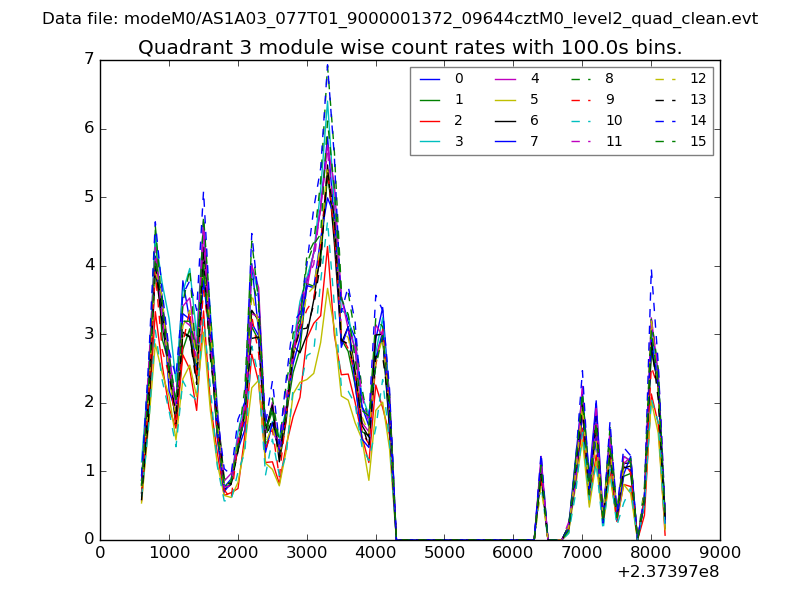
| Module-wise count rates for Quadrant C Data is divided into 100 sec bins |
 |
 |
| Module-wise count rates for Quadrant D Data is divided into 100 sec bins |
 |
 |
| Parameter | Plot |
|---|---|
| CZT HV Monitor | 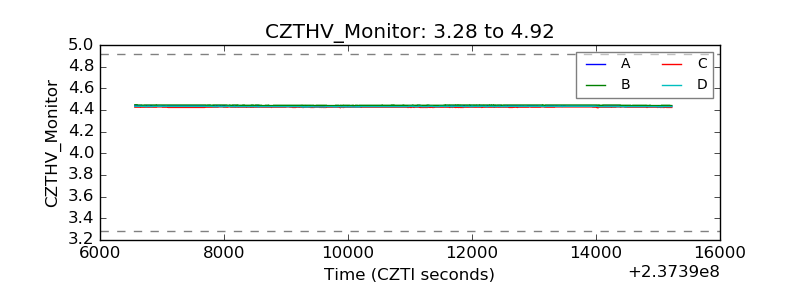 |
| D_VDD | 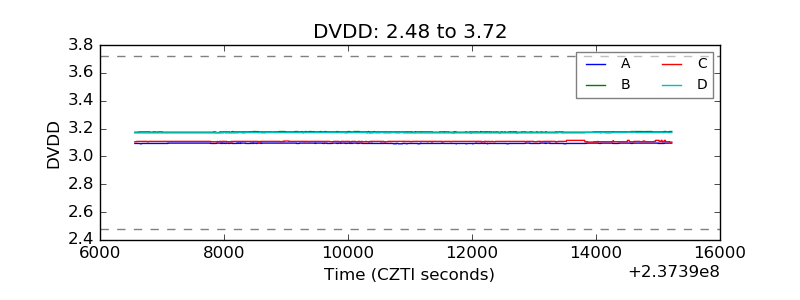 |
| Temperature 1 | 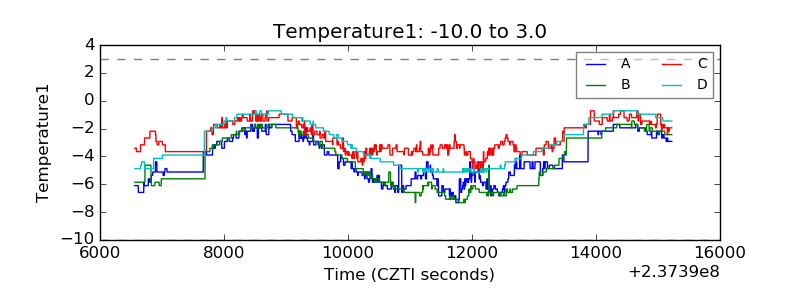 |
| Veto HV Monitor | 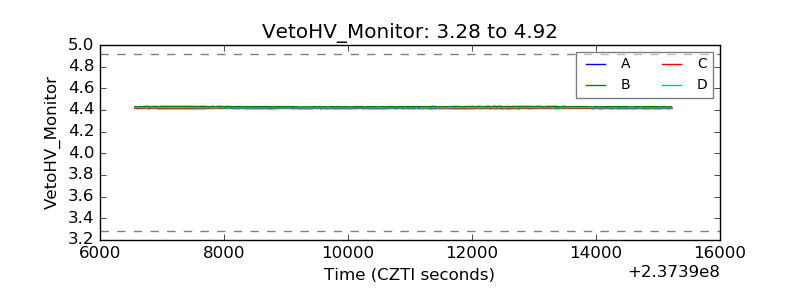 |
| Veto LLD | 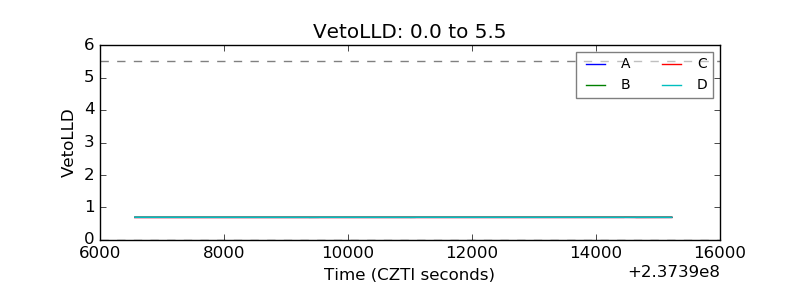 |
| Alpha Counter |  |
| _CPM_Rate | 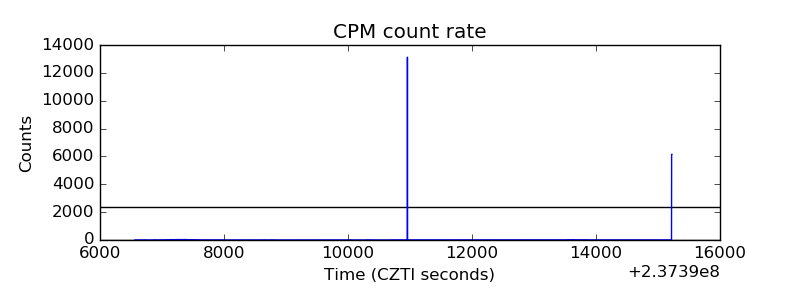 |
| CZT Counter | 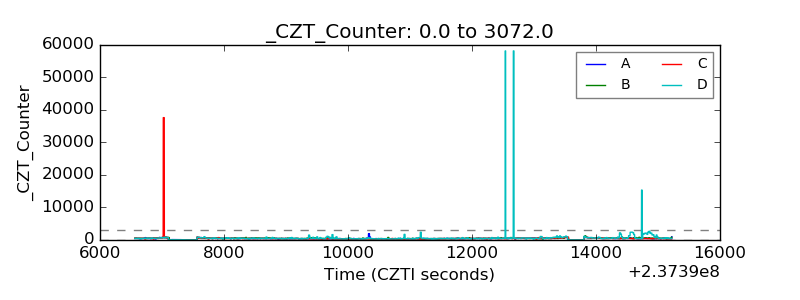 |
| +2.5 Volts monitor | 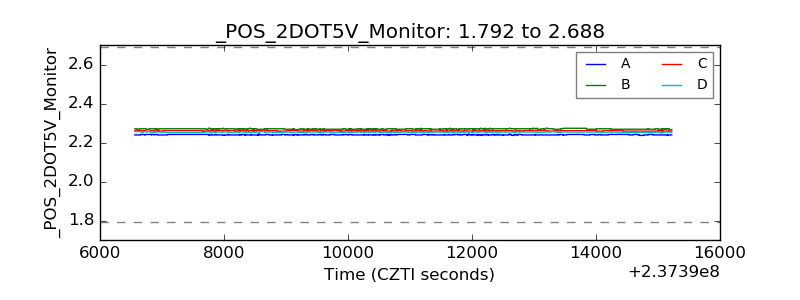 |
| +5 Volts monitor |  |
| _ROLL_ROT | 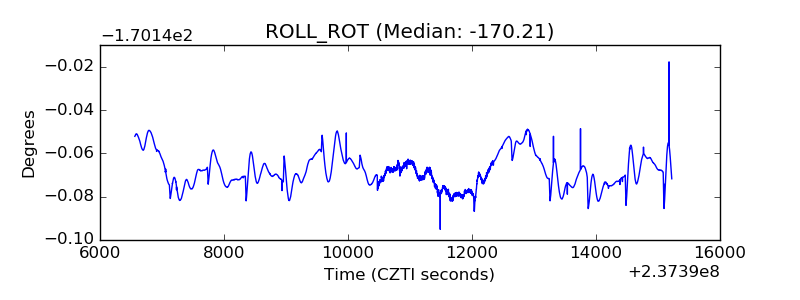 |
| _Roll_DEC | 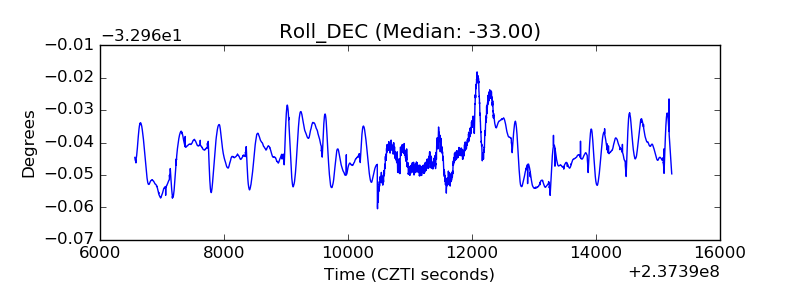 |
| _Roll_RA | 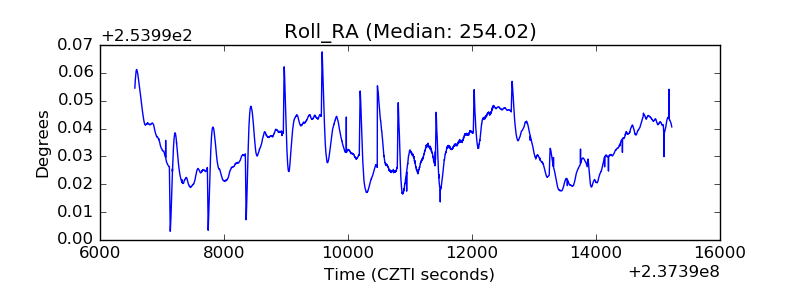 |
| Veto Counter | 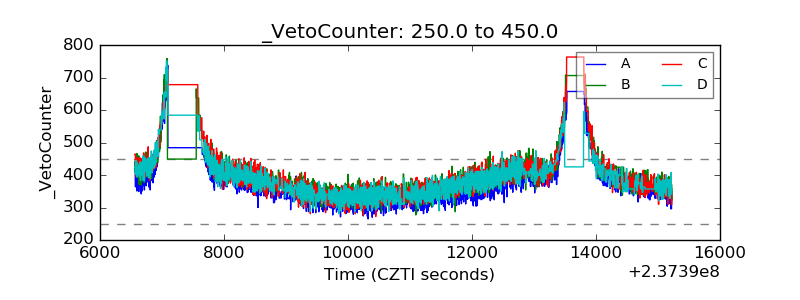 |