| Param | Original file | Final file |
|---|---|---|
| Filename | modeM0/AS1A03_077T01_9000001372_09648cztM0_level2.evt | modeM0/AS1A03_077T01_9000001372_09648cztM0_level2_quad_clean.evt |
| Size (bytes) | 1,128,908,160 | 209,862,720 |
| Size | 1.1 GB | 200.1 MB |
| Events in quadrant A | 7,851,537 | 1,318,583 |
| Events in quadrant B | 8,066,110 | 1,332,534 |
| Events in quadrant C | 7,485,302 | 1,308,559 |
| Events in quadrant D | 9,633,342 | 1,223,632 |
| Mode M9 | |||
|---|---|---|---|
| Quadrant | BADHDUFLAG | Total packets | Discarded packets |
| A | 0 | 19 | 2 |
| B | 0 | 19 | 1 |
| C | 0 | 19 | 1 |
| D | 0 | 19 | 2 |
| Mode SS | |||
|---|---|---|---|
| Quadrant | BADHDUFLAG | Total packets | Discarded packets |
| A | 0 | 376 | 18 |
| B | 0 | 376 | 48 |
| C | 0 | 376 | 32 |
| D | 0 | 376 | 28 |
| Mode M0 | |||
|---|---|---|---|
| Quadrant | BADHDUFLAG | Total packets | Discarded packets |
| A | 0 | 37881 | 2697 |
| B | 0 | 38353 | 2862 |
| C | 0 | 37208 | 2778 |
| D | 0 | 45311 | 5088 |
| Quadrant | Total seconds | Saturated seconds | Saturation percentage |
|---|---|---|---|
| A | 17076 | 102 | 0.597330% |
| B | 17065 | 86 | 0.503955% |
| C | 17021 | 28 | 0.164503% |
| D | 16807 | 394 | 2.344261% |
Noise dominated data is calculated using 1-second bins in cleaned event files. If a bin has >2000 counts, and if more than 50% of those come from <1% of pixels, then it is considered to be noise-dominated and hence unusable.
| Quadrant | # 1 sec bins | Bins with >0 counts | Bins with >2000 counts | High rate bins dominated by noise | Noise dominated (total time) | Noise dominated (detector-on time) | Marked lightcurve |
|---|---|---|---|---|---|---|---|
| A | 20401 | 18145 | 30 | 30 | 0.15% | 0.17% |  |
| B | 20401 | 18142 | 12 | 12 | 0.06% | 0.07% |  |
| C | 20401 | 18143 | 1 | 1 | 0.00% | 0.01% | 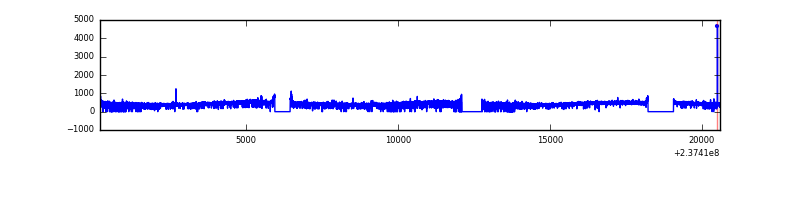 |
| D | 20399 | 17978 | 290 | 290 | 1.42% | 1.61% | 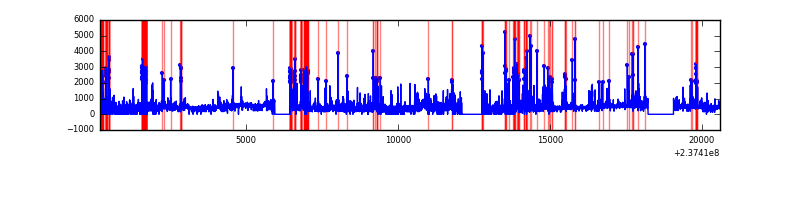 |
Top three noisy pixels from each quadrant. If the there are fewer than three noisy pixels in the level2.evt file, extra rows are filled as -1
| Pixel properties | Quadrant properties | ||||||
|---|---|---|---|---|---|---|---|
| Quadrant | DetID | PixID | Counts | Sigma | Mean | Median | Sigma |
| A | 15 | 174 | 170091 | 416.95 | 1975 | 1933 | 403.3 |
| A | 14 | 111 | 50602 | 120.67 | 1975 | 1933 | 403.3 |
| A | 13 | 248 | 19395 | 43.3 | 1975 | 1933 | 403.3 |
| B | 0 | 214 | 168112 | 438.36 | 1987 | 1938 | 379.1 |
| B | 0 | 219 | 52077 | 132.26 | 1987 | 1938 | 379.1 |
| B | 12 | 111 | 42136 | 106.04 | 1987 | 1938 | 379.1 |
| C | 13 | 61 | 14520 | 28.45 | 1909 | 1912 | 443.2 |
| C | 14 | 234 | 10600 | 19.6 | 1909 | 1912 | 443.2 |
| C | 8 | 128 | 9528 | 17.18 | 1909 | 1912 | 443.2 |
| D | 1 | 52 | 1060964 | 2333.23 | 1854 | 1810 | 453.9 |
| D | 7 | 71 | 697056 | 1531.57 | 1854 | 1810 | 453.9 |
| D | 8 | 195 | 399788 | 876.71 | 1854 | 1810 | 453.9 |
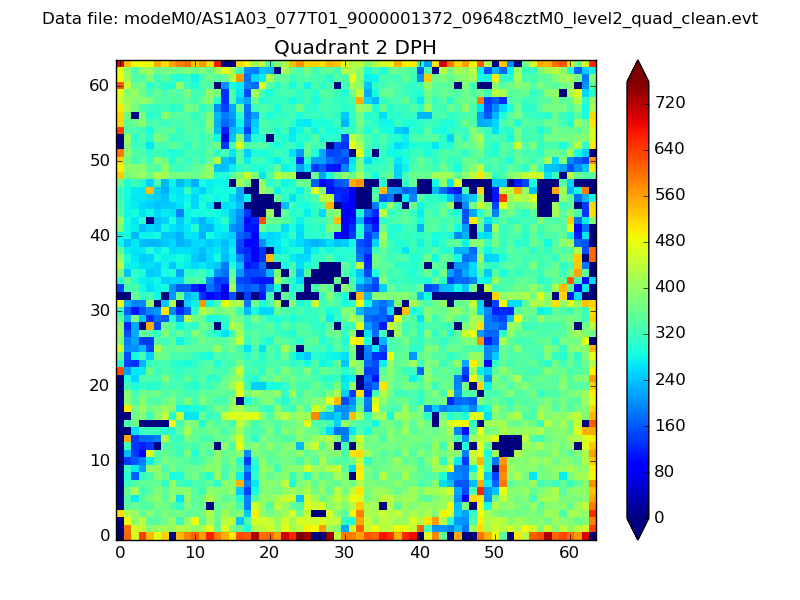
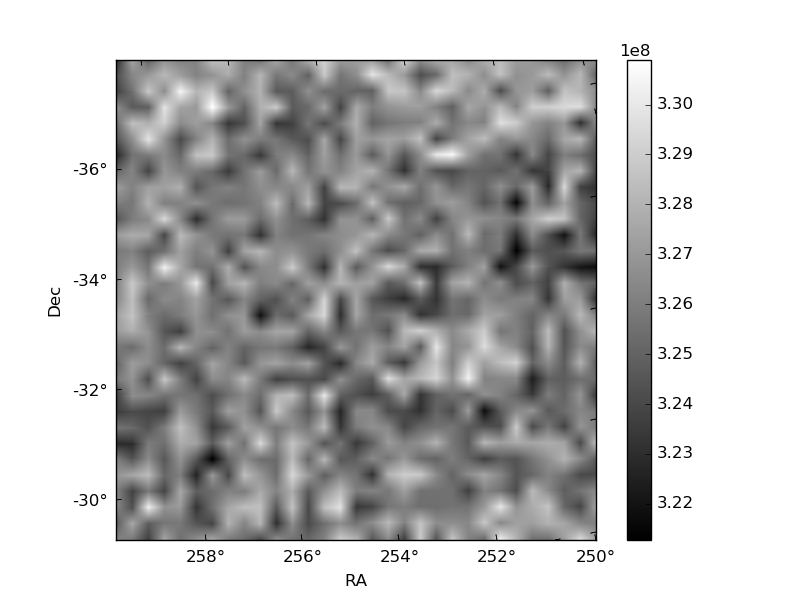
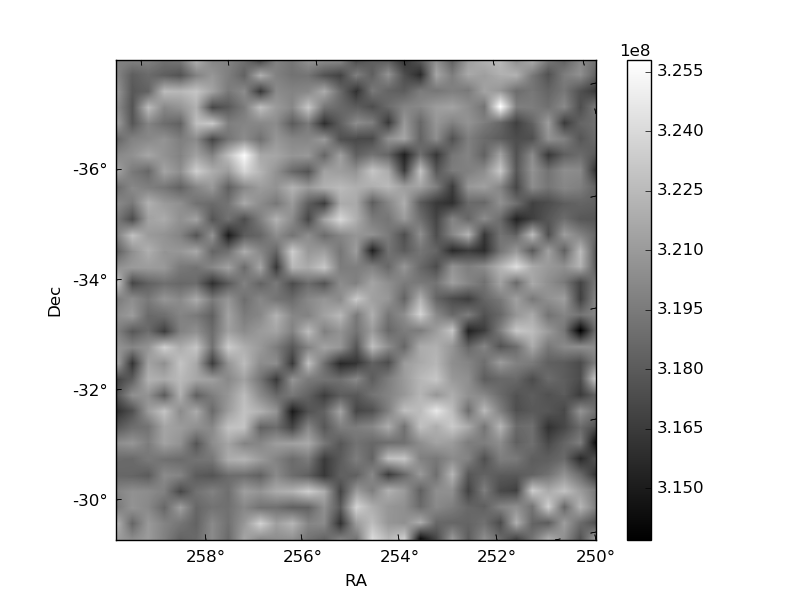
Histogram calculated using DETX and DETY for each event in the final _common_clean file
| Quadrant A | 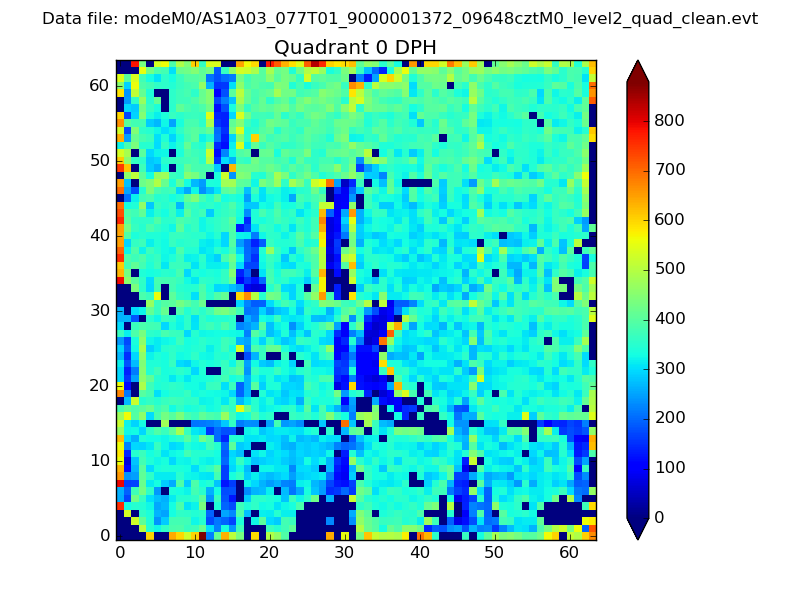 |
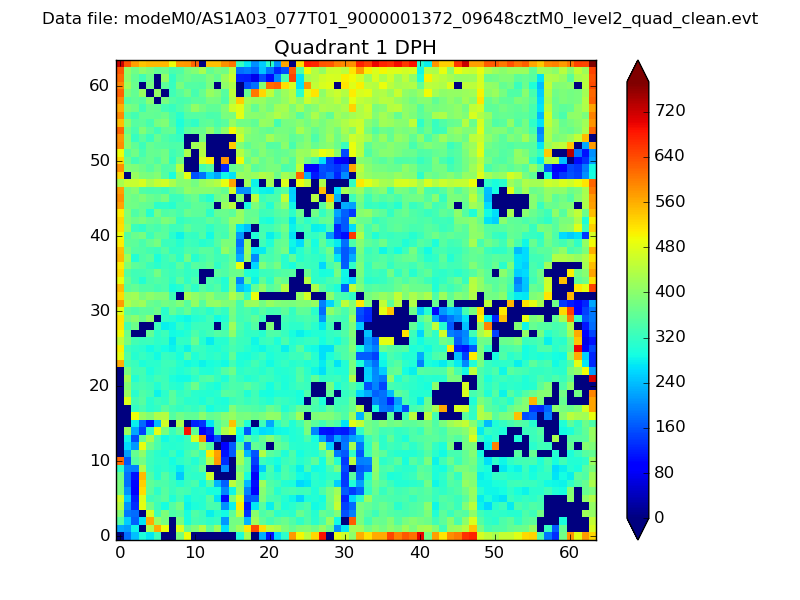 |
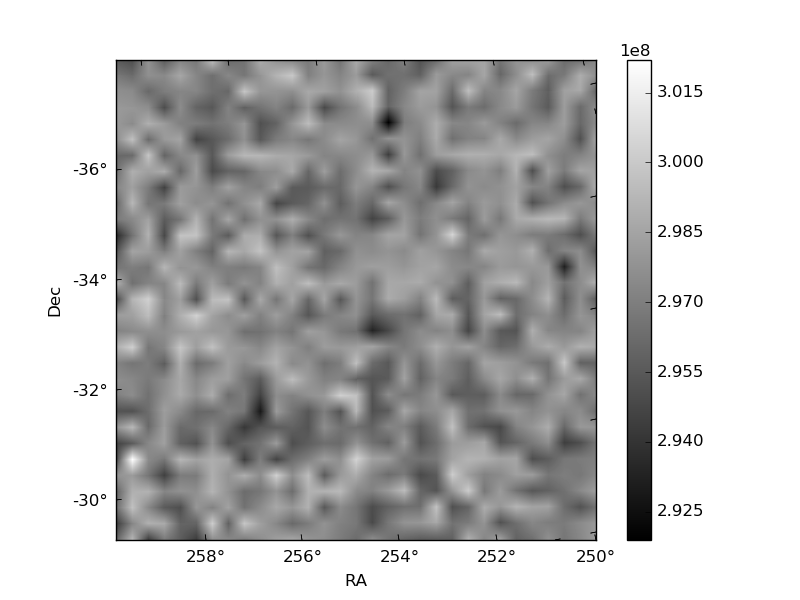
Quadrant B |
|---|---|---|---|
| Quadrant D |  |
 |
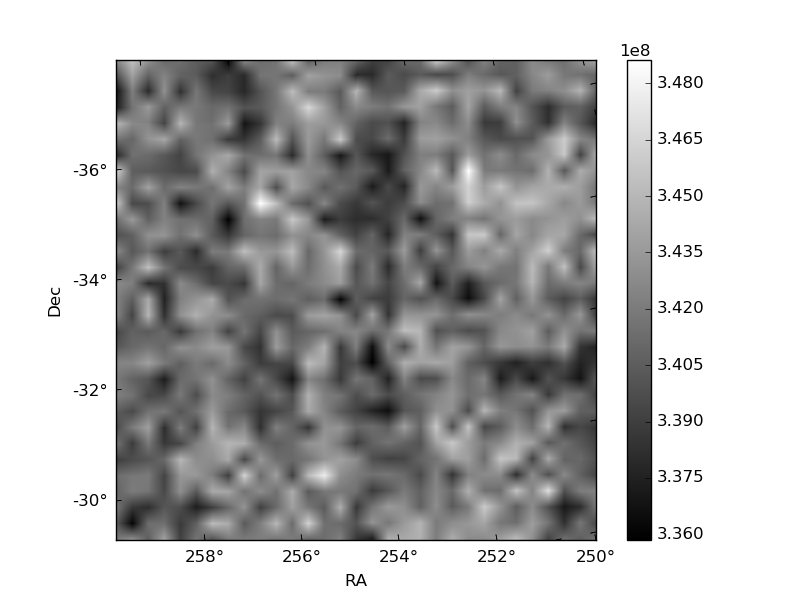
Quadrant C |
| Plot type | Count rate plots | Images |
|---|---|---|
| Comparison with Poisson distribution Blue bars denote a histogram of data divided into 1 sec bins. Red curve is a Poisson curve with rate = median count rate of data. |
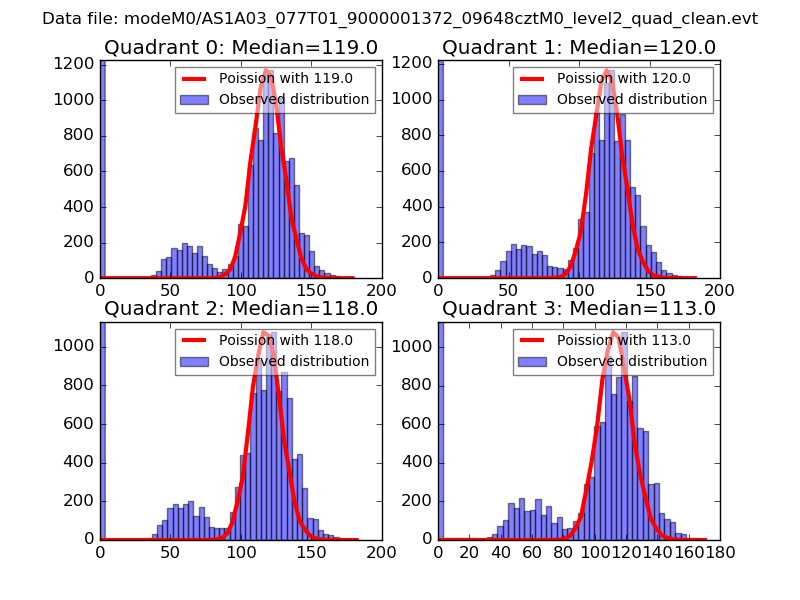 |
 |
| Quadrant-wise count rates Data is divided into 100 sec bins |
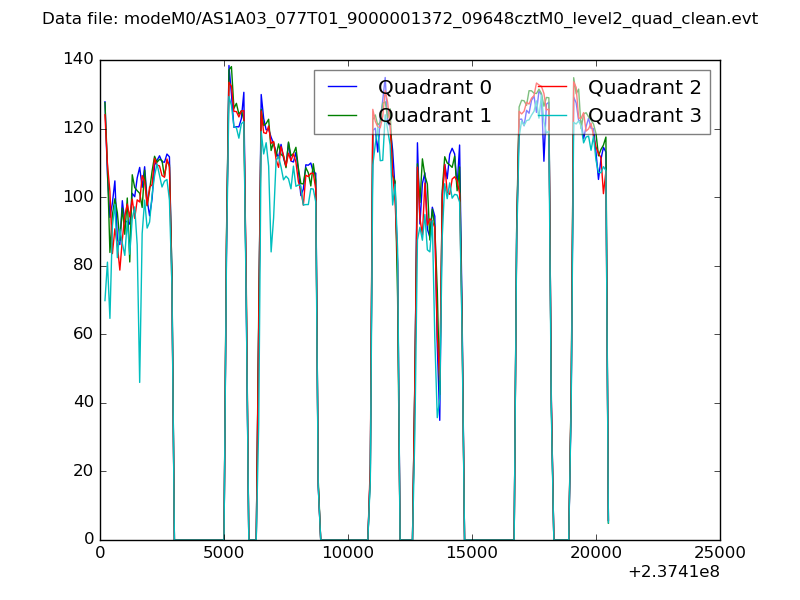 |
|
| Module-wise count rates for Quadrant A Data is divided into 100 sec bins |
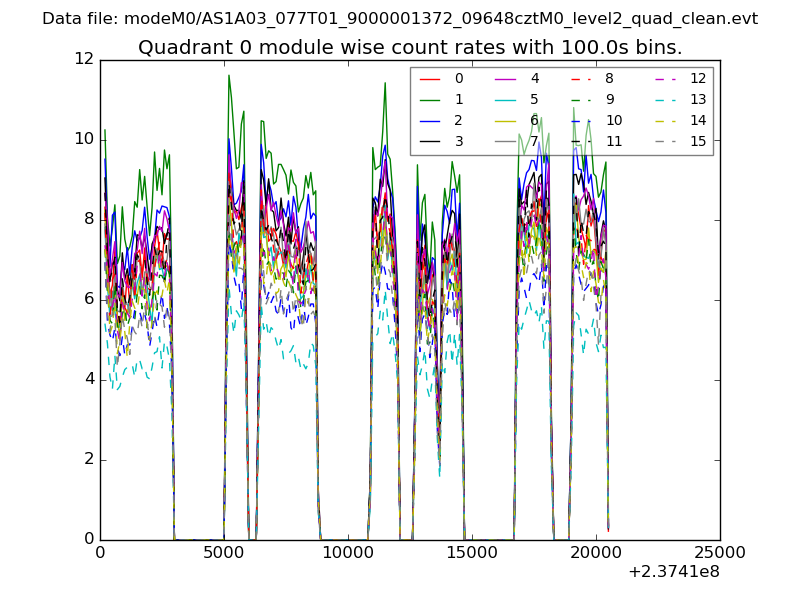 |
 |
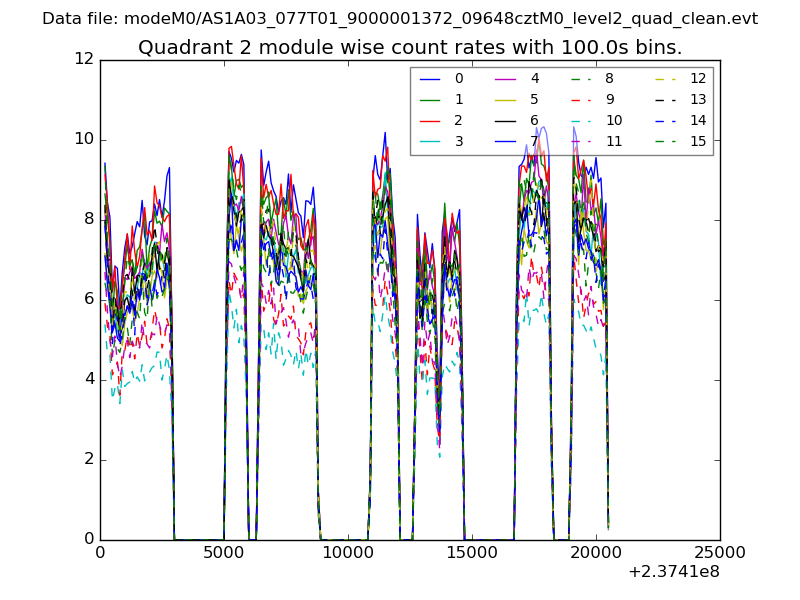
| Module-wise count rates for Quadrant B Data is divided into 100 sec bins |
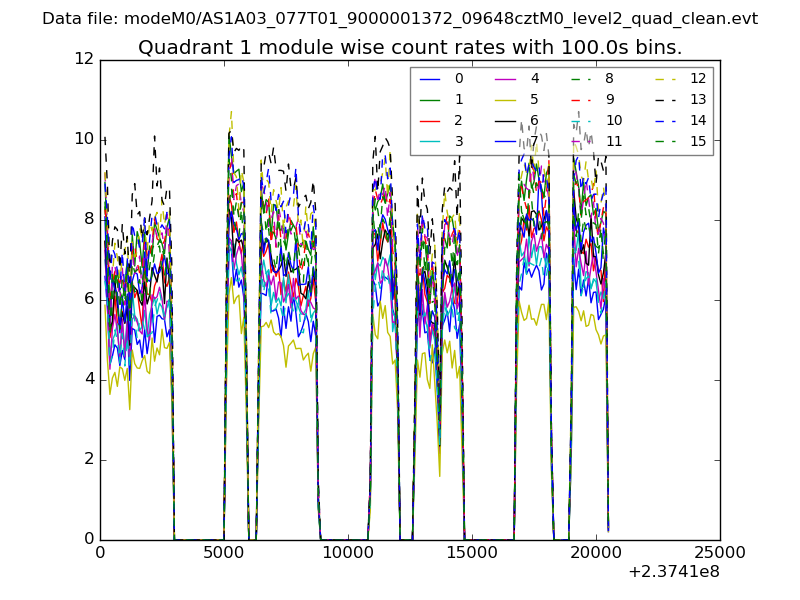 |
 |
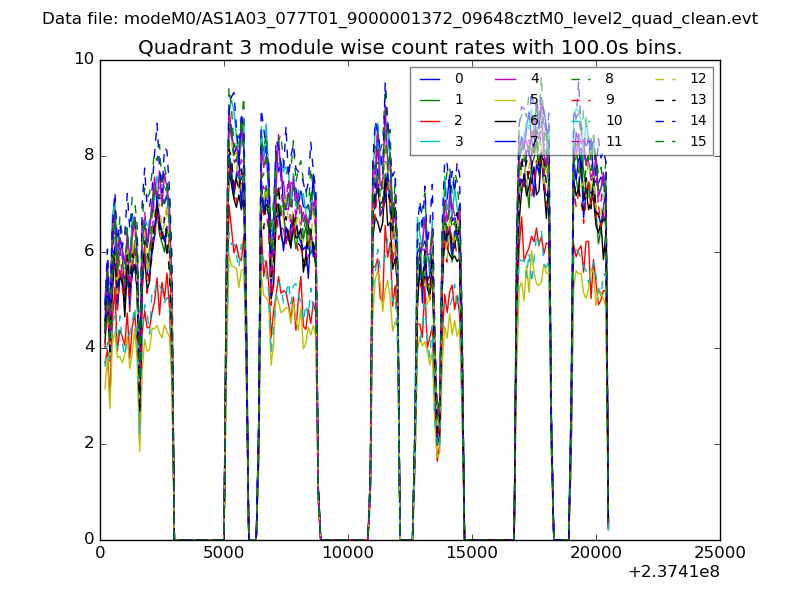
| Module-wise count rates for Quadrant C Data is divided into 100 sec bins |
 |
 |
| Module-wise count rates for Quadrant D Data is divided into 100 sec bins |
 |
 |
| Parameter | Plot |
|---|---|
| CZT HV Monitor | 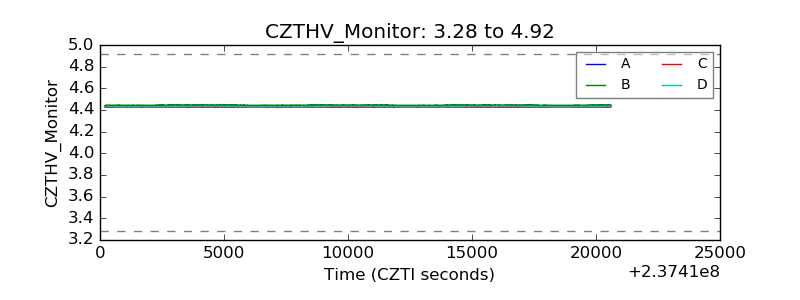 |
| D_VDD | 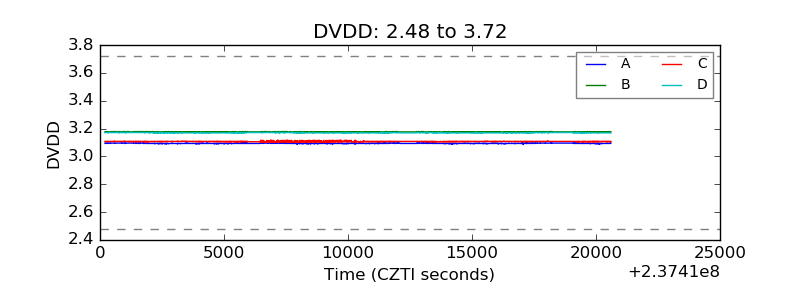 |
| Temperature 1 | 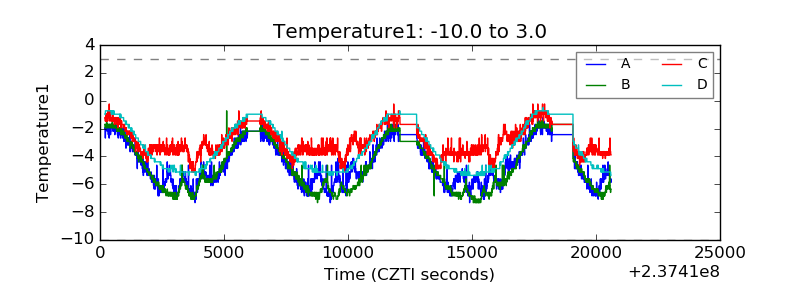 |
| Veto HV Monitor | 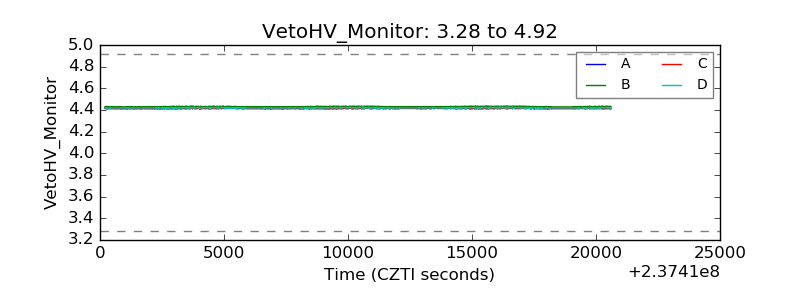 |
| Veto LLD | 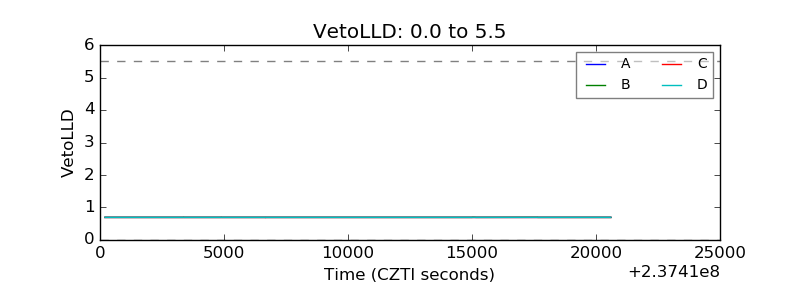 |
| Alpha Counter | 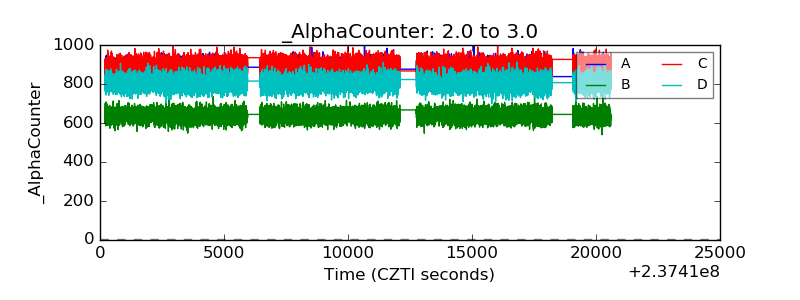 |
| _CPM_Rate | 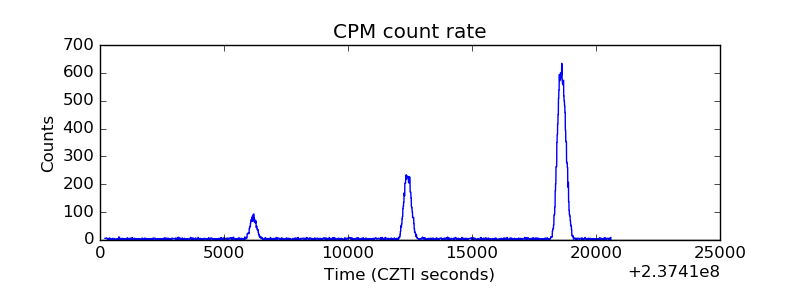 |
| CZT Counter | 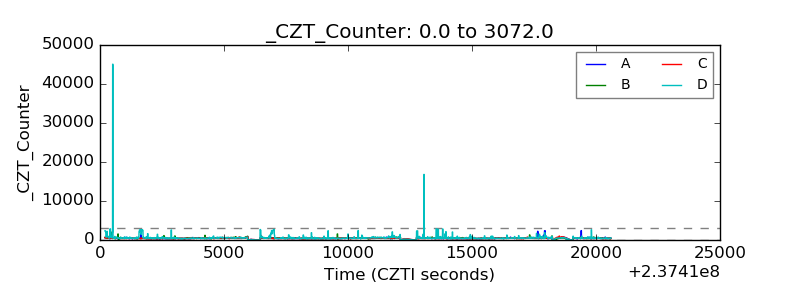 |
| +2.5 Volts monitor | 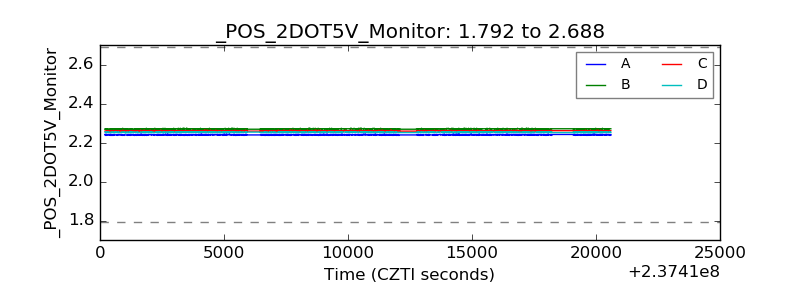 |
| +5 Volts monitor |  |
| _ROLL_ROT | 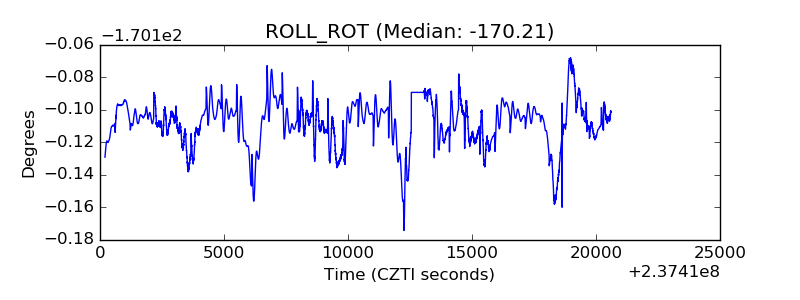 |
| _Roll_DEC | 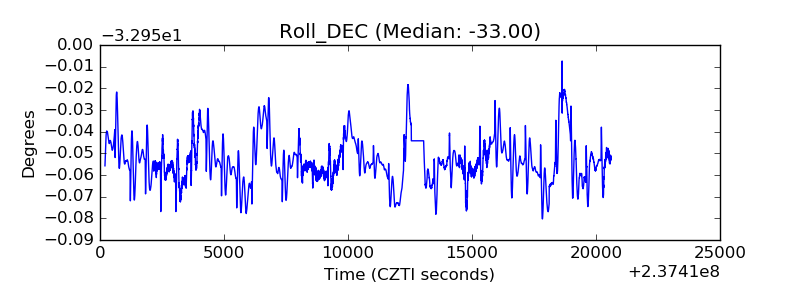 |
| _Roll_RA | 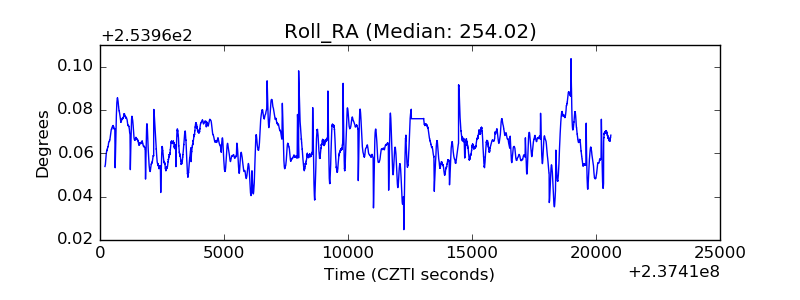 |
| Veto Counter | 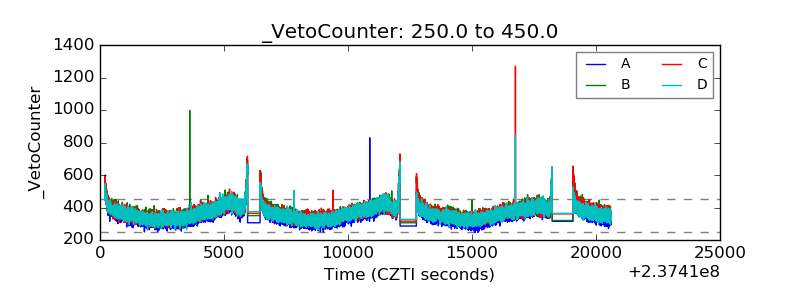 |