| Param | Original file | Final file |
|---|---|---|
| Filename | modeM0/AS1A03_077T01_9000001372_09649cztM0_level2.evt | modeM0/AS1A03_077T01_9000001372_09649cztM0_level2_quad_clean.evt |
| Size (bytes) | 1,189,036,800 | 225,950,400 |
| Size | 1.1 GB | 215.5 MB |
| Events in quadrant A | 8,440,795 | 1,411,308 |
| Events in quadrant B | 8,701,318 | 1,408,484 |
| Events in quadrant C | 8,127,294 | 1,405,123 |
| Events in quadrant D | 9,503,639 | 1,361,910 |
| Mode M9 | |||
|---|---|---|---|
| Quadrant | BADHDUFLAG | Total packets | Discarded packets |
| A | 0 | 28 | 3 |
| B | 0 | 28 | 3 |
| C | 0 | 28 | 3 |
| D | 0 | 28 | 1 |
| Mode SS | |||
|---|---|---|---|
| Quadrant | BADHDUFLAG | Total packets | Discarded packets |
| A | 0 | 499 | 122 |
| B | 0 | 495 | 114 |
| C | 0 | 499 | 119 |
| D | 0 | 499 | 111 |
| Mode M0 | |||
|---|---|---|---|
| Quadrant | BADHDUFLAG | Total packets | Discarded packets |
| A | 0 | 50678 | 13061 |
| B | 0 | 51763 | 13861 |
| C | 0 | 50216 | 12975 |
| D | 0 | 60806 | 20423 |
| Quadrant | Total seconds | Saturated seconds | Saturation percentage |
|---|---|---|---|
| A | 18371 | 79 | 0.430026% |
| B | 18219 | 106 | 0.581810% |
| C | 18343 | 33 | 0.179905% |
| D | 17623 | 282 | 1.600182% |
Noise dominated data is calculated using 1-second bins in cleaned event files. If a bin has >2000 counts, and if more than 50% of those come from <1% of pixels, then it is considered to be noise-dominated and hence unusable.
| Quadrant | # 1 sec bins | Bins with >0 counts | Bins with >2000 counts | High rate bins dominated by noise | Noise dominated (total time) | Noise dominated (detector-on time) | Marked lightcurve |
|---|---|---|---|---|---|---|---|
| A | 38828 | 21519 | 6 | 6 | 0.02% | 0.03% | 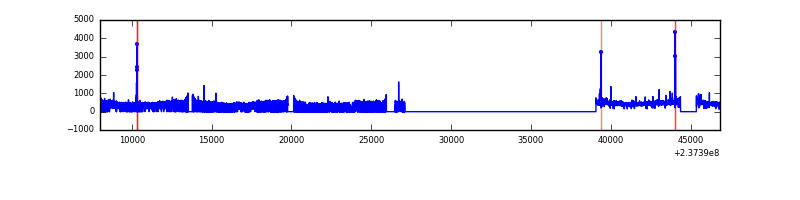 |
| B | 38827 | 21411 | 7 | 7 | 0.02% | 0.03% | 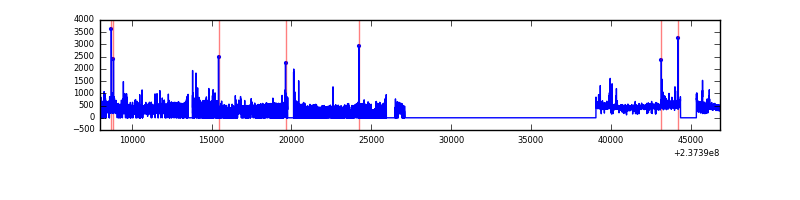 |
| C | 38826 | 21507 | 1 | 1 | 0.00% | 0.00% | 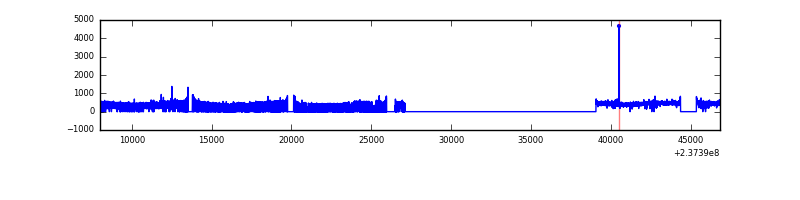 |
| D | 38828 | 20720 | 133 | 133 | 0.34% | 0.64% | 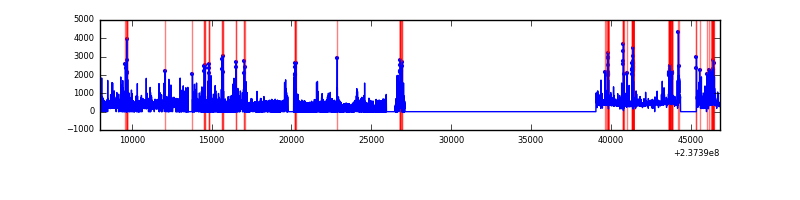 |
Top three noisy pixels from each quadrant. If the there are fewer than three noisy pixels in the level2.evt file, extra rows are filled as -1
| Pixel properties | Quadrant properties | ||||||
|---|---|---|---|---|---|---|---|
| Quadrant | DetID | PixID | Counts | Sigma | Mean | Median | Sigma |
| A | 14 | 111 | 83432 | 185.46 | 2147 | 2101 | 438.5 |
| A | 15 | 174 | 78920 | 175.17 | 2147 | 2101 | 438.5 |
| A | 0 | 226 | 19851 | 40.47 | 2147 | 2101 | 438.5 |
| B | 0 | 214 | 157209 | 381.84 | 2133 | 2083 | 406.3 |
| B | 10 | 245 | 86825 | 208.59 | 2133 | 2083 | 406.3 |
| B | 0 | 229 | 56107 | 132.98 | 2133 | 2083 | 406.3 |
| C | 13 | 61 | 15774 | 28.45 | 2075 | 2086 | 481.2 |
| C | 8 | 128 | 10603 | 17.7 | 2075 | 2086 | 481.2 |
| C | 14 | 234 | 10525 | 17.54 | 2075 | 2086 | 481.2 |
| D | 1 | 52 | 653424 | 1319.33 | 1969 | 1916 | 493.8 |
| D | 7 | 71 | 526807 | 1062.93 | 1969 | 1916 | 493.8 |
| D | 8 | 195 | 300037 | 603.71 | 1969 | 1916 | 493.8 |
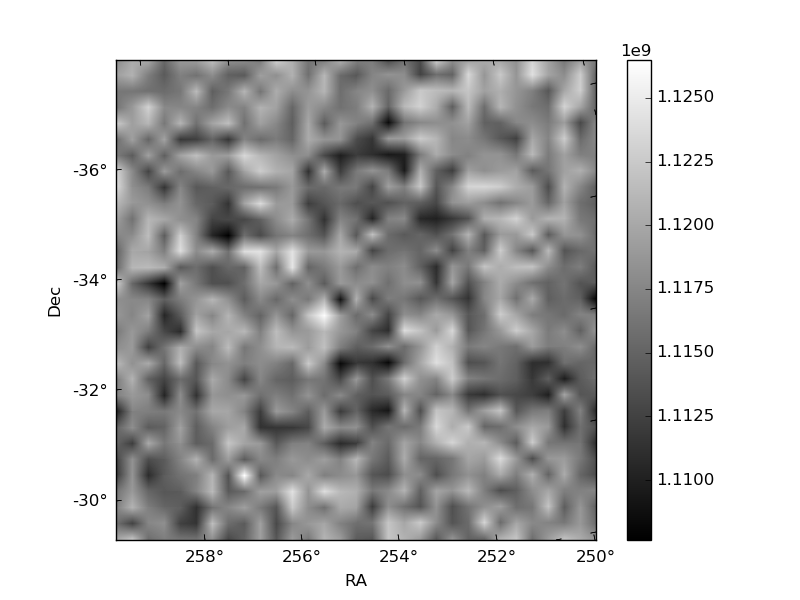
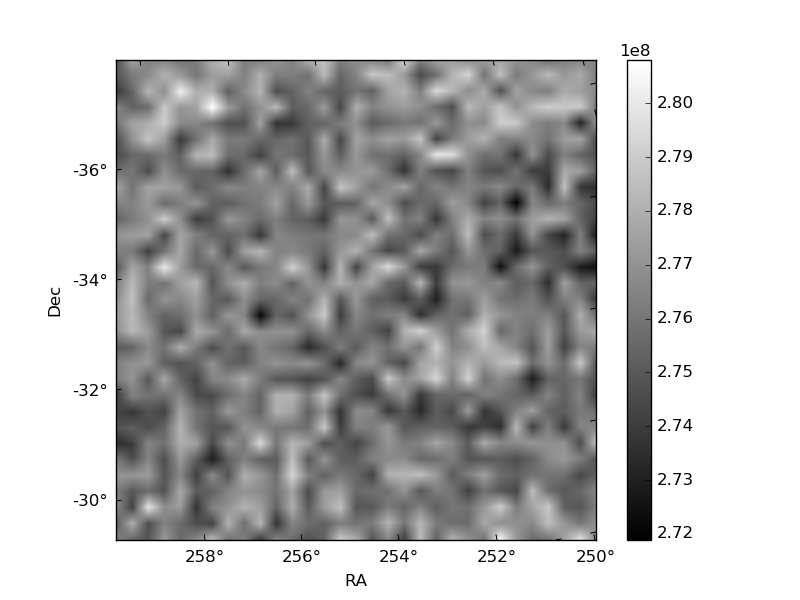
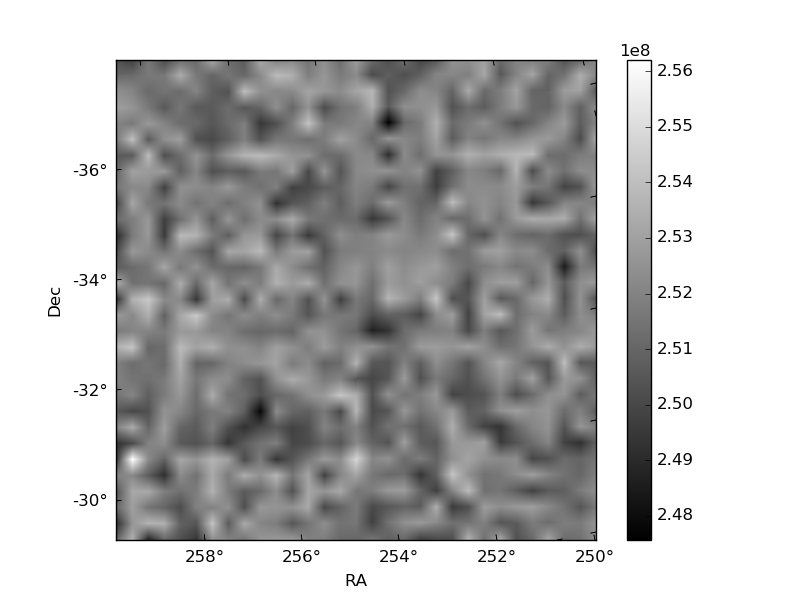
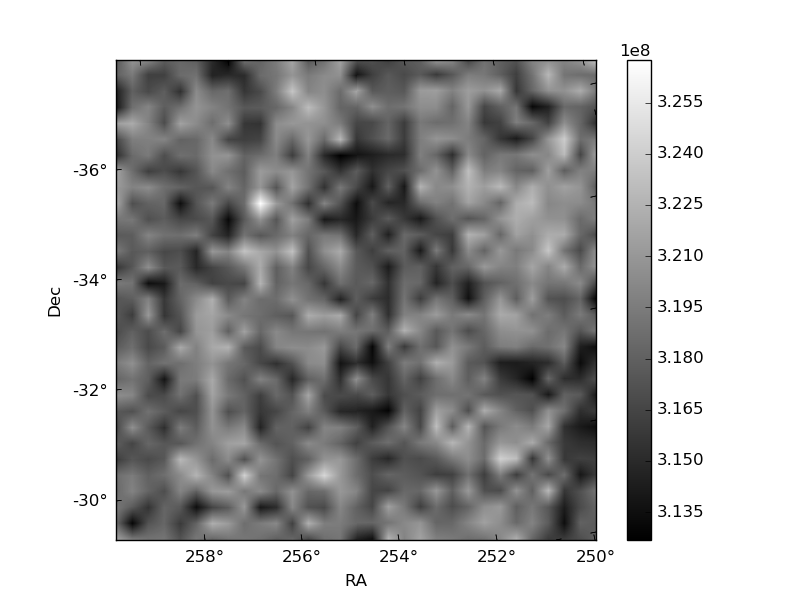
Histogram calculated using DETX and DETY for each event in the final _common_clean file
| Quadrant A | 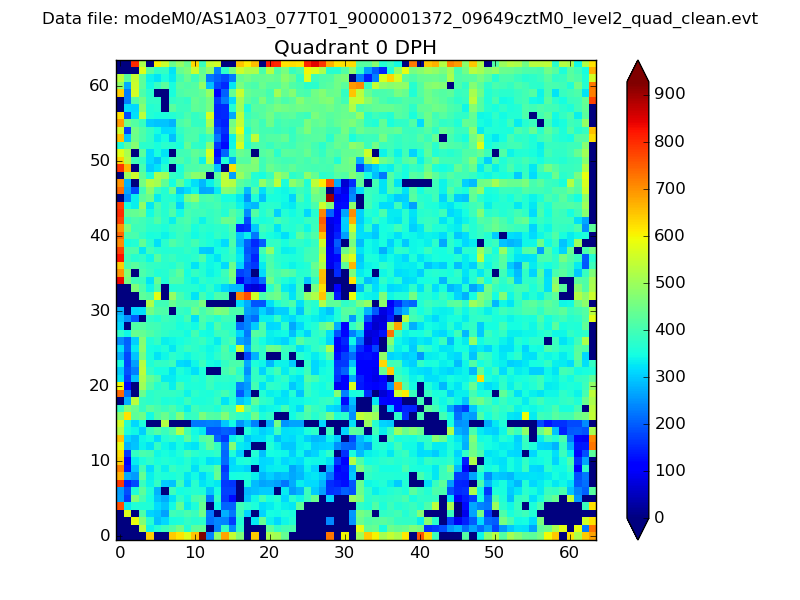 |
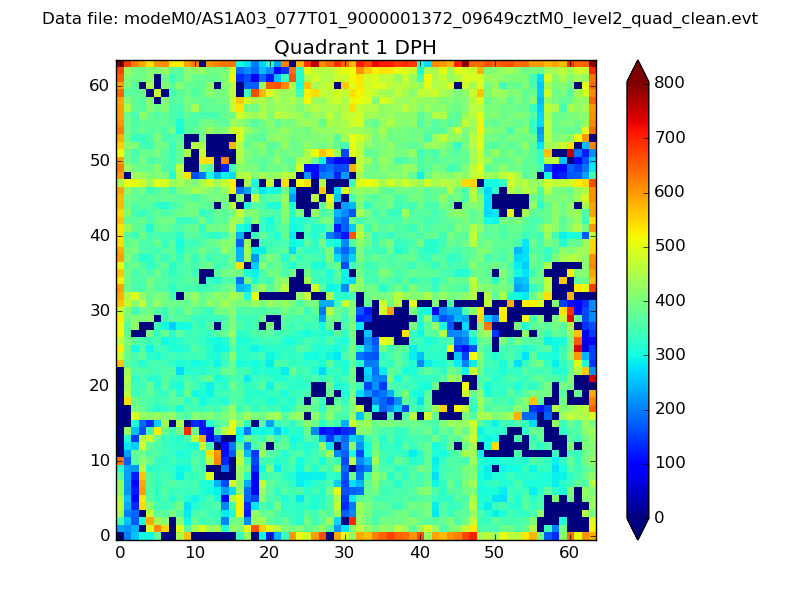 |
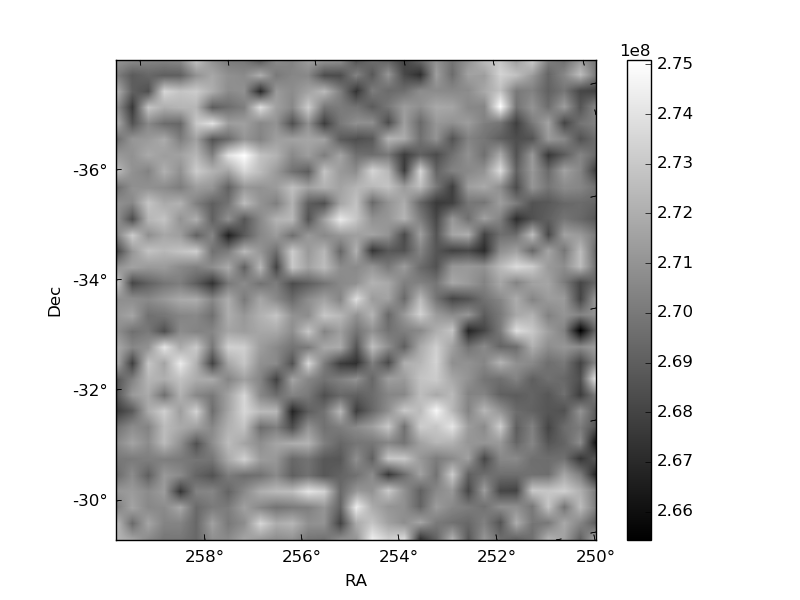
Quadrant B |
|---|---|---|---|
| Quadrant D | 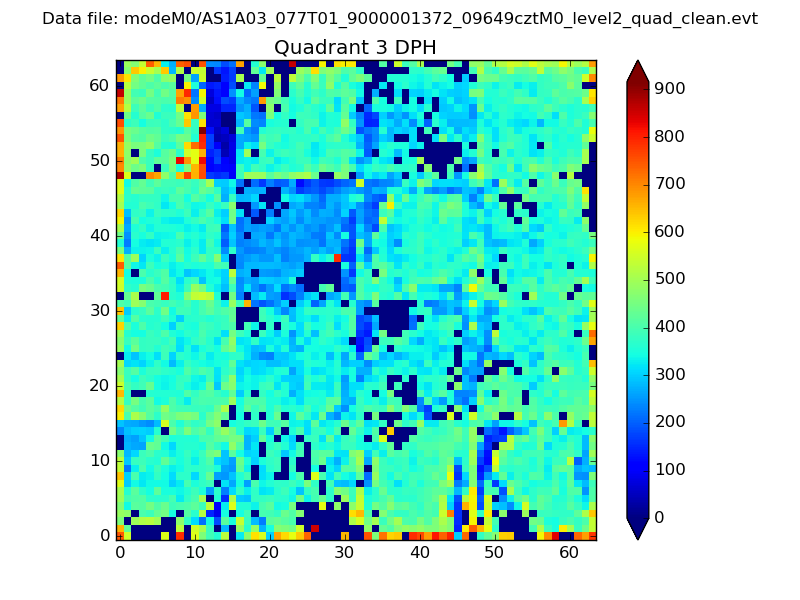 |
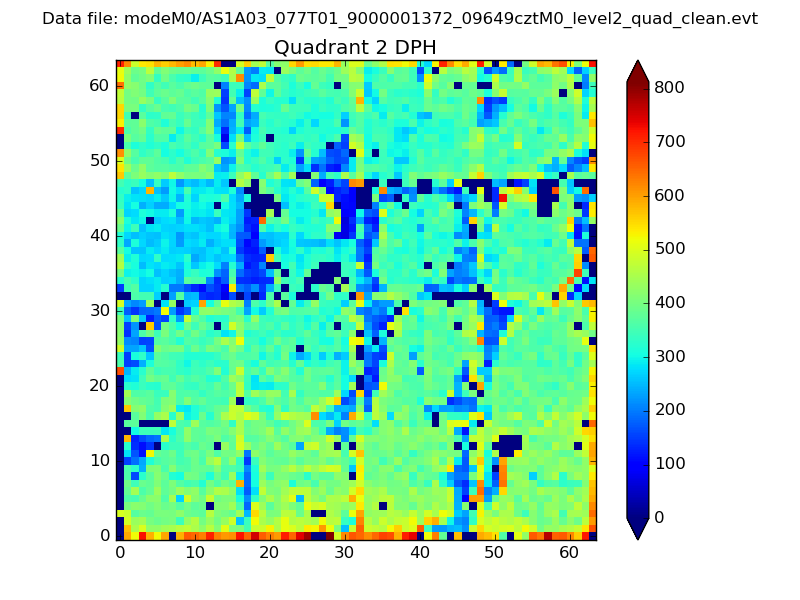 |
Quadrant C |
| Plot type | Count rate plots | Images |
|---|---|---|
| Comparison with Poisson distribution Blue bars denote a histogram of data divided into 1 sec bins. Red curve is a Poisson curve with rate = median count rate of data. |
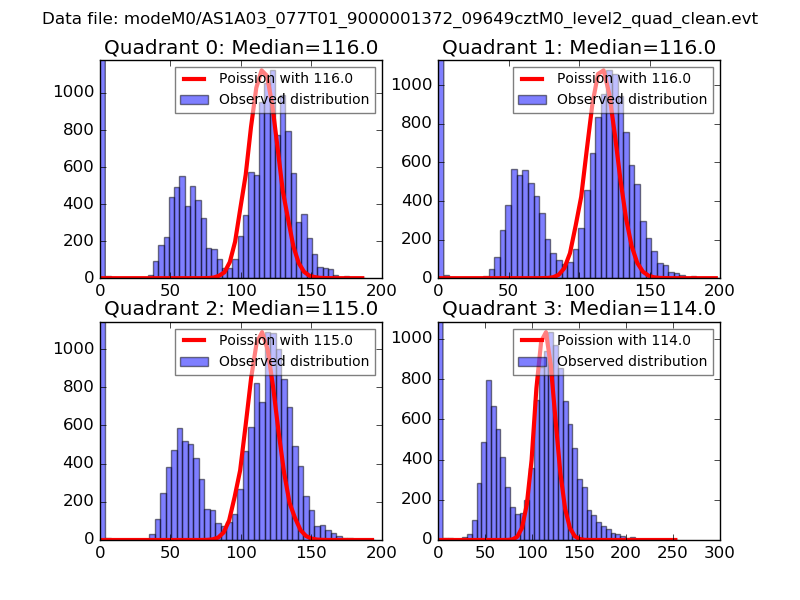 |
 |
| Quadrant-wise count rates Data is divided into 100 sec bins |
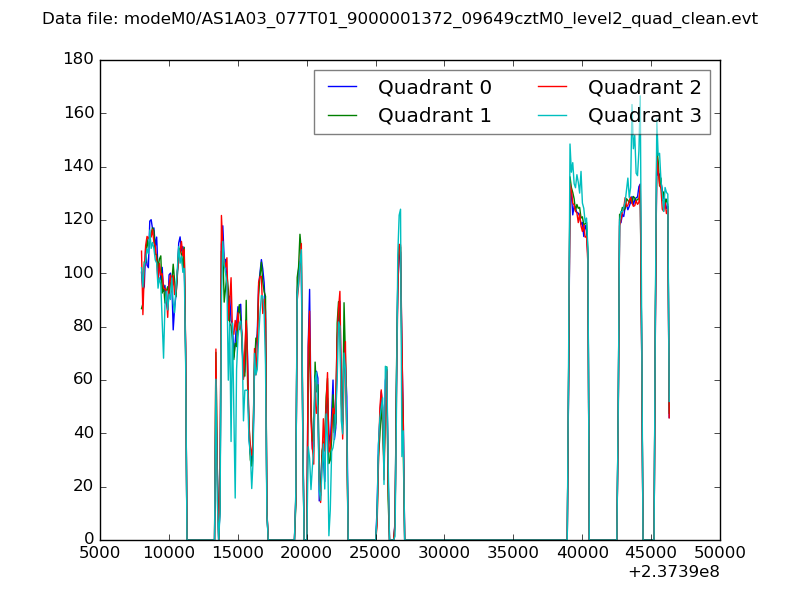 |
|
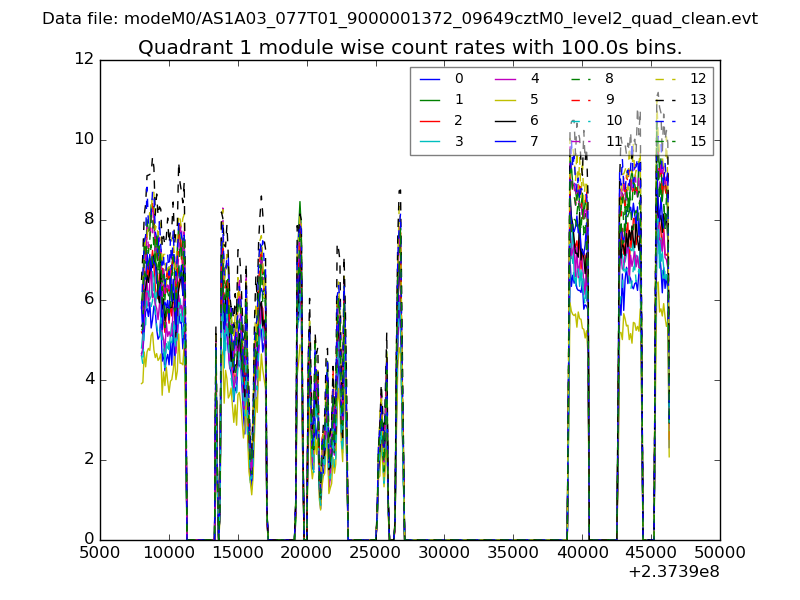
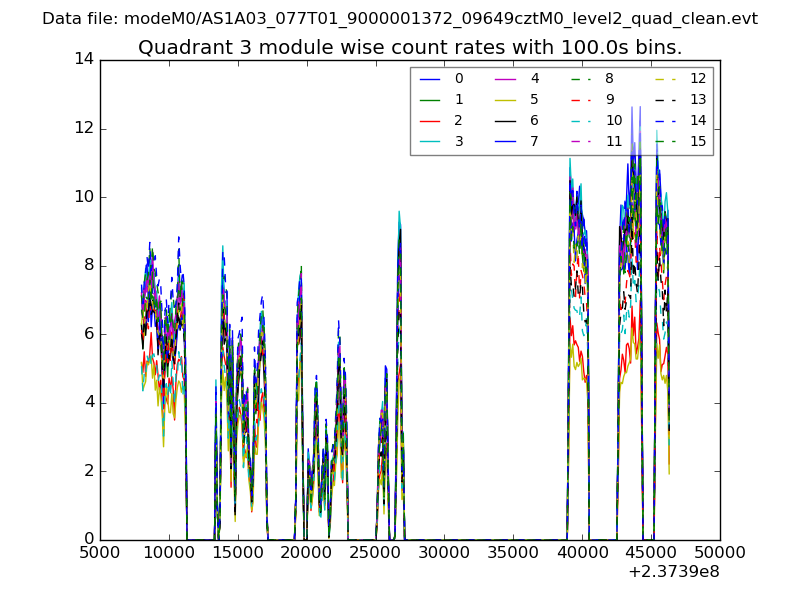
| Module-wise count rates for Quadrant A Data is divided into 100 sec bins |
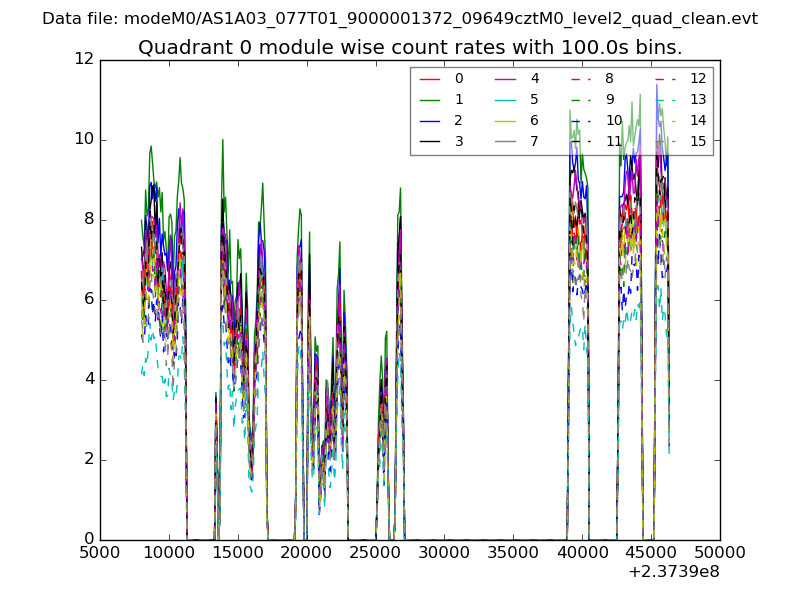 |
 |
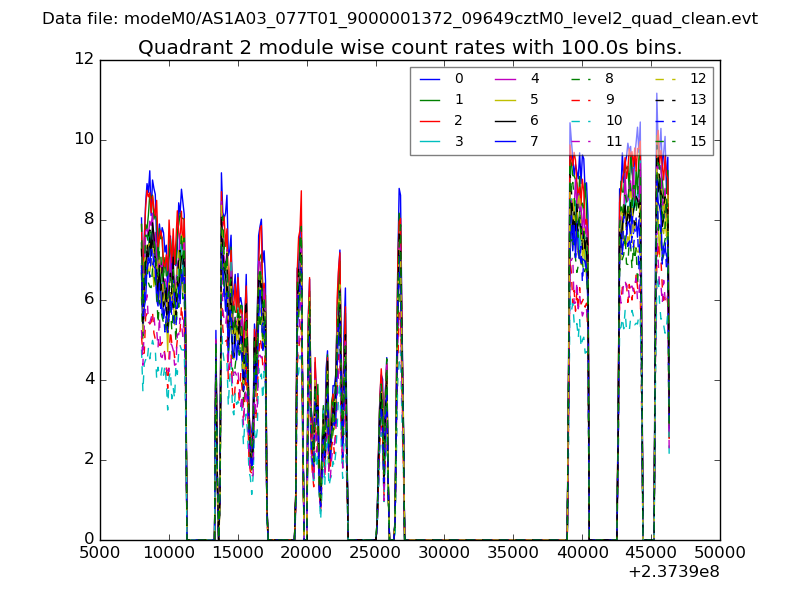
| Module-wise count rates for Quadrant B Data is divided into 100 sec bins |
 |
 |
| Module-wise count rates for Quadrant C Data is divided into 100 sec bins |
 |
 |
| Module-wise count rates for Quadrant D Data is divided into 100 sec bins |
 |
 |
| Parameter | Plot |
|---|---|
| CZT HV Monitor | 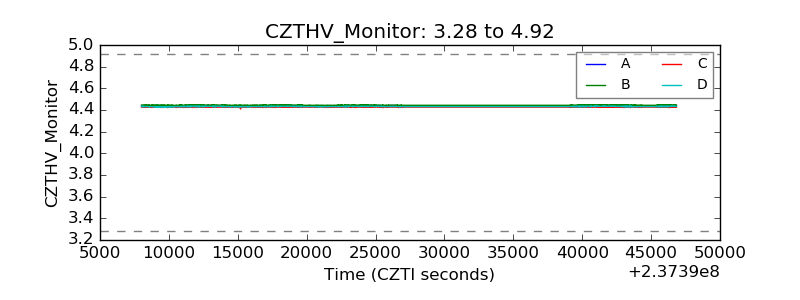 |
| D_VDD | 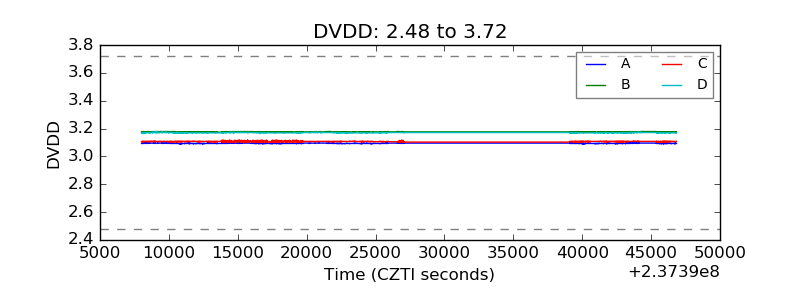 |
| Temperature 1 | 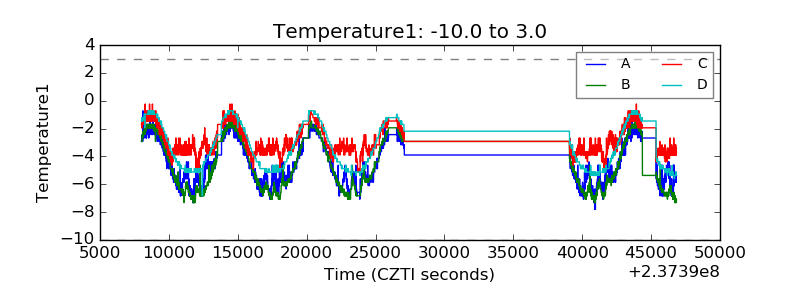 |
| Veto HV Monitor | 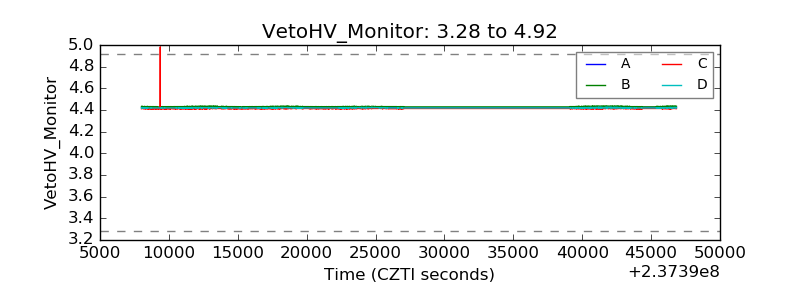 |
| Veto LLD |  |
| Alpha Counter | 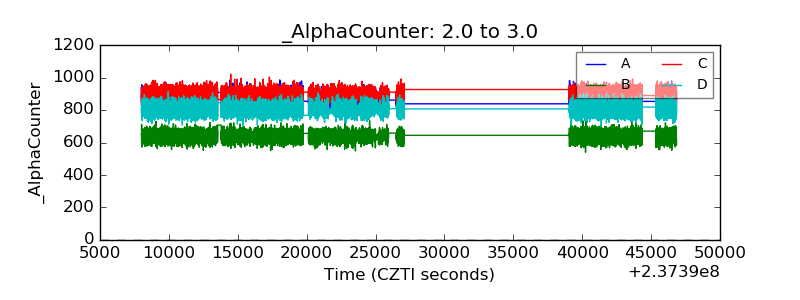 |
| _CPM_Rate | 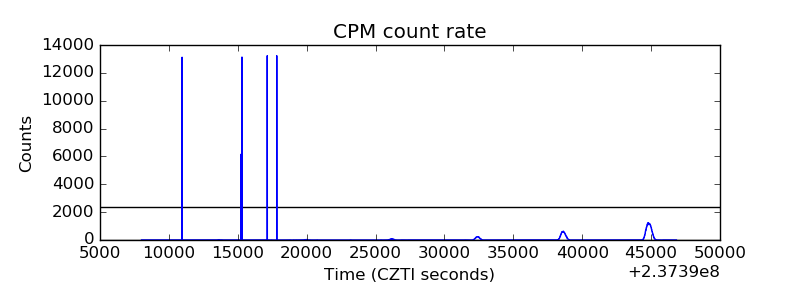 |
| CZT Counter | 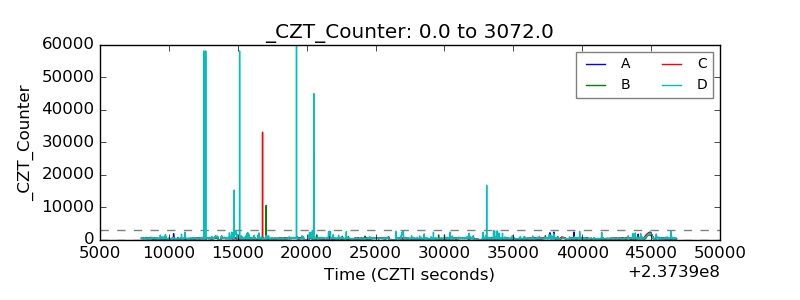 |
| +2.5 Volts monitor | 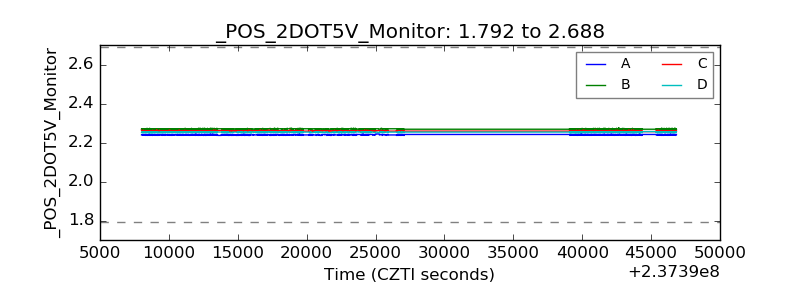 |
| +5 Volts monitor | 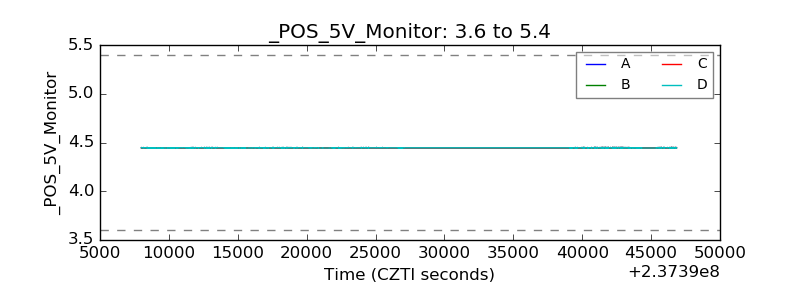 |
| _ROLL_ROT | 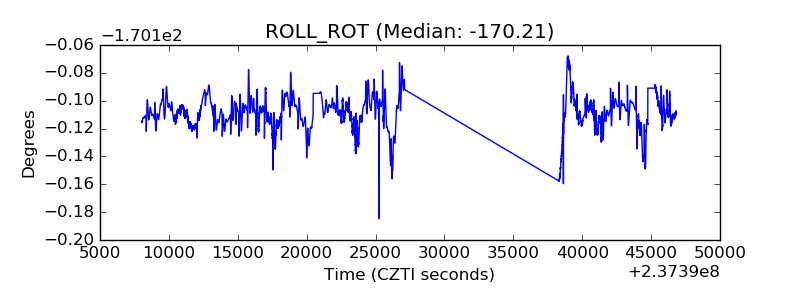 |
| _Roll_DEC | 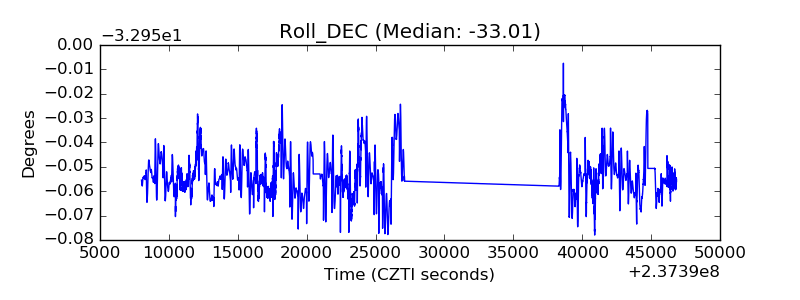 |
| _Roll_RA | 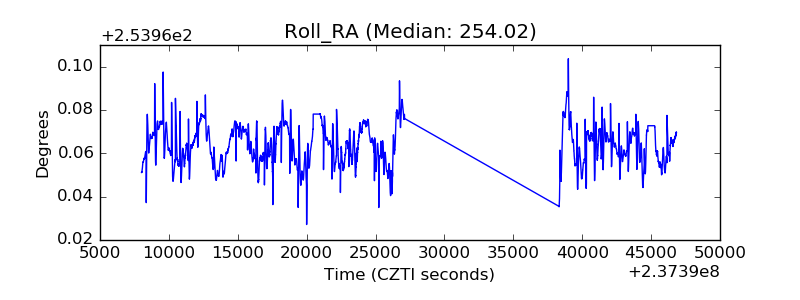 |
| Veto Counter | 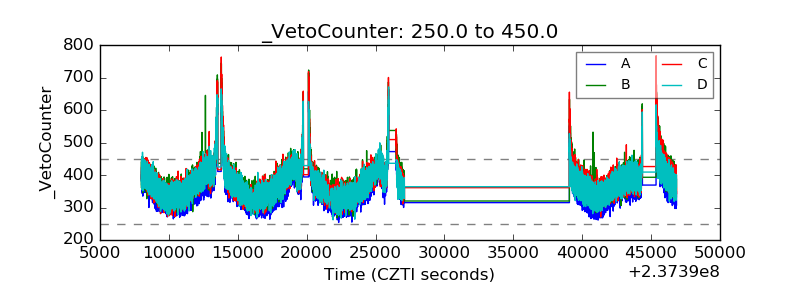 |