| Param | Original file | Final file |
|---|---|---|
| Filename | modeM0/AS1A03_077T01_9000001372_09652cztM0_level2.evt | modeM0/AS1A03_077T01_9000001372_09652cztM0_level2_quad_clean.evt |
| Size (bytes) | 2,831,538,240 | 495,169,920 |
| Size | 2.6 GB | 472.2 MB |
| Events in quadrant A | 19,407,597 | 3,080,080 |
| Events in quadrant B | 20,212,805 | 3,092,843 |
| Events in quadrant C | 18,776,186 | 3,057,994 |
| Events in quadrant D | 24,523,191 | 2,887,846 |
| Mode M9 | |||
|---|---|---|---|
| Quadrant | BADHDUFLAG | Total packets | Discarded packets |
| A | 0 | 60 | 3 |
| B | 0 | 60 | 2 |
| C | 0 | 60 | 3 |
| D | 0 | 60 | 2 |
| Mode SS | |||
|---|---|---|---|
| Quadrant | BADHDUFLAG | Total packets | Discarded packets |
| A | 0 | 918 | 58 |
| B | 0 | 919 | 81 |
| C | 0 | 921 | 67 |
| D | 0 | 920 | 74 |
| Mode M0 | |||
|---|---|---|---|
| Quadrant | BADHDUFLAG | Total packets | Discarded packets |
| A | 0 | 93070 | 6733 |
| B | 0 | 94535 | 6806 |
| C | 0 | 92039 | 6693 |
| D | 0 | 110382 | 8696 |
| Quadrant | Total seconds | Saturated seconds | Saturation percentage |
|---|---|---|---|
| A | 41973 | 232 | 0.552736% |
| B | 41958 | 257 | 0.612517% |
| C | 41967 | 86 | 0.204923% |
| D | 41789 | 1215 | 2.907464% |
Noise dominated data is calculated using 1-second bins in cleaned event files. If a bin has >2000 counts, and if more than 50% of those come from <1% of pixels, then it is considered to be noise-dominated and hence unusable.
| Quadrant | # 1 sec bins | Bins with >0 counts | Bins with >2000 counts | High rate bins dominated by noise | Noise dominated (total time) | Noise dominated (detector-on time) | Marked lightcurve |
|---|---|---|---|---|---|---|---|
| A | 51302 | 43524 | 45 | 45 | 0.09% | 0.10% | 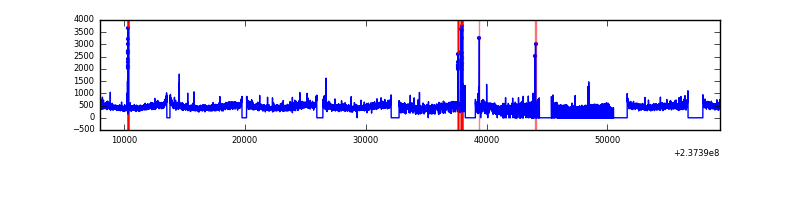 |
| B | 51302 | 43510 | 31 | 31 | 0.06% | 0.07% | 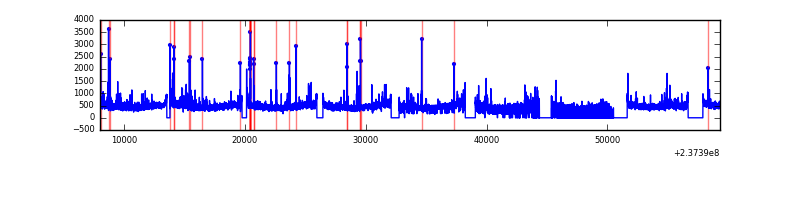 |
| C | 51302 | 43478 | 1 | 1 | 0.00% | 0.00% | 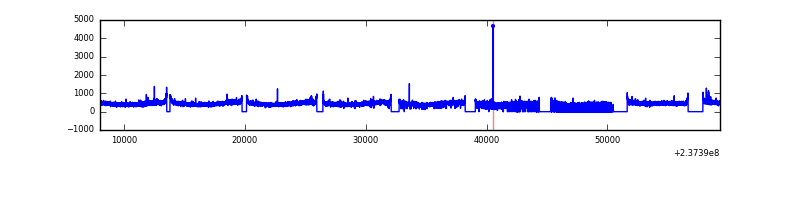 |
| D | 51302 | 43339 | 992 | 992 | 1.93% | 2.29% | 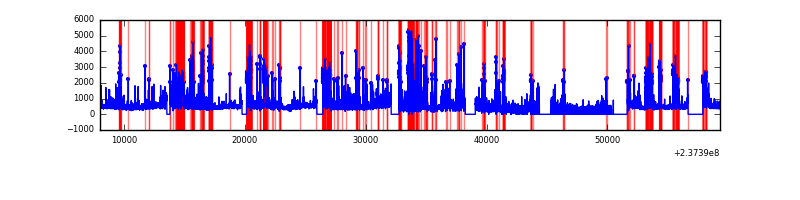 |
Top three noisy pixels from each quadrant. If the there are fewer than three noisy pixels in the level2.evt file, extra rows are filled as -1
| Pixel properties | Quadrant properties | ||||||
|---|---|---|---|---|---|---|---|
| Quadrant | DetID | PixID | Counts | Sigma | Mean | Median | Sigma |
| A | 15 | 174 | 264714 | 260.43 | 4941 | 4842 | 997.8 |
| A | 14 | 111 | 97316 | 92.67 | 4941 | 4842 | 997.8 |
| A | 0 | 226 | 45829 | 41.08 | 4941 | 4842 | 997.8 |
| B | 0 | 214 | 407400 | 428.2 | 4962 | 4849 | 940.1 |
| B | 0 | 219 | 138854 | 142.54 | 4962 | 4849 | 940.1 |
| B | 0 | 229 | 128615 | 131.65 | 4962 | 4849 | 940.1 |
| C | 13 | 61 | 36043 | 28.26 | 4791 | 4803 | 1105.4 |
| C | 8 | 128 | 23881 | 17.26 | 4791 | 4803 | 1105.4 |
| C | 14 | 67 | 20080 | 13.82 | 4791 | 4803 | 1105.4 |
| D | 1 | 52 | 2576443 | 2259.73 | 4690 | 4578 | 1138.1 |
| D | 7 | 71 | 1852250 | 1623.43 | 4690 | 4578 | 1138.1 |
| D | 12 | 233 | 957580 | 837.34 | 4690 | 4578 | 1138.1 |
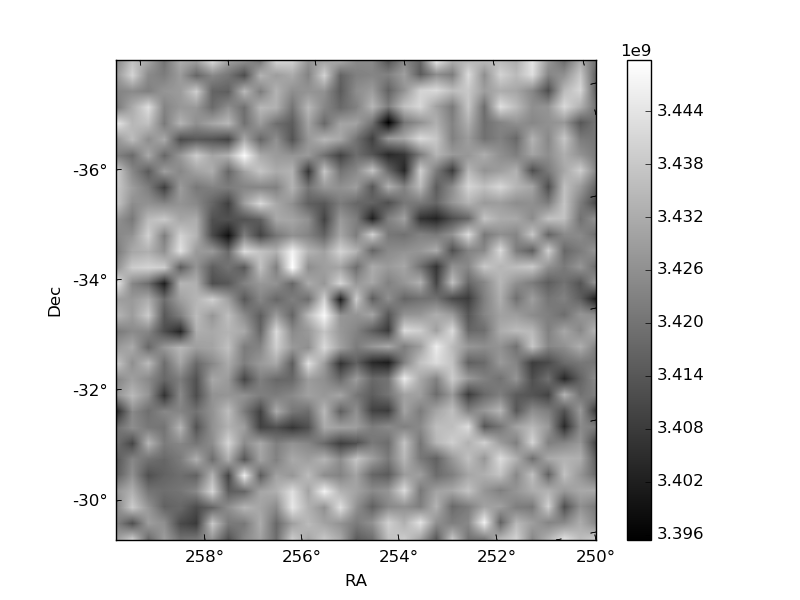
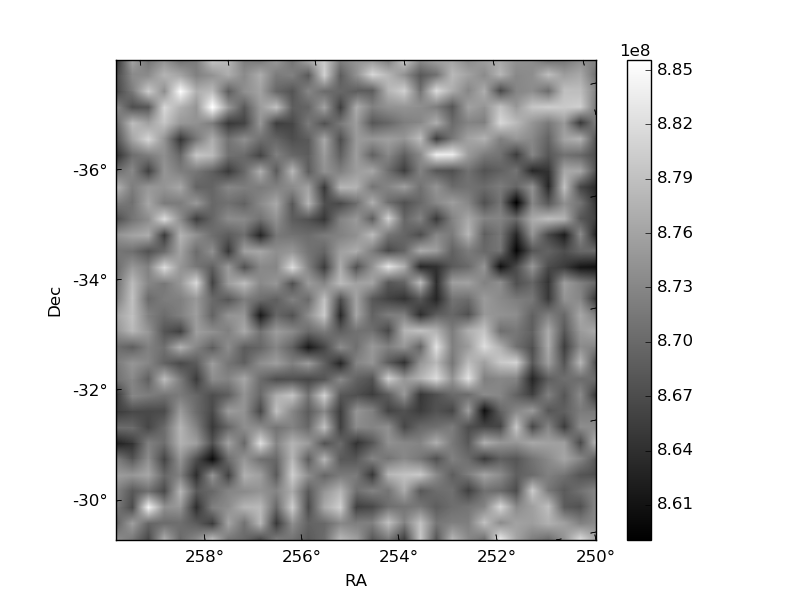
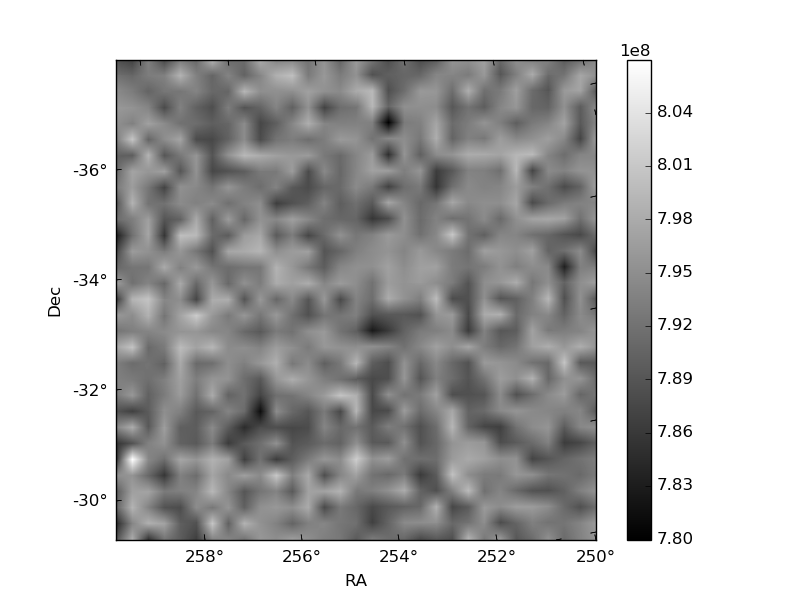
Histogram calculated using DETX and DETY for each event in the final _common_clean file
| Quadrant A | 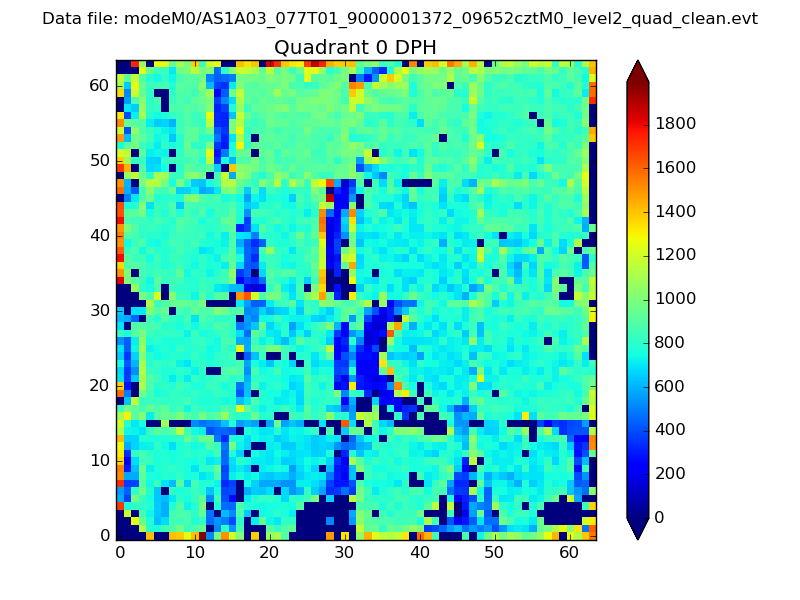 |
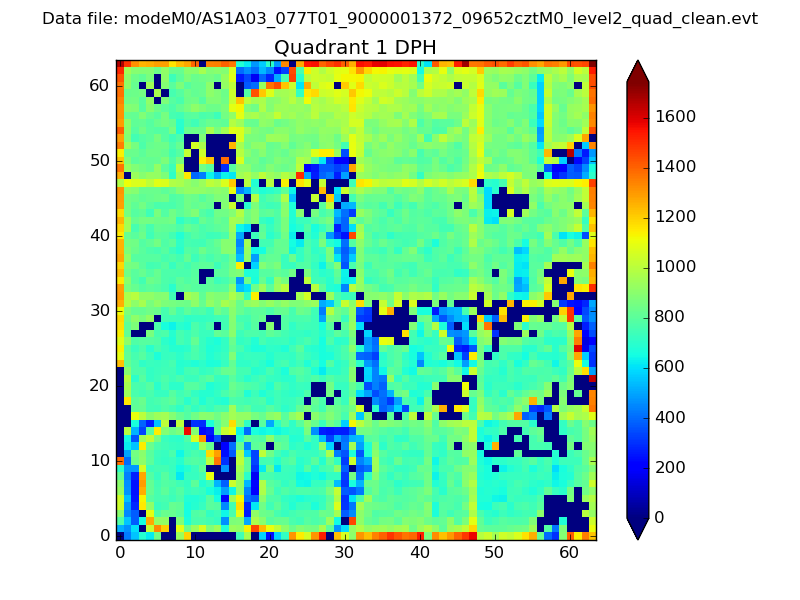 |
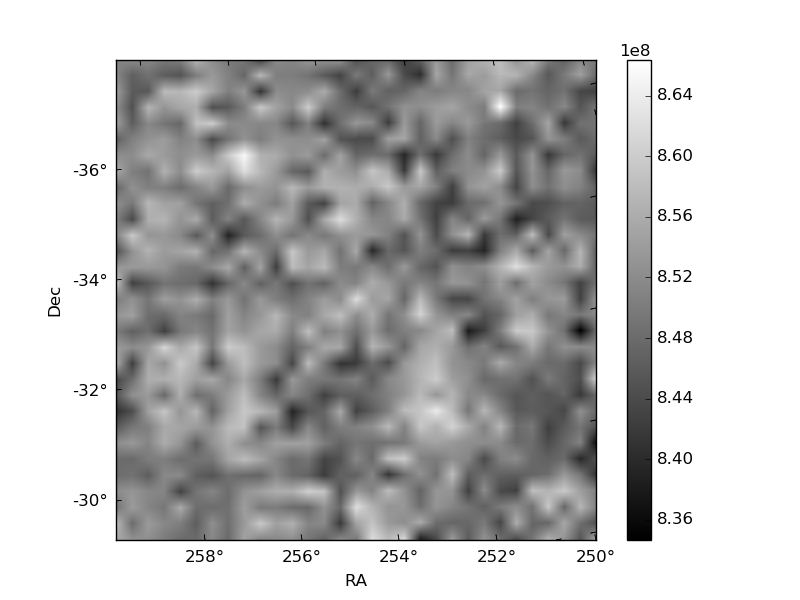
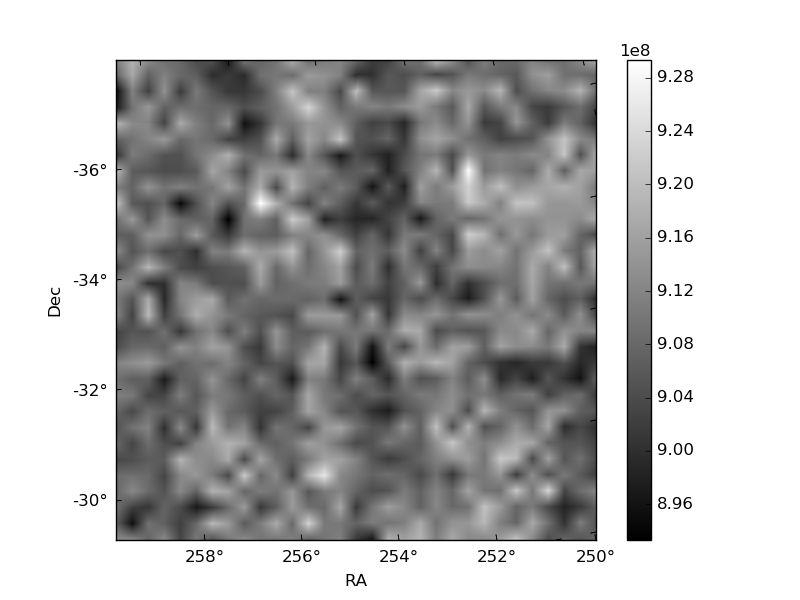
Quadrant B |
|---|---|---|---|
| Quadrant D | 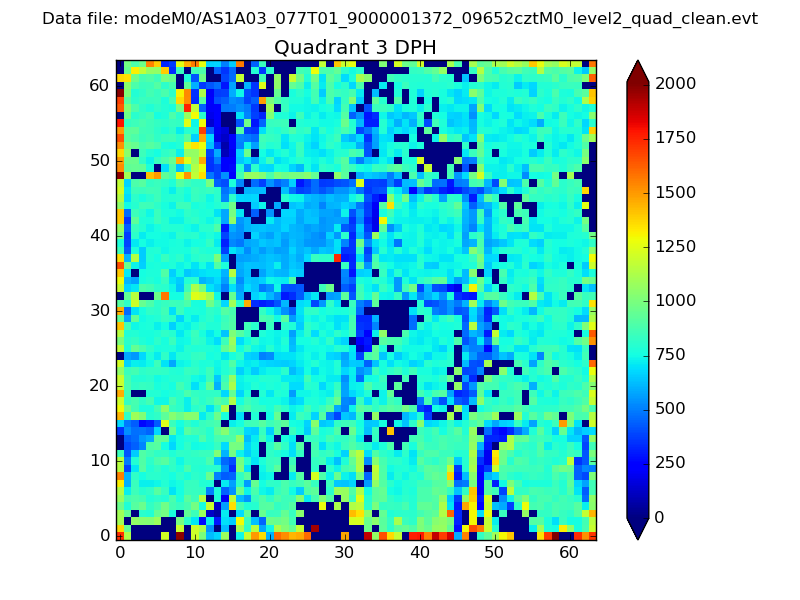 |
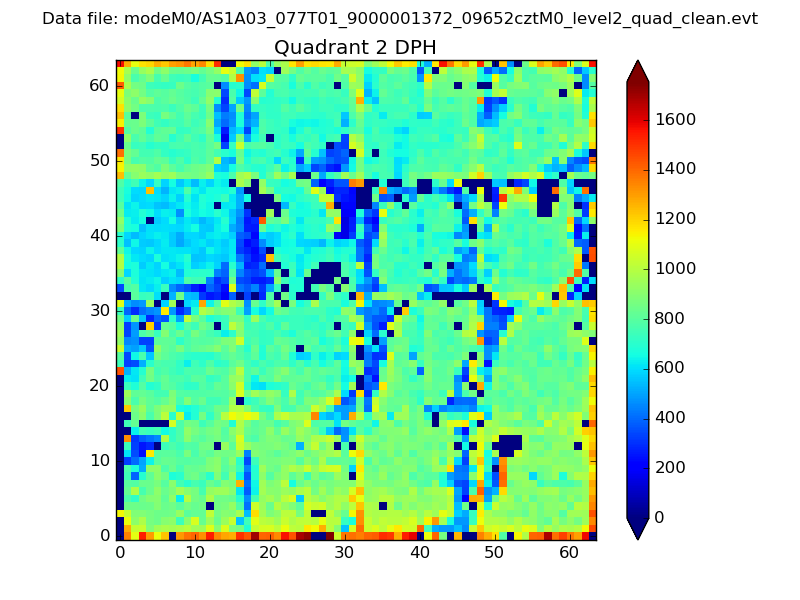 |
Quadrant C |
| Plot type | Count rate plots | Images |
|---|---|---|
| Comparison with Poisson distribution Blue bars denote a histogram of data divided into 1 sec bins. Red curve is a Poisson curve with rate = median count rate of data. |
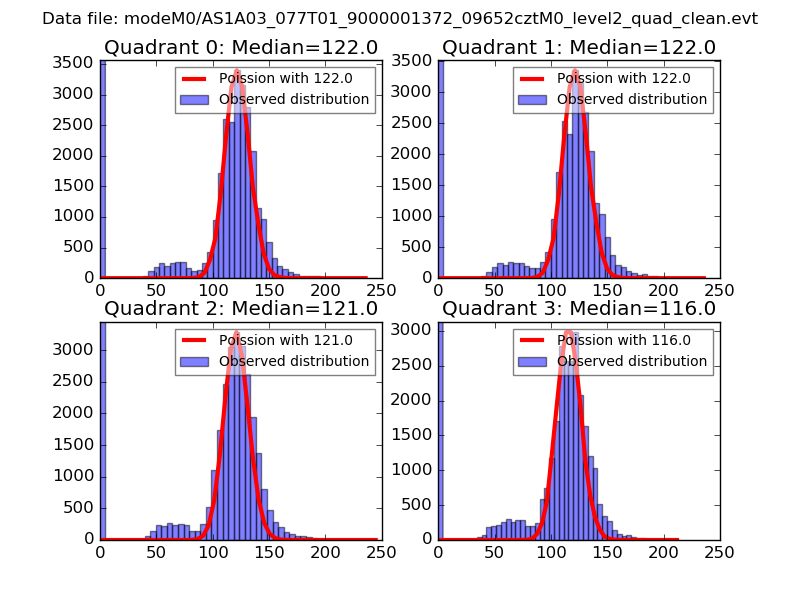 |
 |
| Quadrant-wise count rates Data is divided into 100 sec bins |
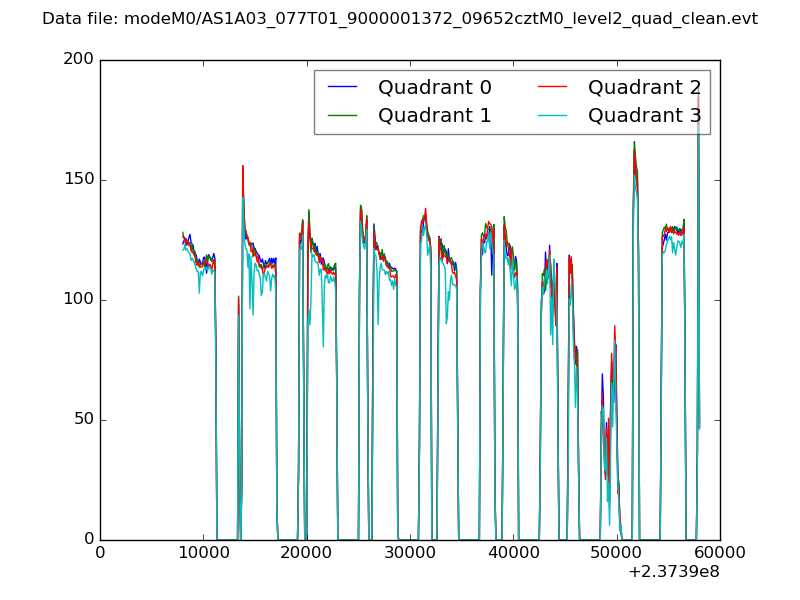 |
|
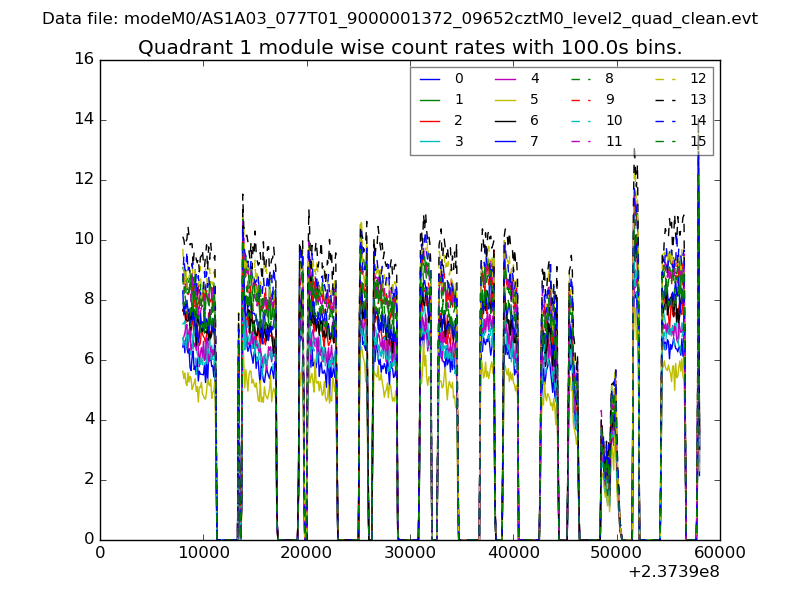
| Module-wise count rates for Quadrant A Data is divided into 100 sec bins |
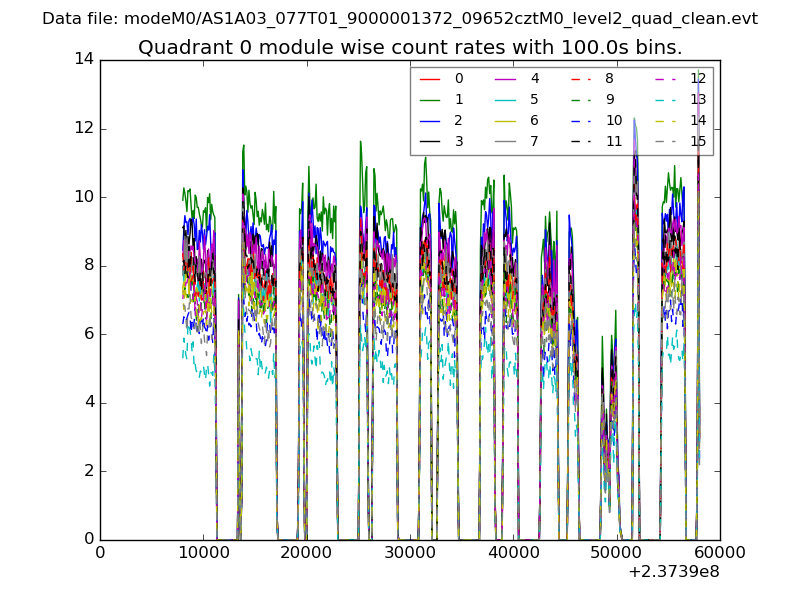 |
 |
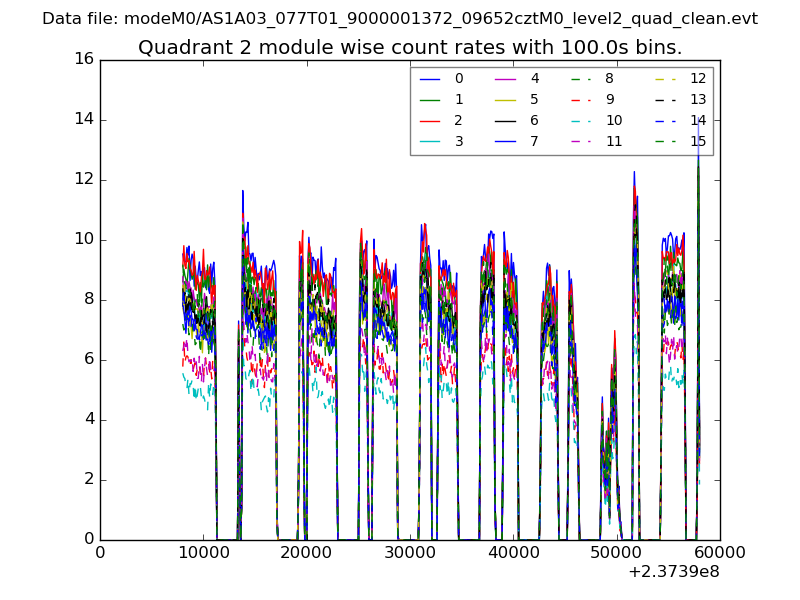
| Module-wise count rates for Quadrant B Data is divided into 100 sec bins |
 |
 |
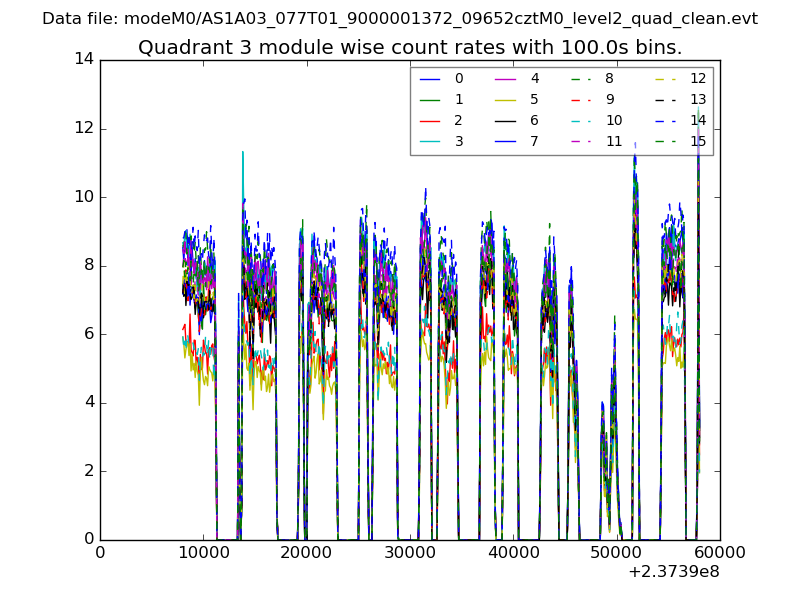
| Module-wise count rates for Quadrant C Data is divided into 100 sec bins |
 |
 |
| Module-wise count rates for Quadrant D Data is divided into 100 sec bins |
 |
 |
| Parameter | Plot |
|---|---|
| CZT HV Monitor | 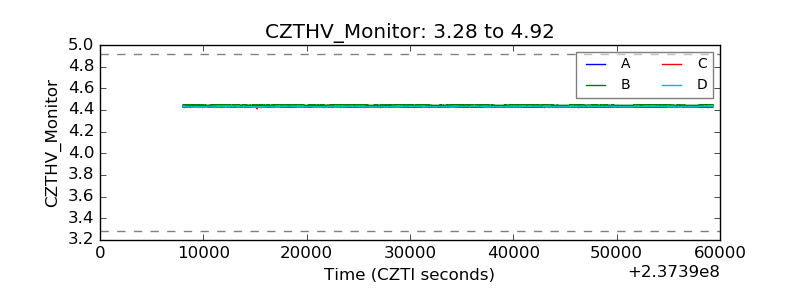 |
| D_VDD | 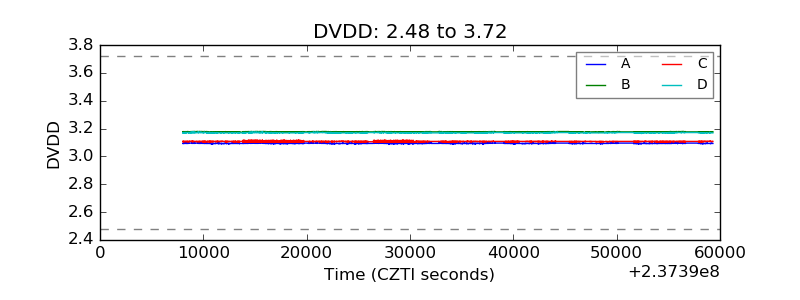 |
| Temperature 1 | 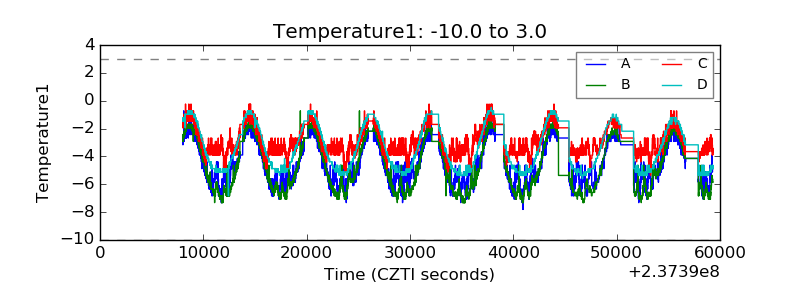 |
| Veto HV Monitor | 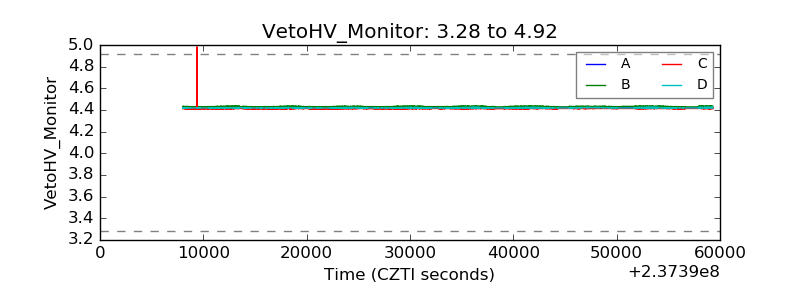 |
| Veto LLD | 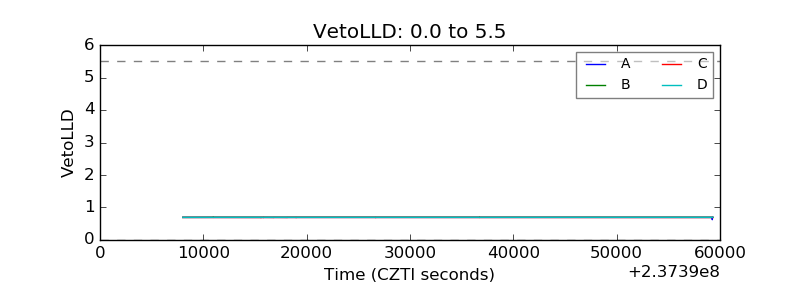 |
| Alpha Counter | 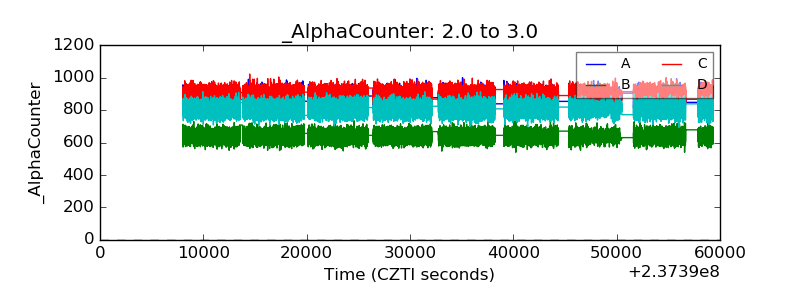 |
| _CPM_Rate | 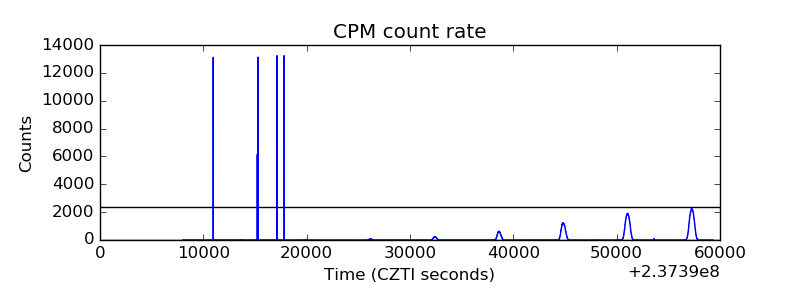 |
| CZT Counter | 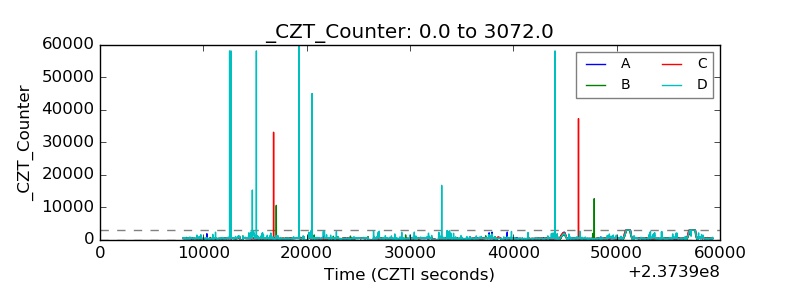 |
| +2.5 Volts monitor |  |
| +5 Volts monitor |  |
| _ROLL_ROT | 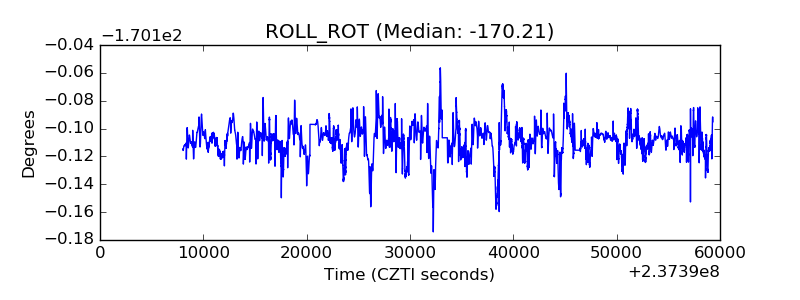 |
| _Roll_DEC | 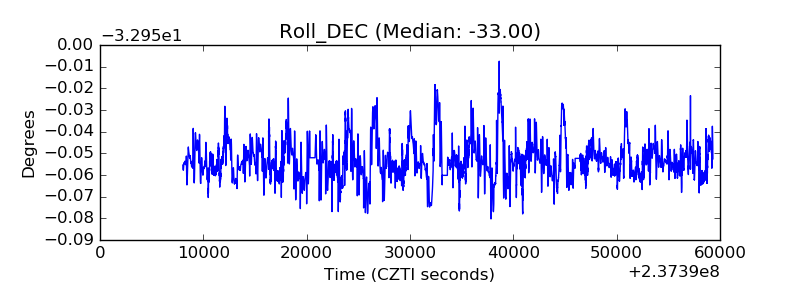 |
| _Roll_RA | 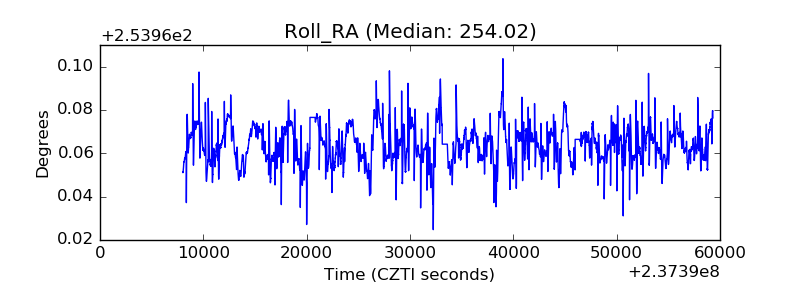 |
| Veto Counter | 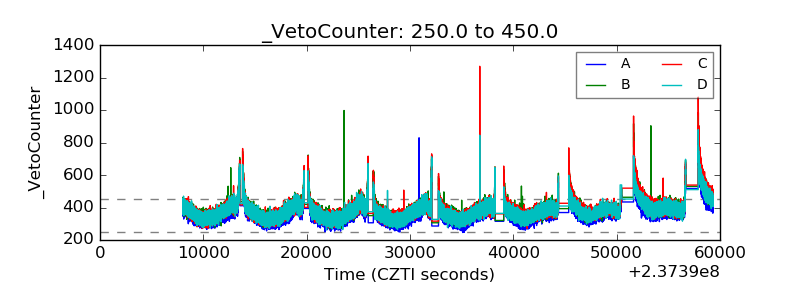 |