| Param | Original file | Final file |
|---|---|---|
| Filename | modeM0/AS1A03_077T01_9000001372_09653cztM0_level2.evt | modeM0/AS1A03_077T01_9000001372_09653cztM0_level2_quad_clean.evt |
| Size (bytes) | 866,862,720 | 123,459,840 |
| Size | 826.7 MB | 117.7 MB |
| Events in quadrant A | 5,449,193 | 757,078 |
| Events in quadrant B | 5,746,451 | 767,952 |
| Events in quadrant C | 5,410,209 | 758,399 |
| Events in quadrant D | 8,884,959 | 675,153 |
| Mode M9 | |||
|---|---|---|---|
| Quadrant | BADHDUFLAG | Total packets | Discarded packets |
| A | 0 | 31 | 0 |
| B | 0 | 31 | 0 |
| C | 0 | 31 | 0 |
| D | 0 | 32 | 0 |
| Mode SS | |||
|---|---|---|---|
| Quadrant | BADHDUFLAG | Total packets | Discarded packets |
| A | 0 | 228 | 0 |
| B | 0 | 228 | 0 |
| C | 0 | 228 | 0 |
| D | 0 | 228 | 0 |
| Mode M0 | |||
|---|---|---|---|
| Quadrant | BADHDUFLAG | Total packets | Discarded packets |
| A | 0 | 23203 | 3 |
| B | 0 | 23798 | 4 |
| C | 0 | 23233 | 2 |
| D | 0 | 33843 | 4 |
| Quadrant | Total seconds | Saturated seconds | Saturation percentage |
|---|---|---|---|
| A | 11276 | 38 | 0.336999% |
| B | 11275 | 68 | 0.603104% |
| C | 11276 | 44 | 0.390209% |
| D | 11275 | 941 | 8.345898% |
Noise dominated data is calculated using 1-second bins in cleaned event files. If a bin has >2000 counts, and if more than 50% of those come from <1% of pixels, then it is considered to be noise-dominated and hence unusable.
| Quadrant | # 1 sec bins | Bins with >0 counts | Bins with >2000 counts | High rate bins dominated by noise | Noise dominated (total time) | Noise dominated (detector-on time) | Marked lightcurve |
|---|---|---|---|---|---|---|---|
| A | 13821 | 11278 | 0 | 0 | 0.00% | 0.00% | 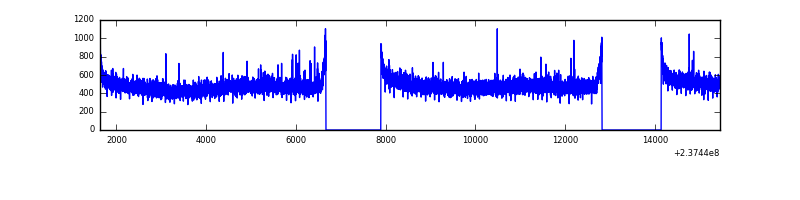 |
| B | 13821 | 11278 | 6 | 6 | 0.04% | 0.05% | 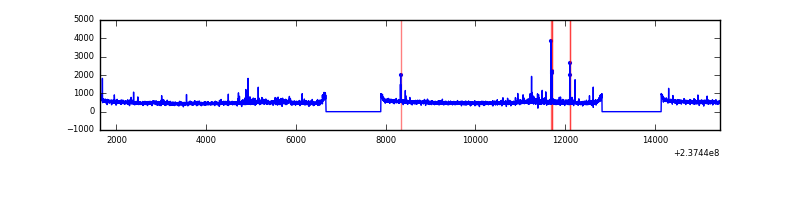 |
| C | 13821 | 11278 | 0 | 0 | 0.00% | 0.00% |  |
| D | 13821 | 11278 | 863 | 863 | 6.24% | 7.65% | 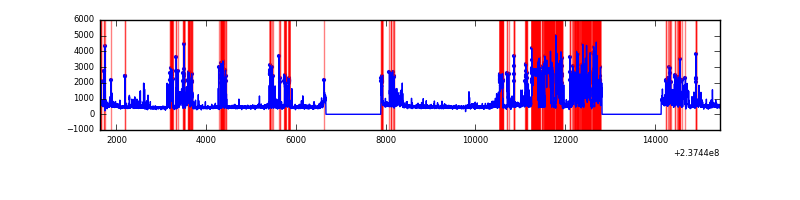 |
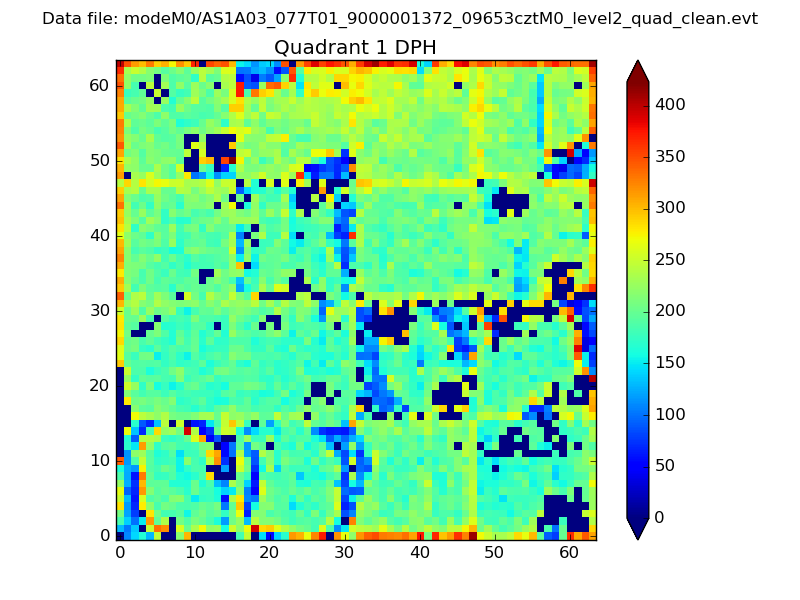
Top three noisy pixels from each quadrant. If the there are fewer than three noisy pixels in the level2.evt file, extra rows are filled as -1
| Pixel properties | Quadrant properties | ||||||
|---|---|---|---|---|---|---|---|
| Quadrant | DetID | PixID | Counts | Sigma | Mean | Median | Sigma |
| A | 0 | 226 | 13353 | 42.38 | 1413 | 1384 | 282.4 |
| A | 12 | 194 | 11473 | 35.72 | 1413 | 1384 | 282.4 |
| A | 15 | 174 | 8419 | 24.91 | 1413 | 1384 | 282.4 |
| B | 0 | 214 | 120789 | 450.82 | 1420 | 1389 | 264.9 |
| B | 0 | 229 | 39820 | 145.1 | 1420 | 1389 | 264.9 |
| B | 0 | 219 | 34374 | 124.54 | 1420 | 1389 | 264.9 |
| C | 5 | 128 | 12090 | 33.88 | 1382 | 1393 | 315.7 |
| C | 13 | 61 | 10381 | 28.47 | 1382 | 1393 | 315.7 |
| C | 14 | 67 | 8172 | 21.47 | 1382 | 1393 | 315.7 |
| D | 1 | 52 | 2341288 | 7413.64 | 1319 | 1286 | 315.6 |
| D | 7 | 71 | 986177 | 3120.35 | 1319 | 1286 | 315.6 |
| D | 12 | 233 | 385671 | 1217.82 | 1319 | 1286 | 315.6 |
Histogram calculated using DETX and DETY for each event in the final _common_clean file
| Quadrant A |  |
 |
Quadrant B |
|---|---|---|---|
| Quadrant D |  |
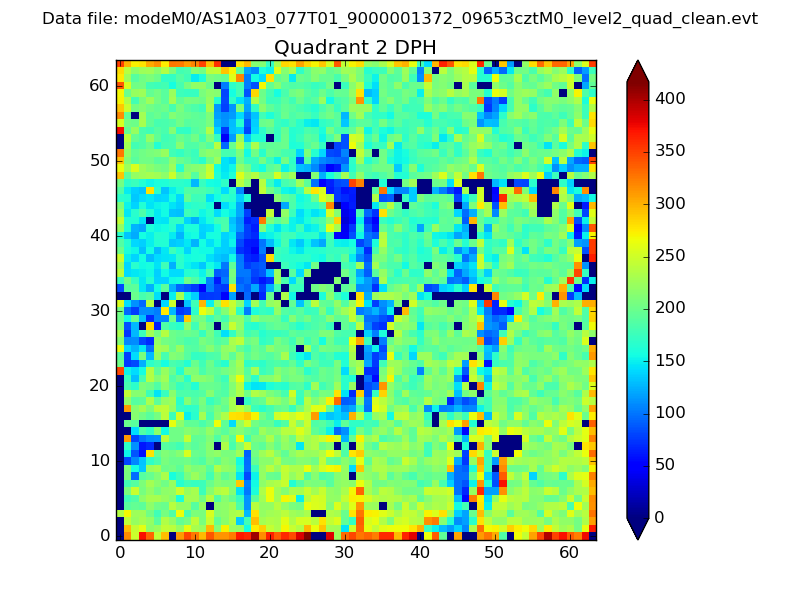 |
Quadrant C |
| Plot type | Count rate plots | Images |
|---|---|---|
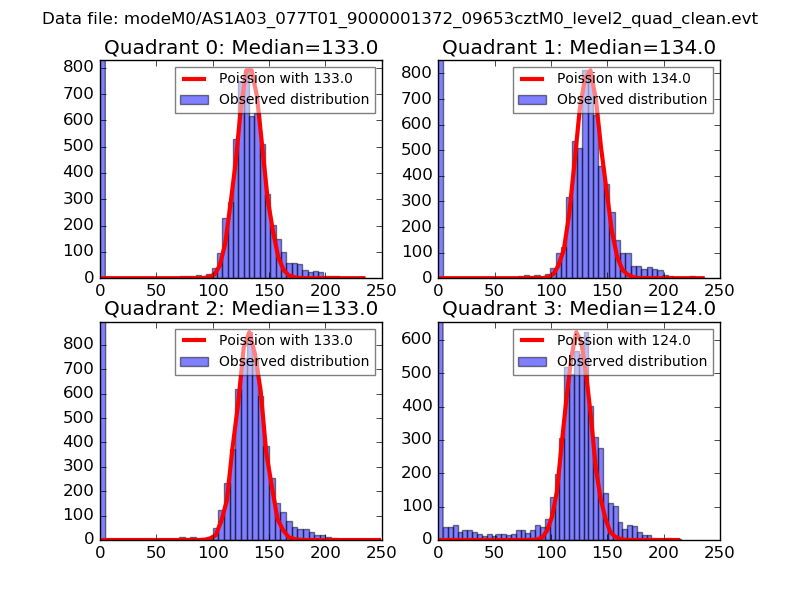
| Comparison with Poisson distribution Blue bars denote a histogram of data divided into 1 sec bins. Red curve is a Poisson curve with rate = median count rate of data. |
 |
 |
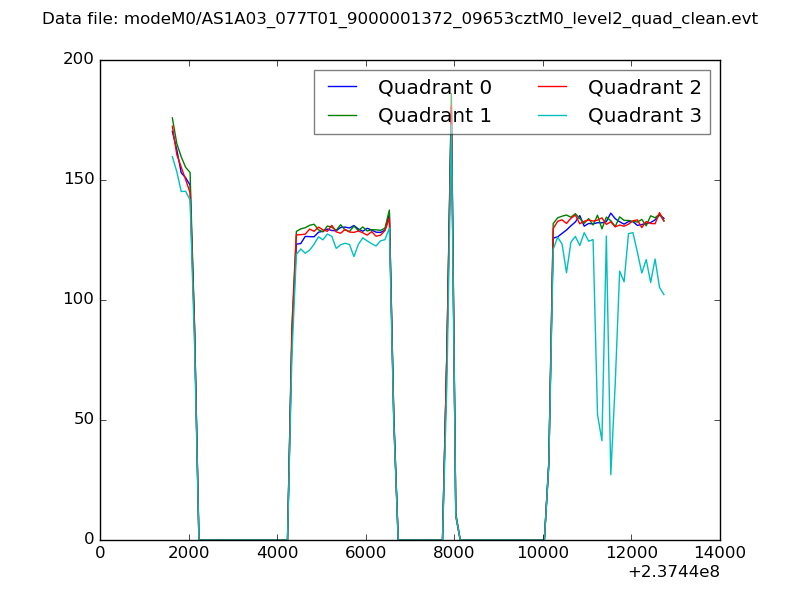
| Quadrant-wise count rates Data is divided into 100 sec bins |
 |
|
| Module-wise count rates for Quadrant A Data is divided into 100 sec bins |
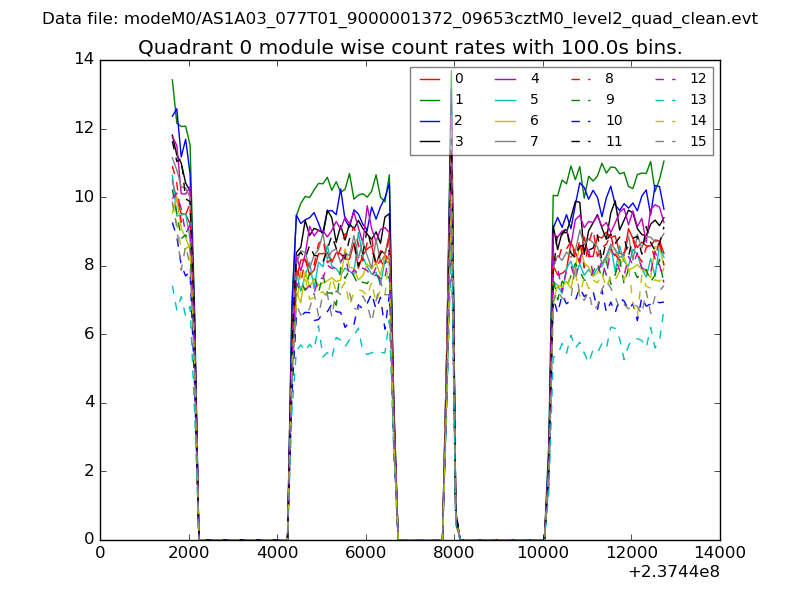 |
 |
| Module-wise count rates for Quadrant B Data is divided into 100 sec bins |
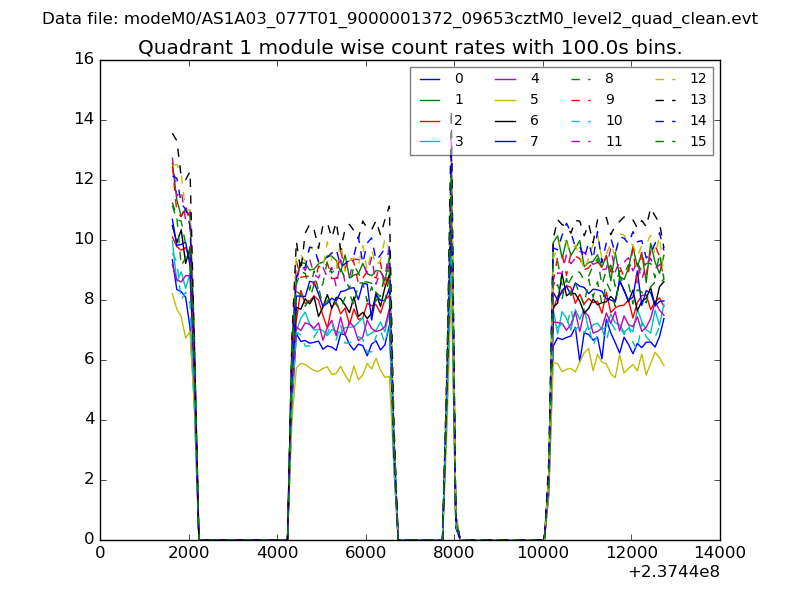 |
 |
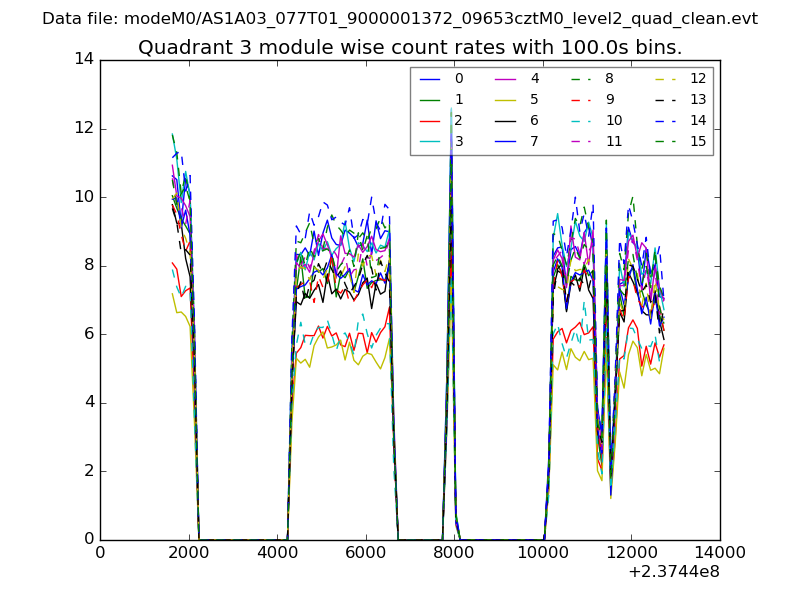
| Module-wise count rates for Quadrant C Data is divided into 100 sec bins |
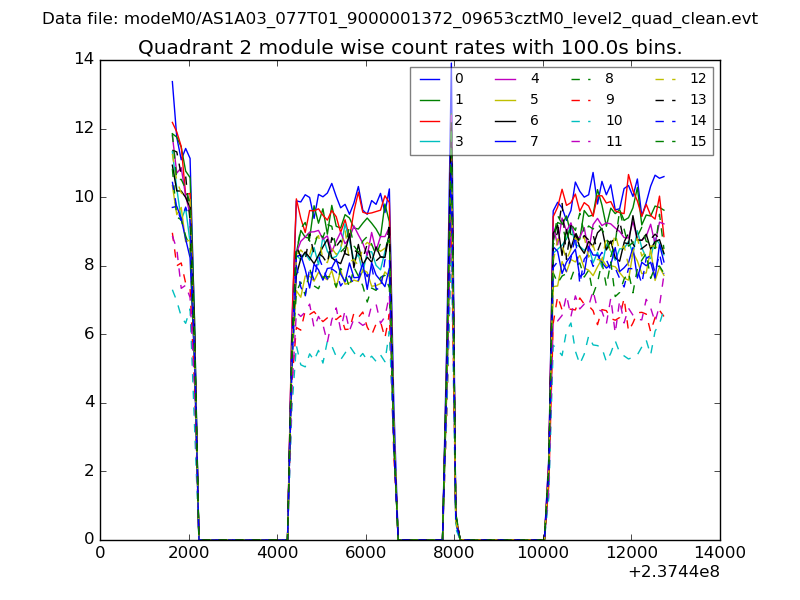 |
 |
| Module-wise count rates for Quadrant D Data is divided into 100 sec bins |
 |
 |
| Parameter | Plot |
|---|---|
| CZT HV Monitor |  |
| D_VDD | 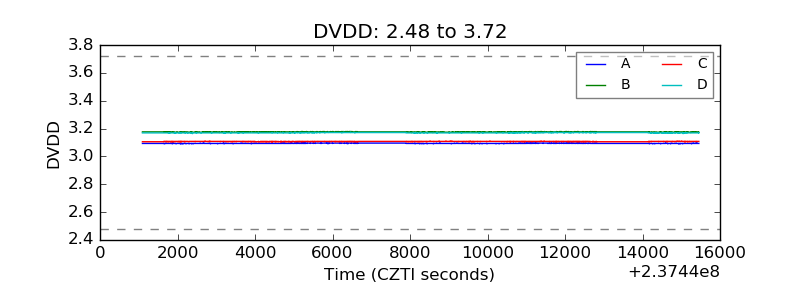 |
| Temperature 1 | 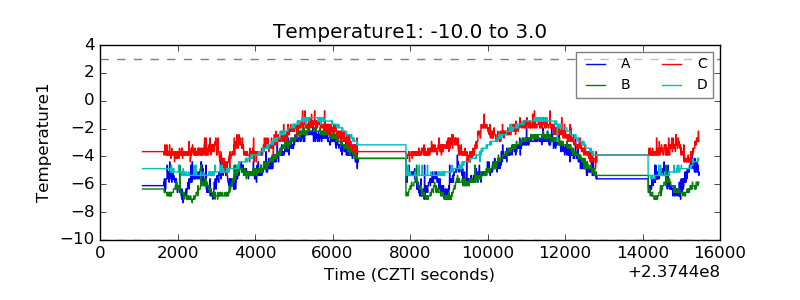 |
| Veto HV Monitor | 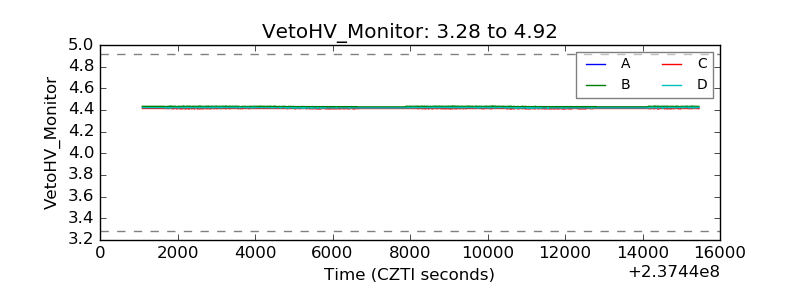 |
| Veto LLD | 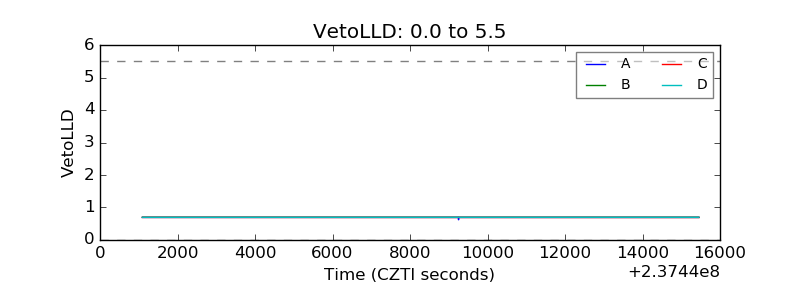 |
| Alpha Counter | 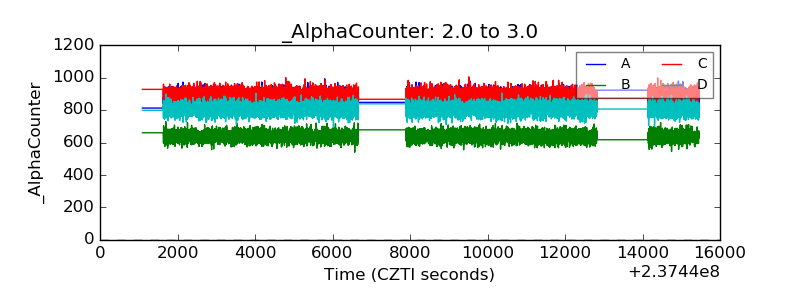 |
| _CPM_Rate | 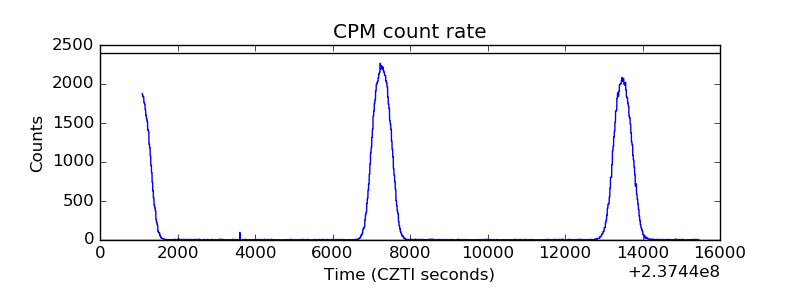 |
| CZT Counter | 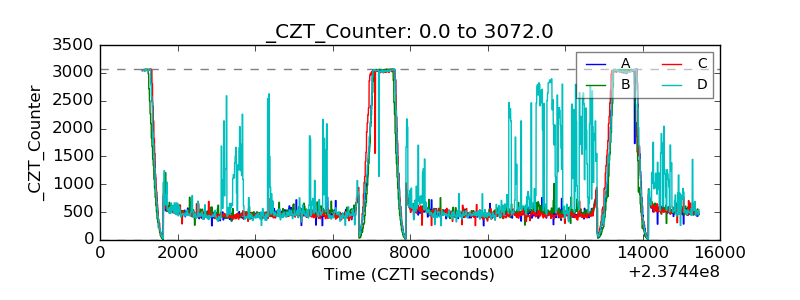 |
| +2.5 Volts monitor |  |
| +5 Volts monitor |  |
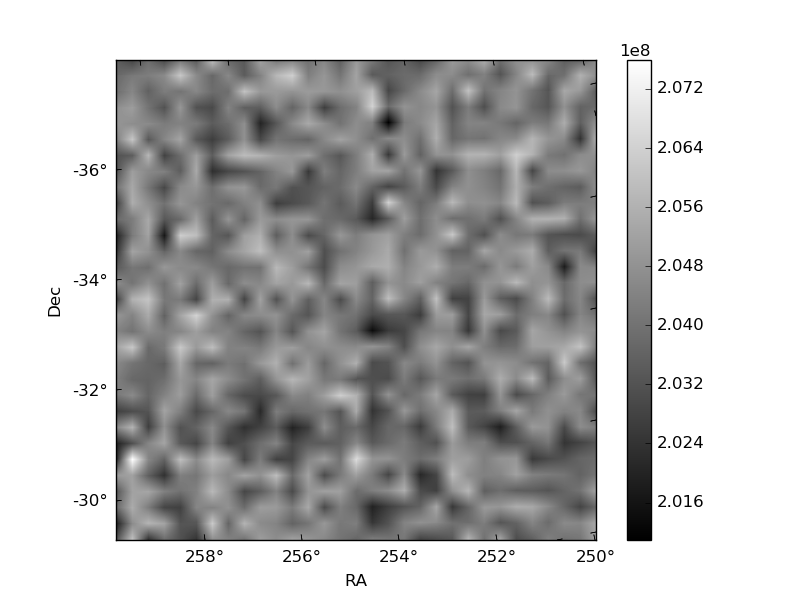
| _ROLL_ROT | 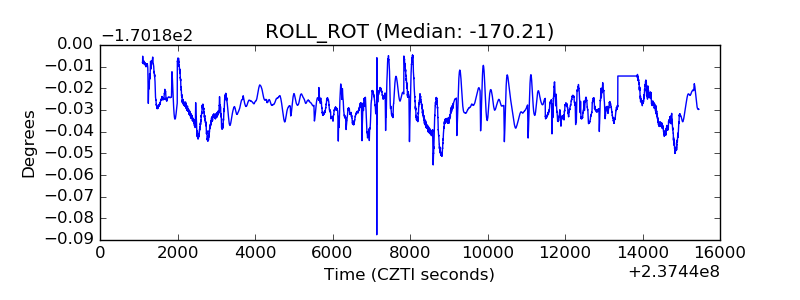 |
| _Roll_DEC | 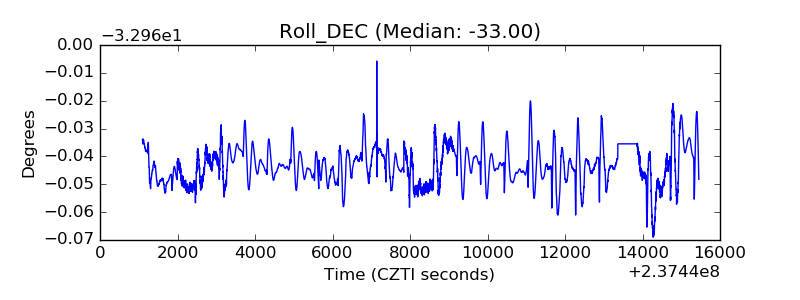 |
| _Roll_RA | 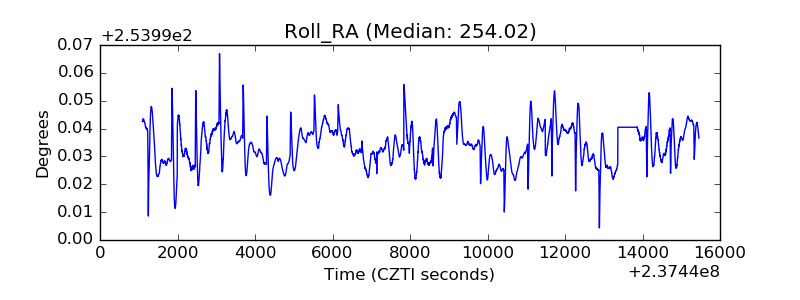 |
| Veto Counter | 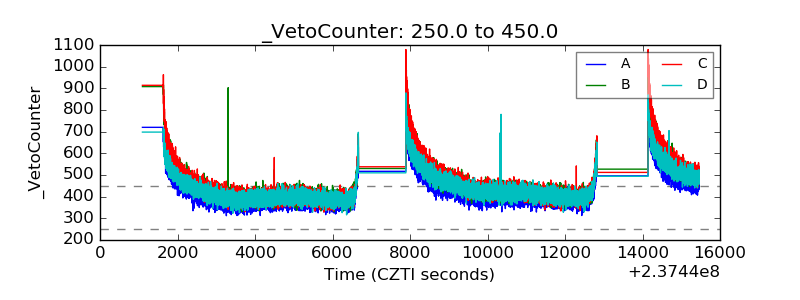 |