| Param | Original file | Final file |
|---|---|---|
| Filename | modeM0/AS1A03_077T01_9000001372_09656cztM0_level2.evt | modeM0/AS1A03_077T01_9000001372_09656cztM0_level2_quad_clean.evt |
| Size (bytes) | 15,837,120 | 3,637,440 |
| Size | 15.1 MB | 3.5 MB |
| Events in quadrant A | 112,239 | 20,700 |
| Events in quadrant B | 114,613 | 20,560 |
| Events in quadrant C | 123,208 | 25,359 |
| Events in quadrant D | 110,381 | 18,775 |
| Mode M9 | |||
|---|---|---|---|
| Quadrant | BADHDUFLAG | Total packets | Discarded packets |
| A | 0 | 19 | 13 |
| B | 0 | 20 | 15 |
| C | 0 | 18 | 14 |
| D | 0 | 21 | 18 |
| Mode SS | |||
|---|---|---|---|
| Quadrant | BADHDUFLAG | Total packets | Discarded packets |
| A | 0 | 118 | 112 |
| B | 0 | 117 | 111 |
| C | 0 | 118 | 112 |
| D | 0 | 126 | 124 |
| Mode M0 | |||
|---|---|---|---|
| Quadrant | BADHDUFLAG | Total packets | Discarded packets |
| A | 0 | 12145 | 11679 |
| B | 0 | 12349 | 11886 |
| C | 0 | 12071 | 11549 |
| D | 0 | 13210 | 12753 |
| Quadrant | Total seconds | Saturated seconds | Saturation percentage |
|---|---|---|---|
| A | 221 | 9 | 4.072398% |
| B | 223 | 8 | 3.587444% |
| C | 251 | 7 | 2.788845% |
| D | 210 | 4 | 1.904762% |
Noise dominated data is calculated using 1-second bins in cleaned event files. If a bin has >2000 counts, and if more than 50% of those come from <1% of pixels, then it is considered to be noise-dominated and hence unusable.
| Quadrant | # 1 sec bins | Bins with >0 counts | Bins with >2000 counts | High rate bins dominated by noise | Noise dominated (total time) | Noise dominated (detector-on time) | Marked lightcurve |
|---|---|---|---|---|---|---|---|
| A | 6061 | 391 | 0 | 0 | 0.00% | 0.00% | 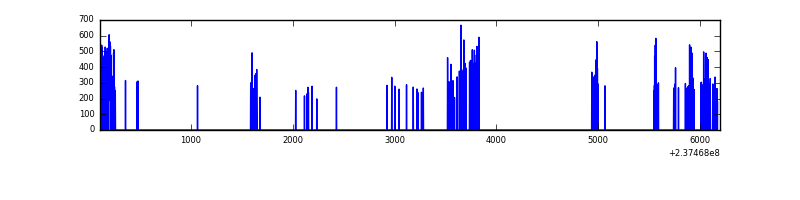 |
| B | 6063 | 399 | 0 | 0 | 0.00% | 0.00% | 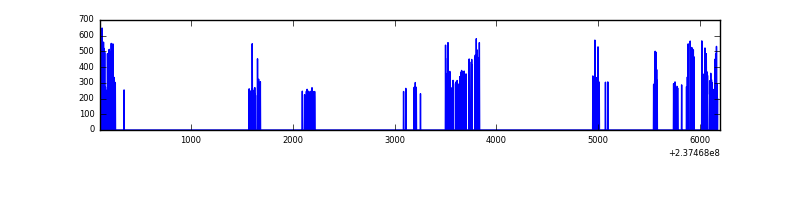 |
| C | 6081 | 436 | 0 | 0 | 0.00% | 0.00% | 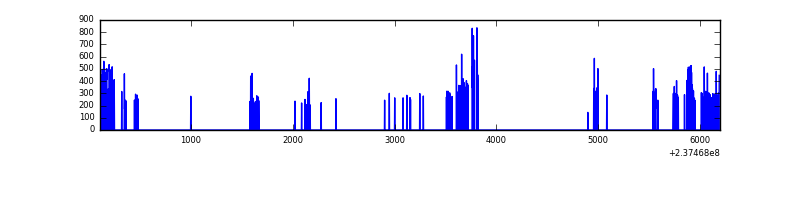 |
| D | 6076 | 381 | 0 | 0 | 0.00% | 0.00% |  |
Top three noisy pixels from each quadrant. If the there are fewer than three noisy pixels in the level2.evt file, extra rows are filled as -1
| Pixel properties | Quadrant properties | ||||||
|---|---|---|---|---|---|---|---|
| Quadrant | DetID | PixID | Counts | Sigma | Mean | Median | Sigma |
| A | 0 | 103 | 602 | 72.71 | 28 | 27 | 7.9 |
| A | 1 | 162 | 529 | 63.48 | 28 | 27 | 7.9 |
| A | 0 | 226 | 314 | 36.29 | 28 | 27 | 7.9 |
| B | 0 | 219 | 1093 | 137.85 | 28 | 27 | 7.7 |
| B | 0 | 214 | 830 | 103.84 | 28 | 27 | 7.7 |
| B | 12 | 111 | 559 | 68.8 | 28 | 27 | 7.7 |
| C | 14 | 67 | 399 | 40.33 | 31 | 31 | 9.1 |
| C | 13 | 61 | 220 | 20.71 | 31 | 31 | 9.1 |
| C | 5 | 128 | 100 | 7.56 | 31 | 31 | 9.1 |
| D | 1 | 52 | 6608 | 798.2 | 26 | 25 | 8.2 |
| D | 12 | 233 | 1374 | 163.57 | 26 | 25 | 8.2 |
| D | 2 | 234 | 855 | 100.64 | 26 | 25 | 8.2 |
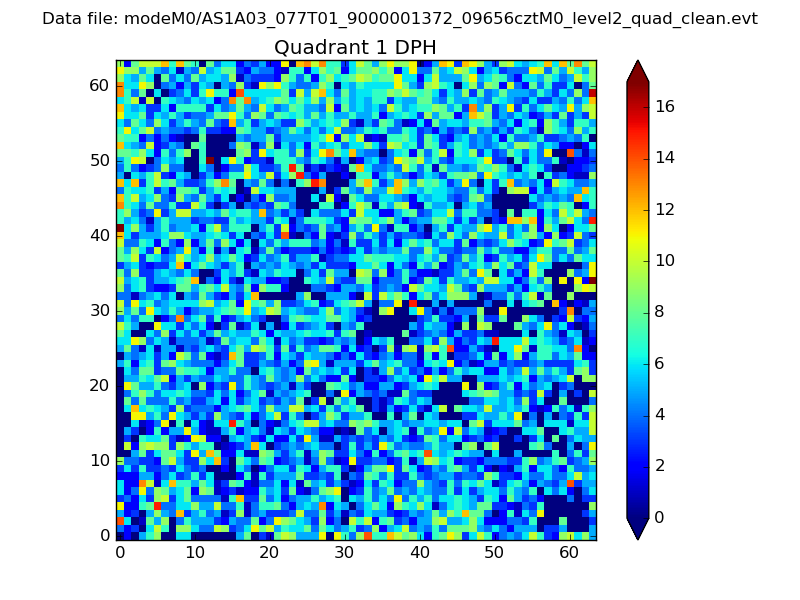
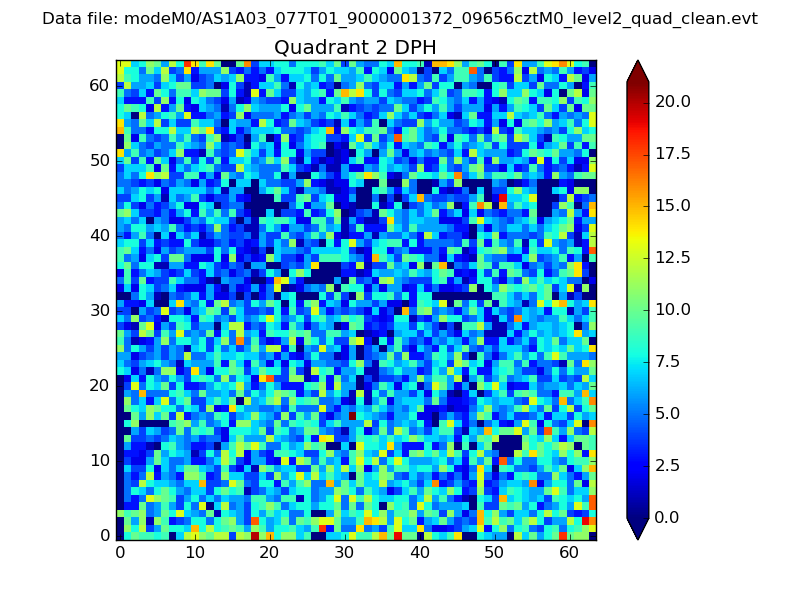
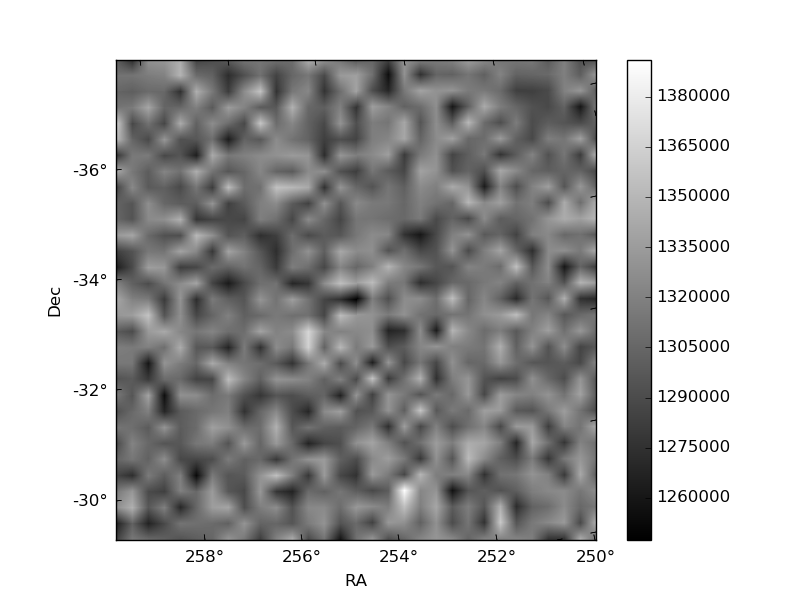
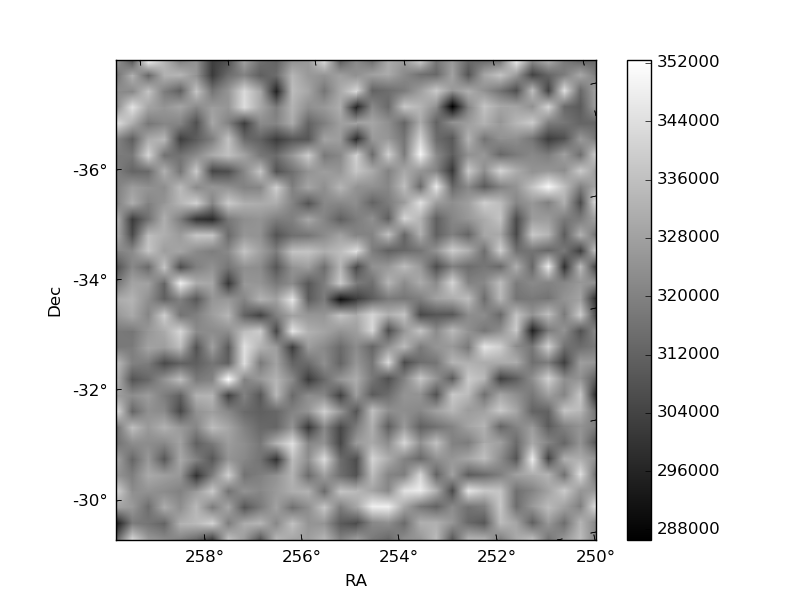
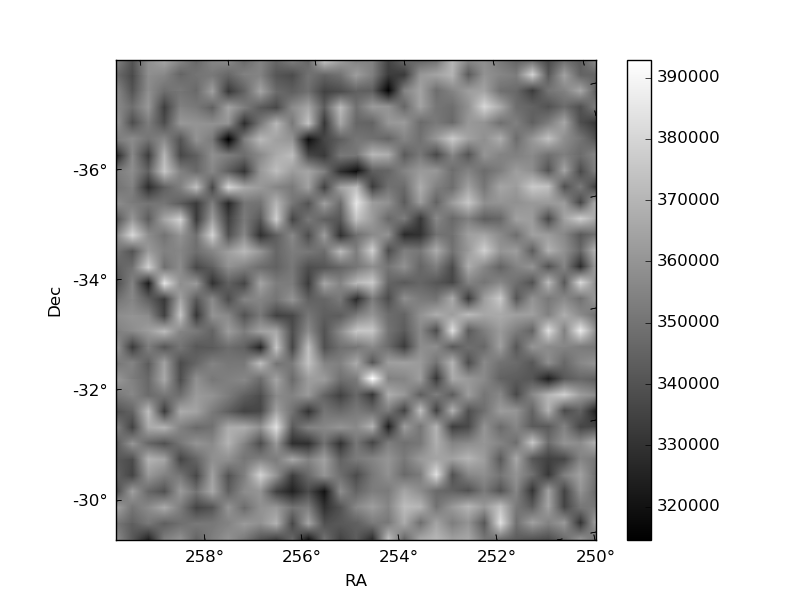
Histogram calculated using DETX and DETY for each event in the final _common_clean file
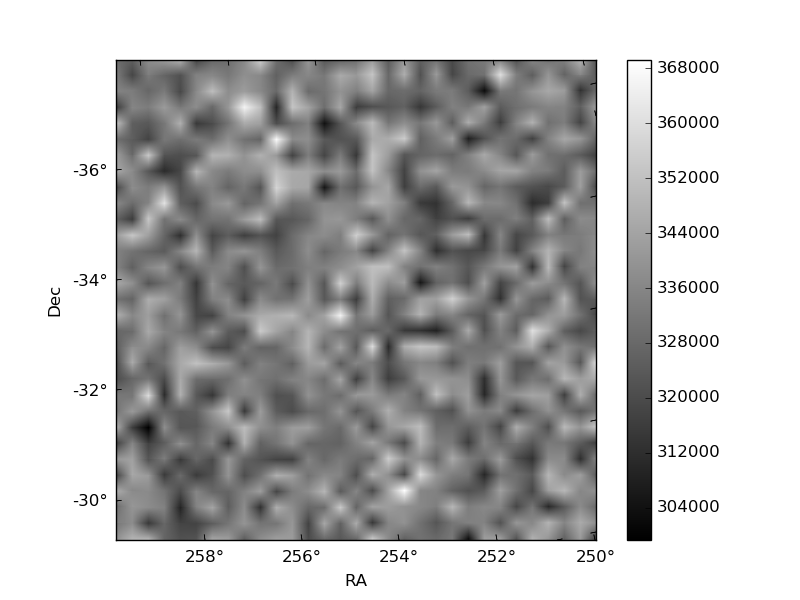
| Quadrant A | 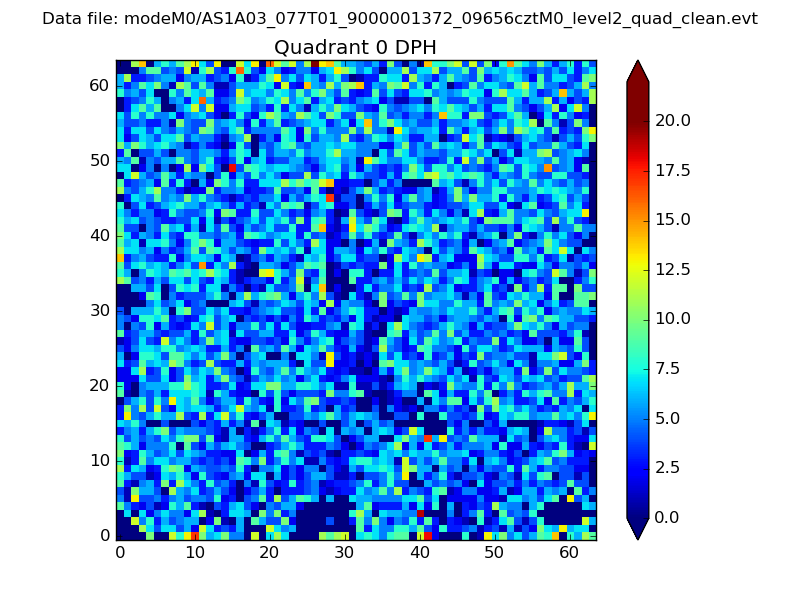 |
 |
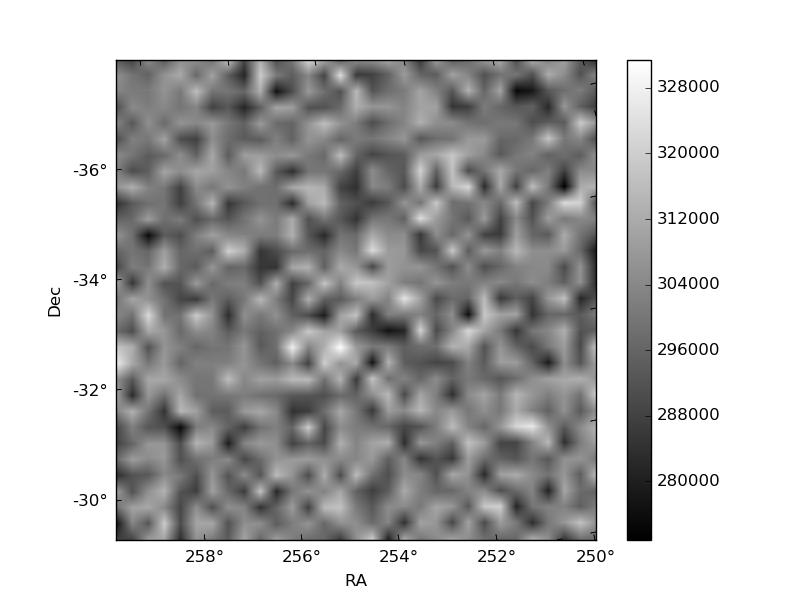
Quadrant B |
|---|---|---|---|
| Quadrant D | 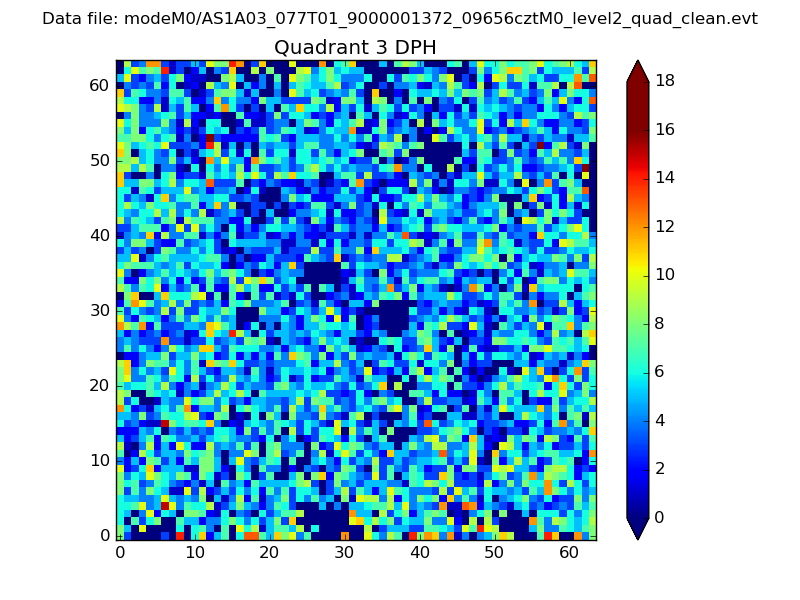 |
 |
Quadrant C |
| Plot type | Count rate plots | Images |
|---|---|---|
| Comparison with Poisson distribution Blue bars denote a histogram of data divided into 1 sec bins. Red curve is a Poisson curve with rate = median count rate of data. |
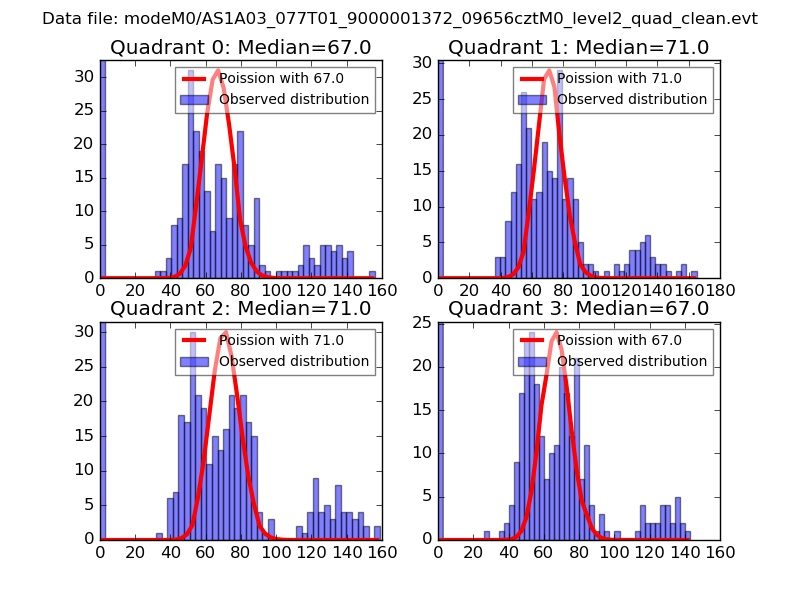 |
 |
| Quadrant-wise count rates Data is divided into 100 sec bins |
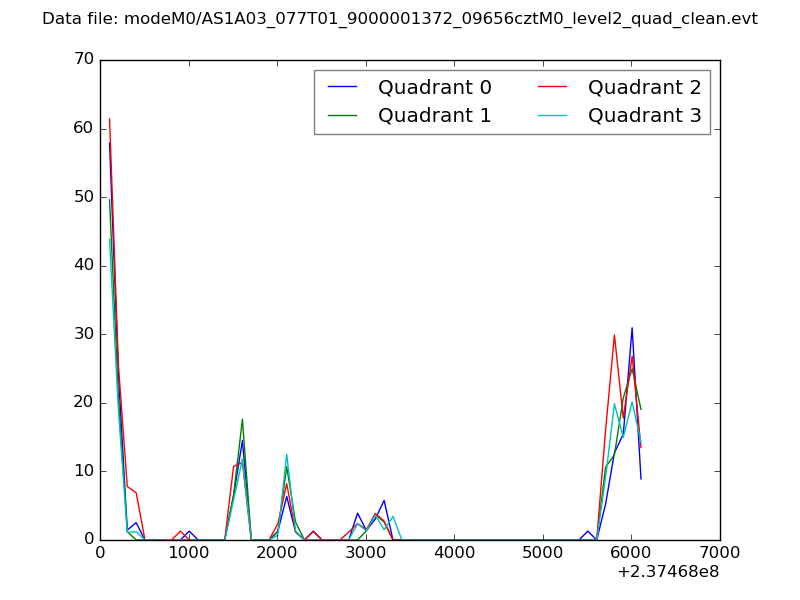 |
|
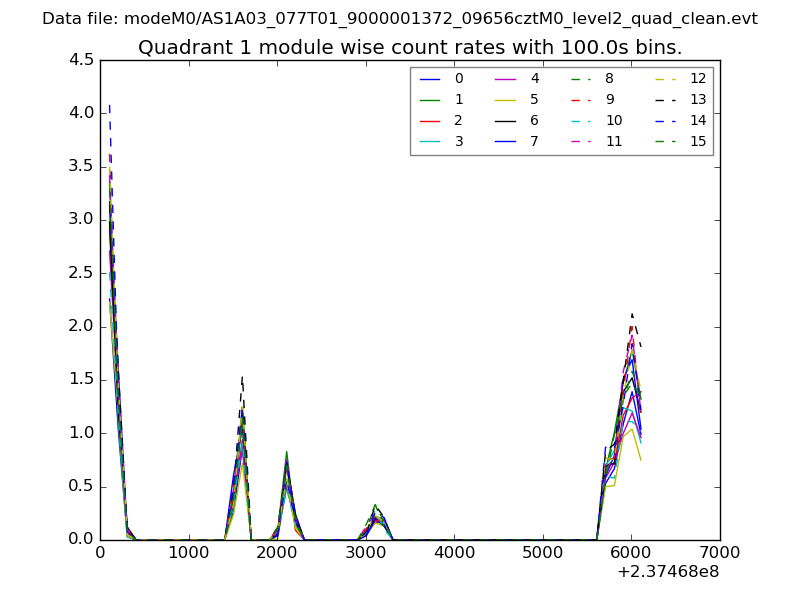
| Module-wise count rates for Quadrant A Data is divided into 100 sec bins |
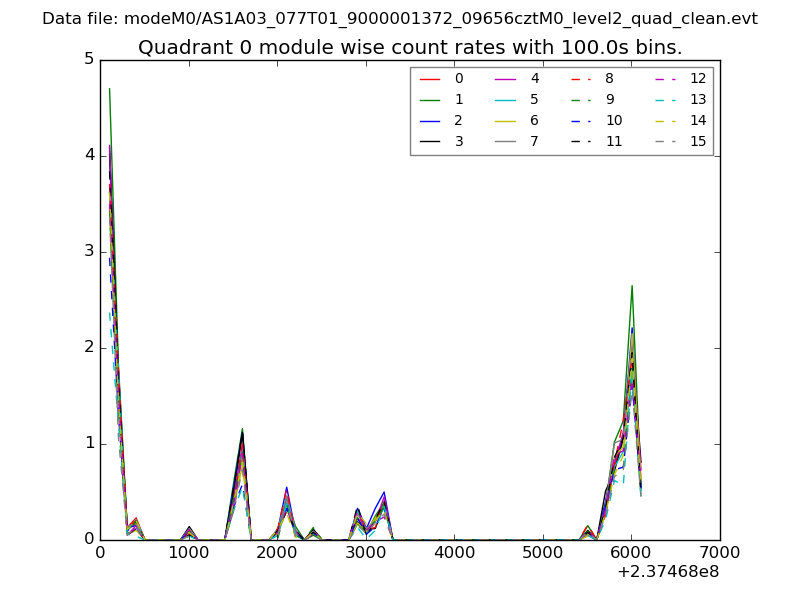 |
 |
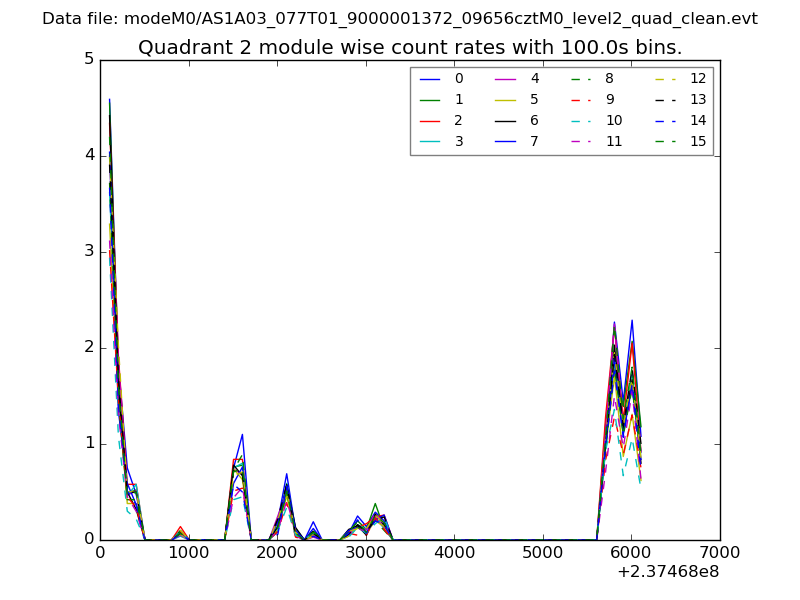
| Module-wise count rates for Quadrant B Data is divided into 100 sec bins |
 |
 |
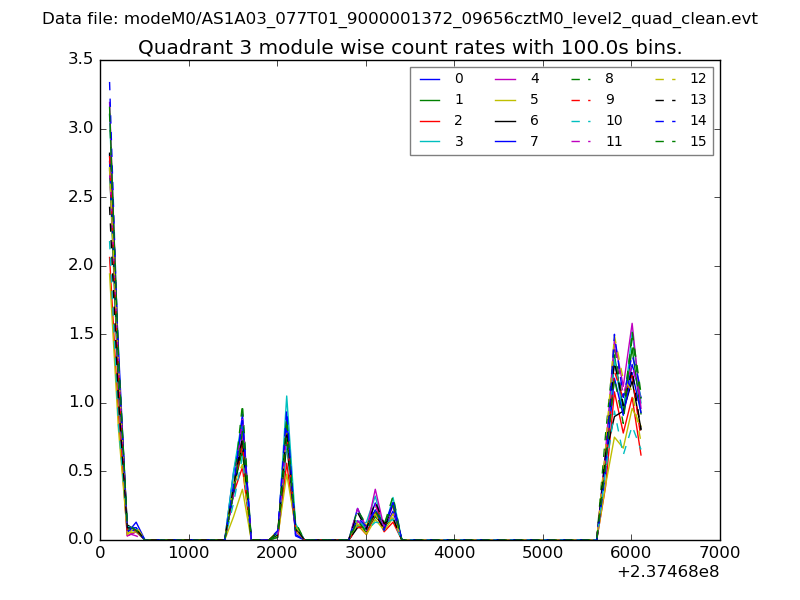
| Module-wise count rates for Quadrant C Data is divided into 100 sec bins |
 |
 |
| Module-wise count rates for Quadrant D Data is divided into 100 sec bins |
 |
 |
| Parameter | Plot |
|---|---|
| CZT HV Monitor | 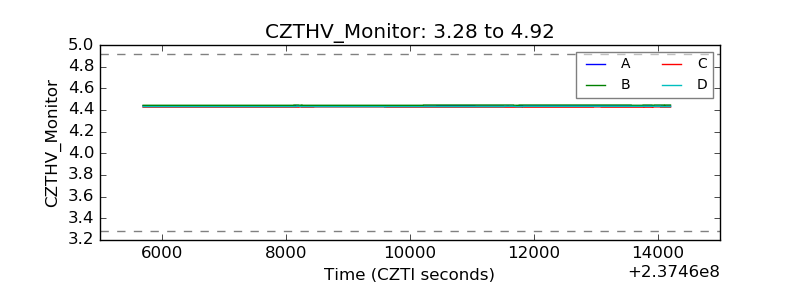 |
| D_VDD | 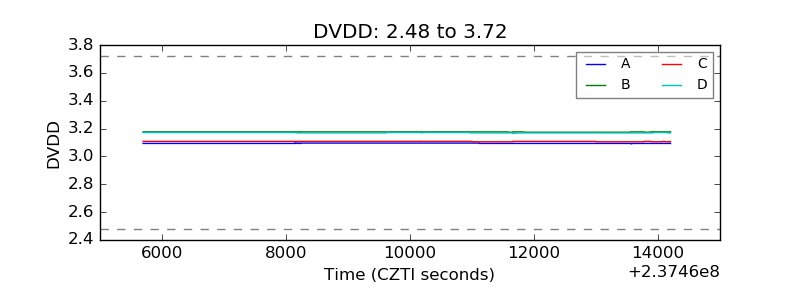 |
| Temperature 1 | 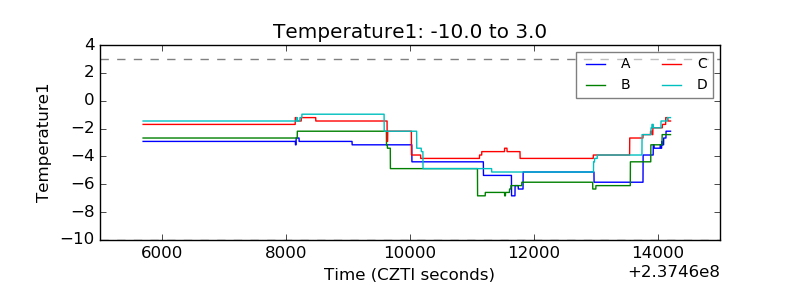 |
| Veto HV Monitor | 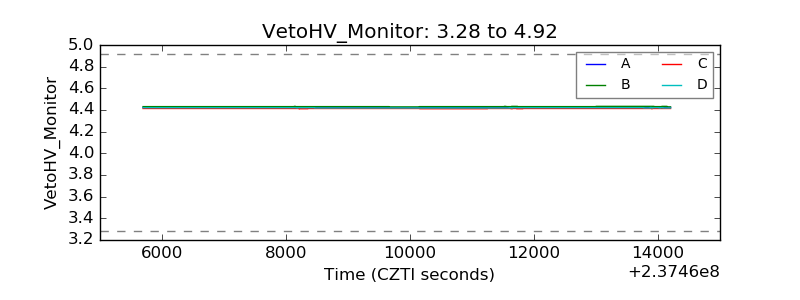 |
| Veto LLD | 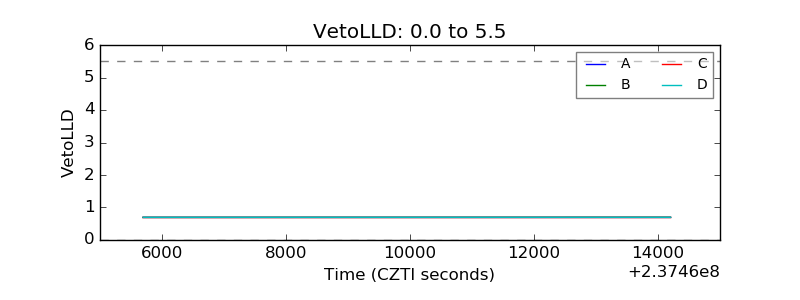 |
| Alpha Counter | 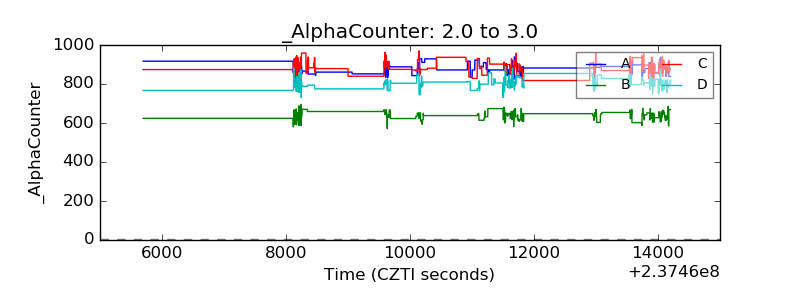 |
| _CPM_Rate | 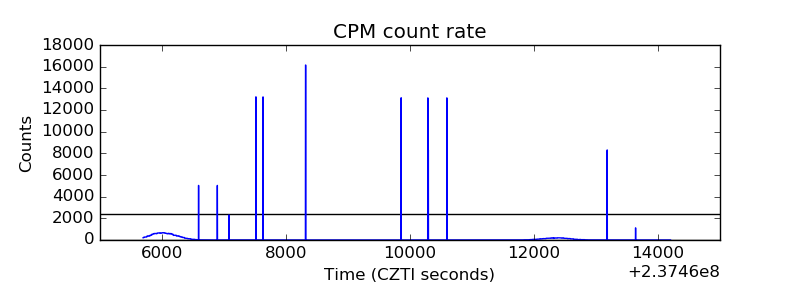 |
| CZT Counter | 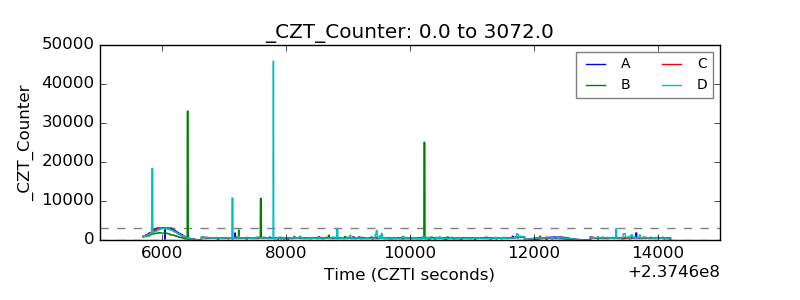 |
| +2.5 Volts monitor |  |
| +5 Volts monitor | 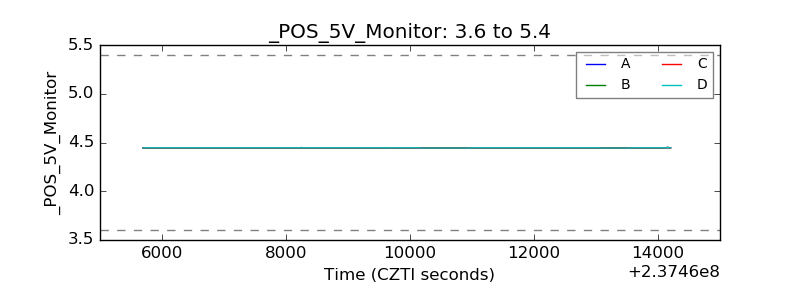 |
| _ROLL_ROT | 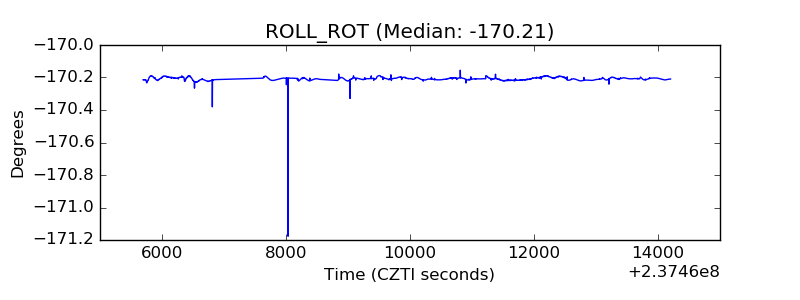 |
| _Roll_DEC | 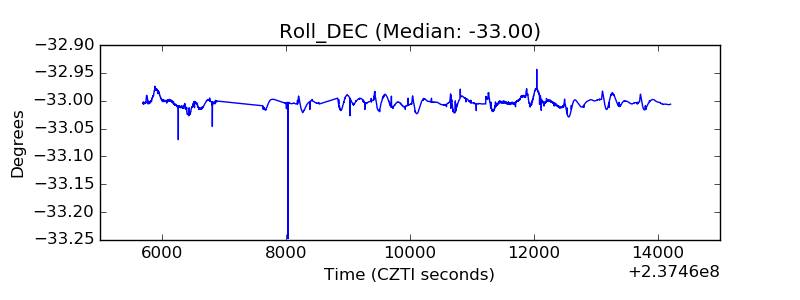 |
| _Roll_RA | 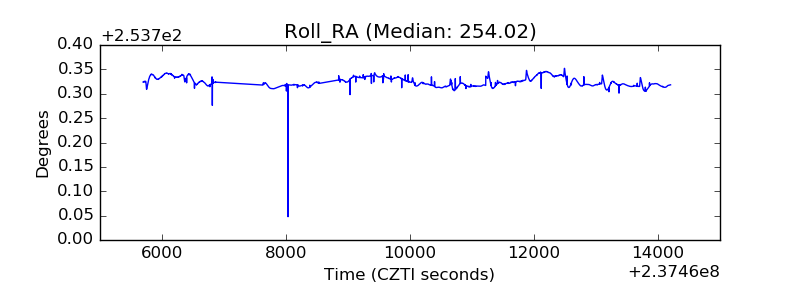 |
| Veto Counter | 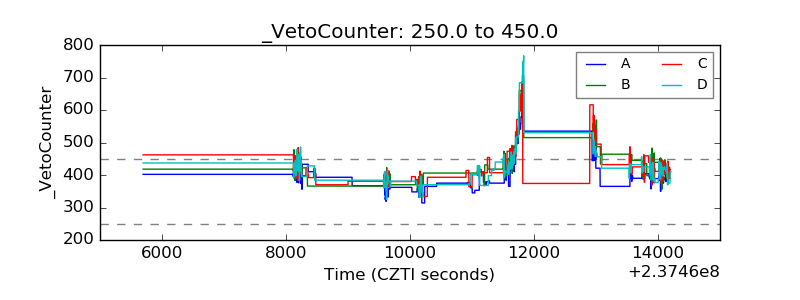 |