| Param | Original file | Final file |
|---|---|---|
| Filename | modeM0/AS1A03_077T01_9000001372_09657cztM0_level2.evt | modeM0/AS1A03_077T01_9000001372_09657cztM0_level2_quad_clean.evt |
| Size (bytes) | 569,119,680 | 128,525,760 |
| Size | 542.8 MB | 122.6 MB |
| Events in quadrant A | 4,037,002 | 837,841 |
| Events in quadrant B | 4,203,557 | 844,431 |
| Events in quadrant C | 3,849,072 | 837,450 |
| Events in quadrant D | 4,572,147 | 786,888 |
| Mode M9 | |||
|---|---|---|---|
| Quadrant | BADHDUFLAG | Total packets | Discarded packets |
| A | 0 | 18 | 1 |
| B | 0 | 18 | 4 |
| C | 0 | 18 | 0 |
| D | 0 | 18 | 1 |
| Mode SS | |||
|---|---|---|---|
| Quadrant | BADHDUFLAG | Total packets | Discarded packets |
| A | 0 | 228 | 56 |
| B | 0 | 228 | 56 |
| C | 0 | 228 | 56 |
| D | 0 | 227 | 48 |
| Mode M0 | |||
|---|---|---|---|
| Quadrant | BADHDUFLAG | Total packets | Discarded packets |
| A | 0 | 23269 | 5873 |
| B | 0 | 23867 | 6164 |
| C | 0 | 23158 | 5918 |
| D | 0 | 27119 | 7873 |
| Quadrant | Total seconds | Saturated seconds | Saturation percentage |
|---|---|---|---|
| A | 8492 | 98 | 1.154027% |
| B | 8449 | 107 | 1.266422% |
| C | 8461 | 79 | 0.933696% |
| D | 8266 | 194 | 2.346963% |
Noise dominated data is calculated using 1-second bins in cleaned event files. If a bin has >2000 counts, and if more than 50% of those come from <1% of pixels, then it is considered to be noise-dominated and hence unusable.
| Quadrant | # 1 sec bins | Bins with >0 counts | Bins with >2000 counts | High rate bins dominated by noise | Noise dominated (total time) | Noise dominated (detector-on time) | Marked lightcurve |
|---|---|---|---|---|---|---|---|
| A | 13008 | 9470 | 0 | 0 | 0.00% | 0.00% |  |
| B | 13008 | 9443 | 3 | 3 | 0.02% | 0.03% | 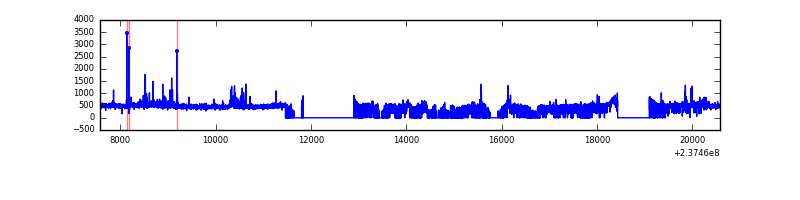 |
| C | 13008 | 9423 | 2 | 2 | 0.02% | 0.02% | 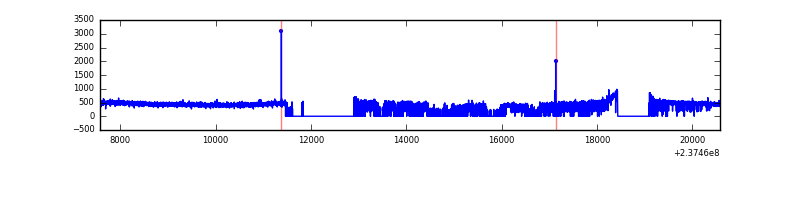 |
| D | 13008 | 9279 | 71 | 71 | 0.55% | 0.77% |  |
Top three noisy pixels from each quadrant. If the there are fewer than three noisy pixels in the level2.evt file, extra rows are filled as -1
| Pixel properties | Quadrant properties | ||||||
|---|---|---|---|---|---|---|---|
| Quadrant | DetID | PixID | Counts | Sigma | Mean | Median | Sigma |
| A | 0 | 103 | 47285 | 223.9 | 1023 | 1002 | 206.7 |
| A | 1 | 162 | 30850 | 144.39 | 1023 | 1002 | 206.7 |
| A | 0 | 226 | 12583 | 56.02 | 1023 | 1002 | 206.7 |
| B | 0 | 214 | 130072 | 669.95 | 1015 | 992 | 192.7 |
| B | 15 | 85 | 37975 | 191.95 | 1015 | 992 | 192.7 |
| B | 0 | 219 | 33436 | 168.39 | 1015 | 992 | 192.7 |
| C | 5 | 128 | 10076 | 40.29 | 982 | 987 | 225.6 |
| C | 13 | 61 | 7357 | 28.24 | 982 | 987 | 225.6 |
| C | 14 | 234 | 4695 | 16.44 | 982 | 987 | 225.6 |
| D | 1 | 52 | 525008 | 2255.08 | 956 | 934 | 232.4 |
| D | 13 | 104 | 139887 | 597.91 | 956 | 934 | 232.4 |
| D | 8 | 195 | 109354 | 466.53 | 956 | 934 | 232.4 |
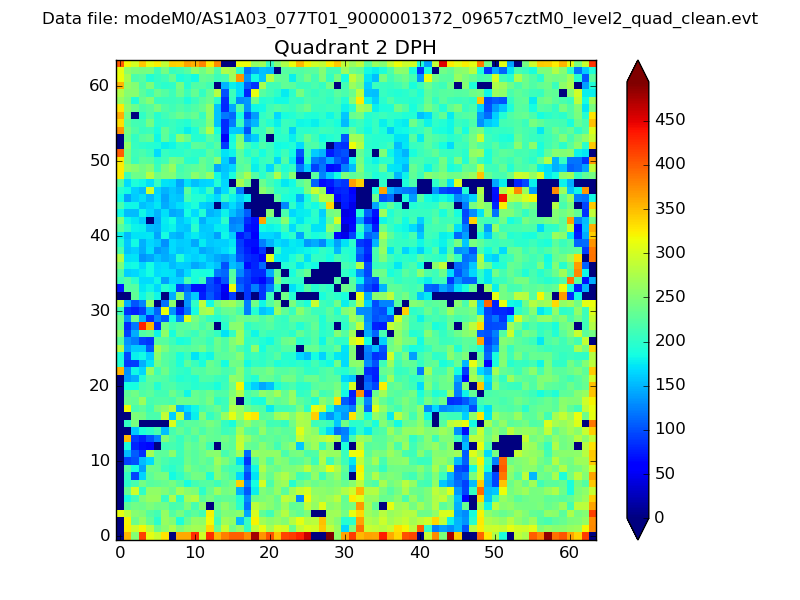
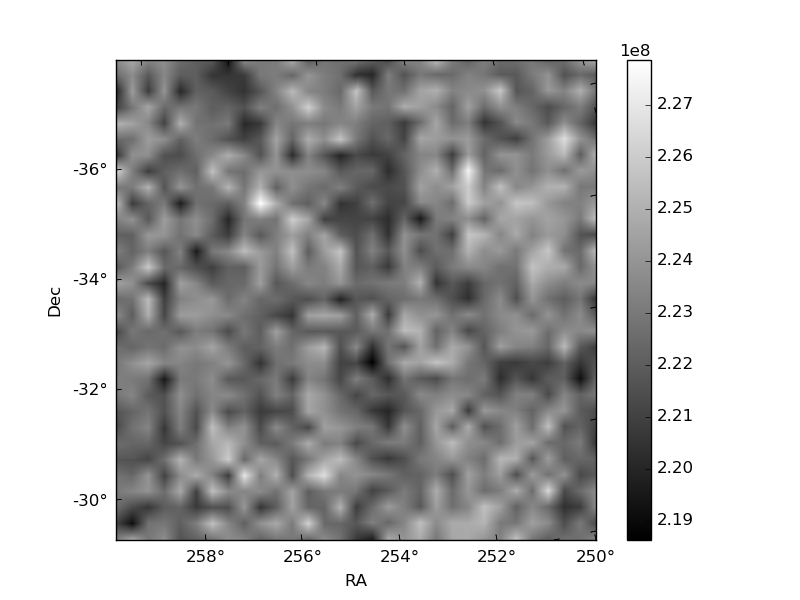
Histogram calculated using DETX and DETY for each event in the final _common_clean file
| Quadrant A | 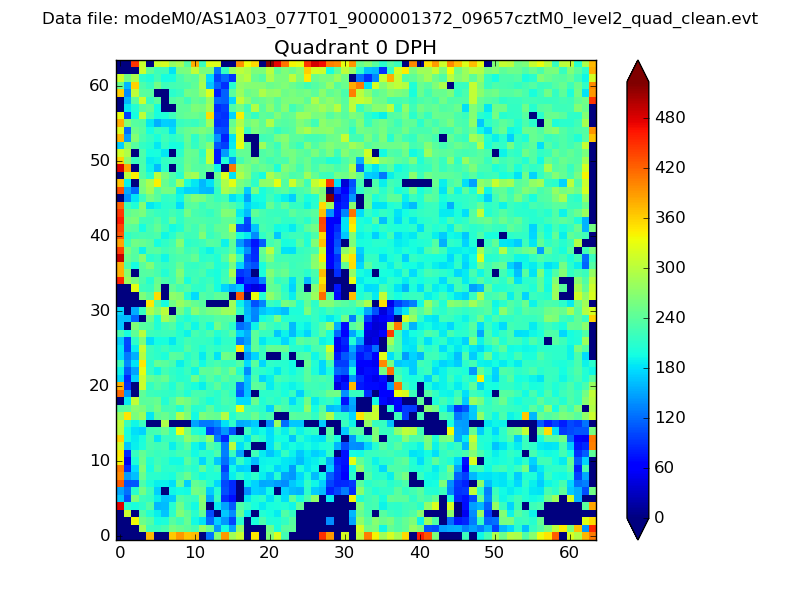 |
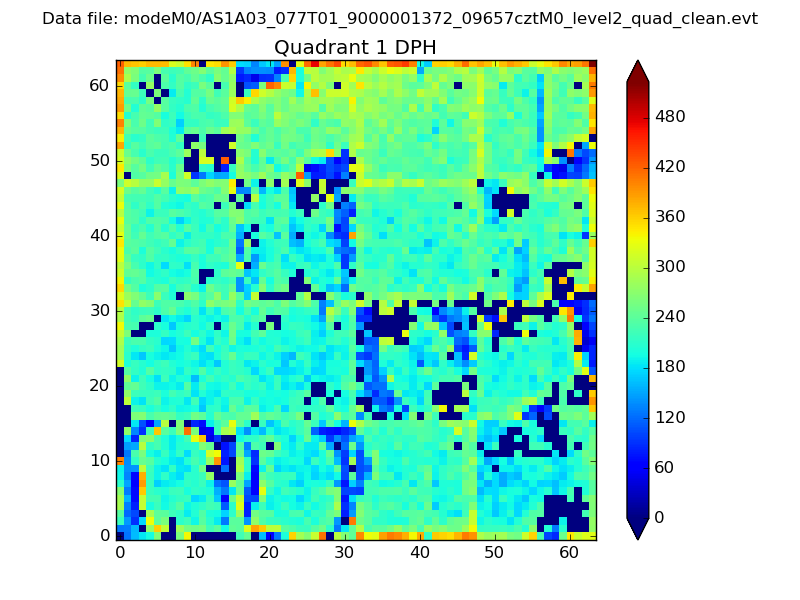 |
Quadrant B |
|---|---|---|---|
| Quadrant D | 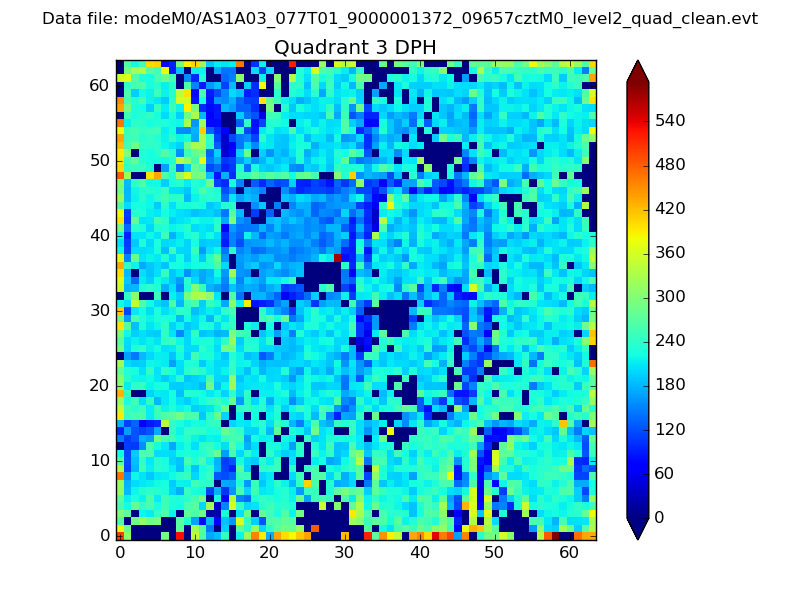 |
 |
Quadrant C |
| Plot type | Count rate plots | Images |
|---|---|---|
| Comparison with Poisson distribution Blue bars denote a histogram of data divided into 1 sec bins. Red curve is a Poisson curve with rate = median count rate of data. |
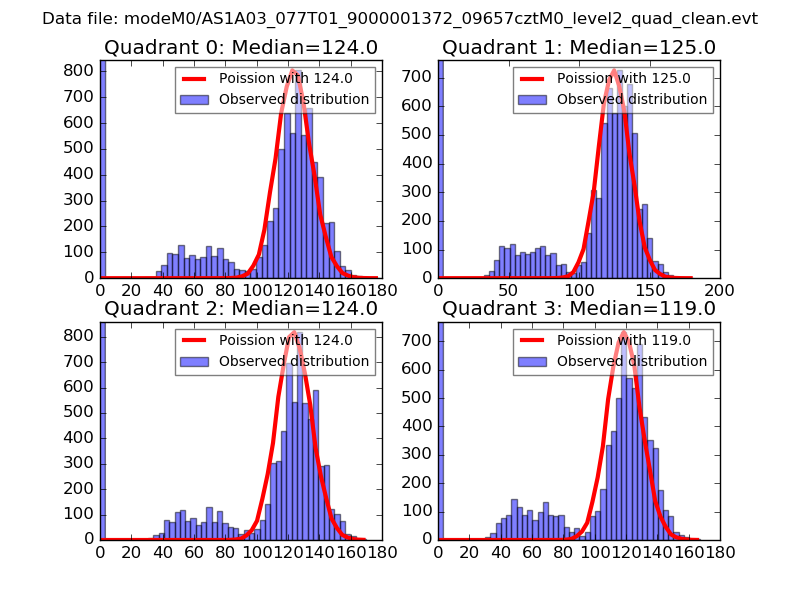 |
 |
| Quadrant-wise count rates Data is divided into 100 sec bins |
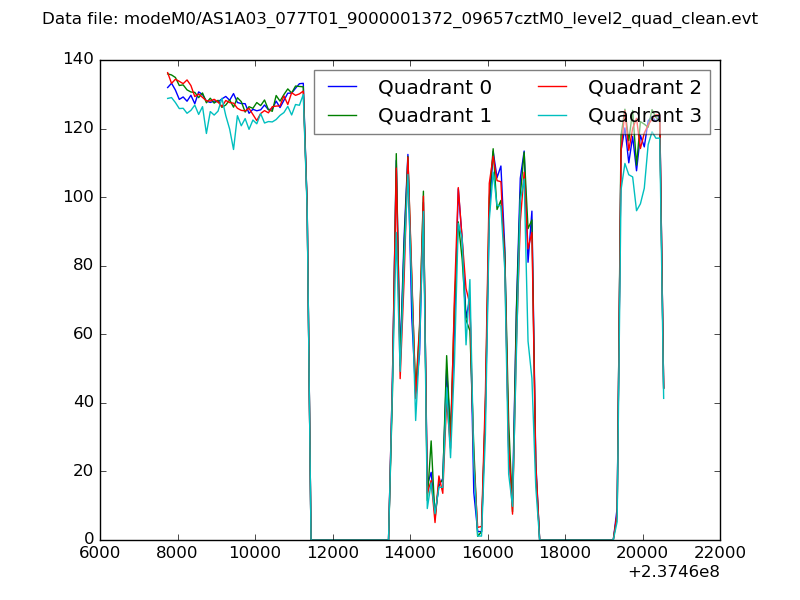 |
|
| Module-wise count rates for Quadrant A Data is divided into 100 sec bins |
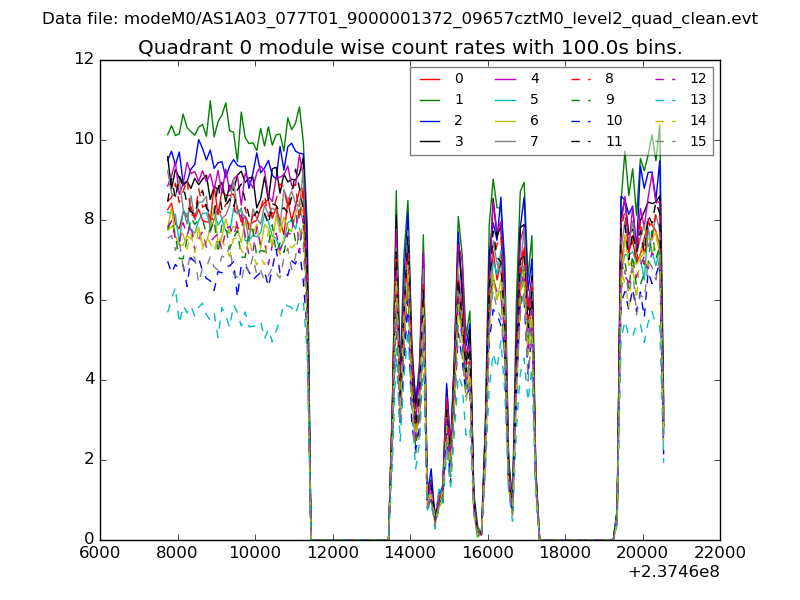 |
 |
| Module-wise count rates for Quadrant B Data is divided into 100 sec bins |
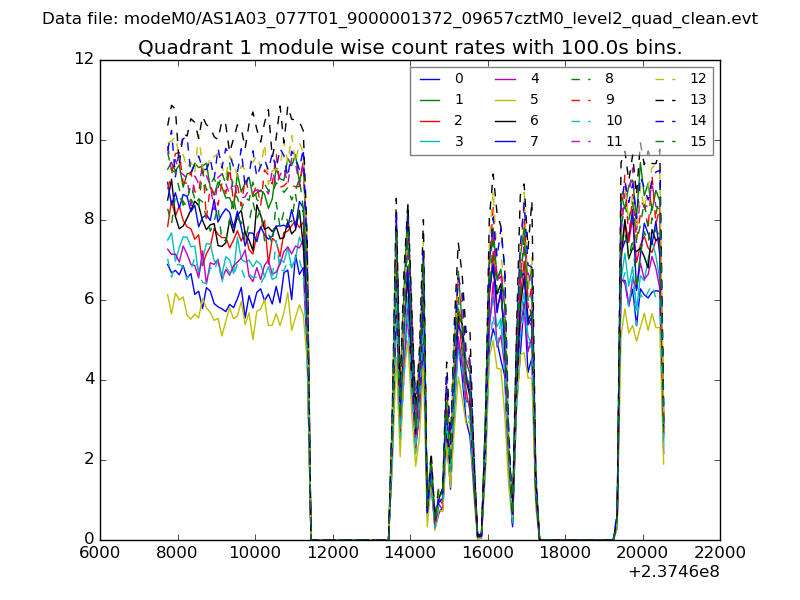 |
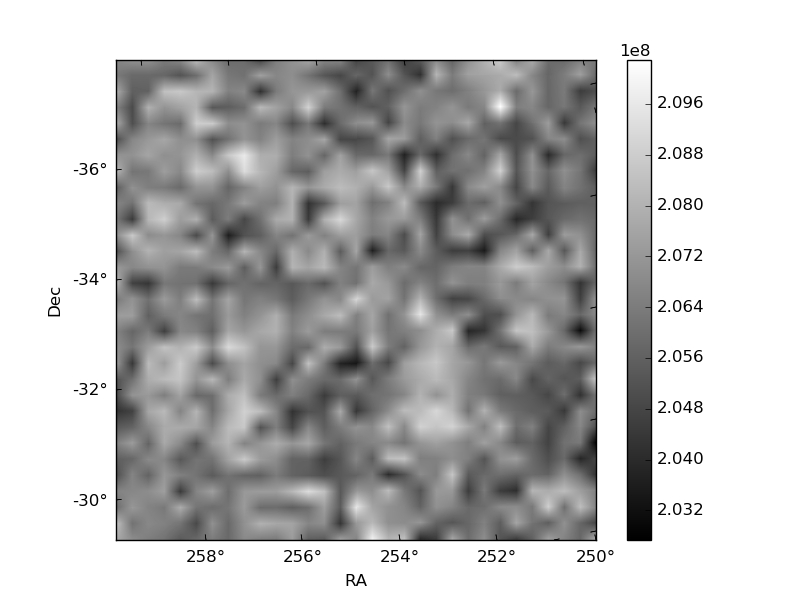 |
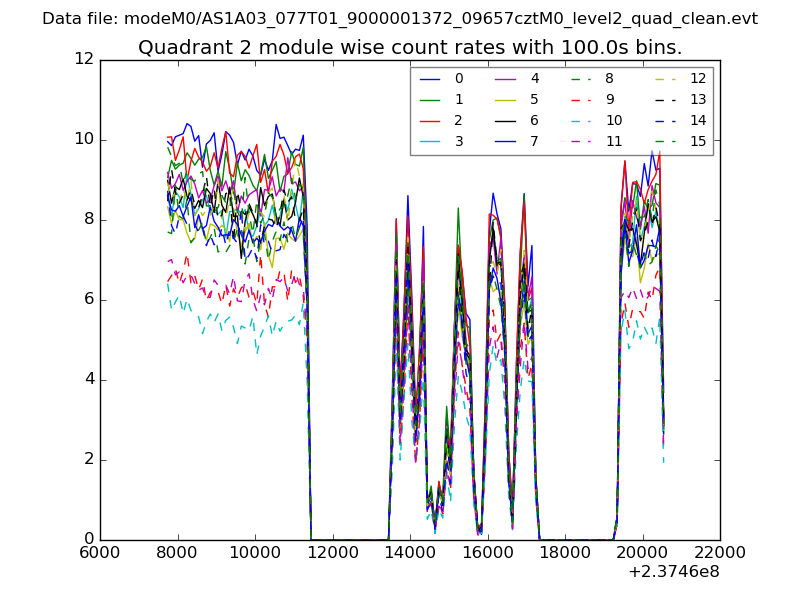
| Module-wise count rates for Quadrant C Data is divided into 100 sec bins |
 |
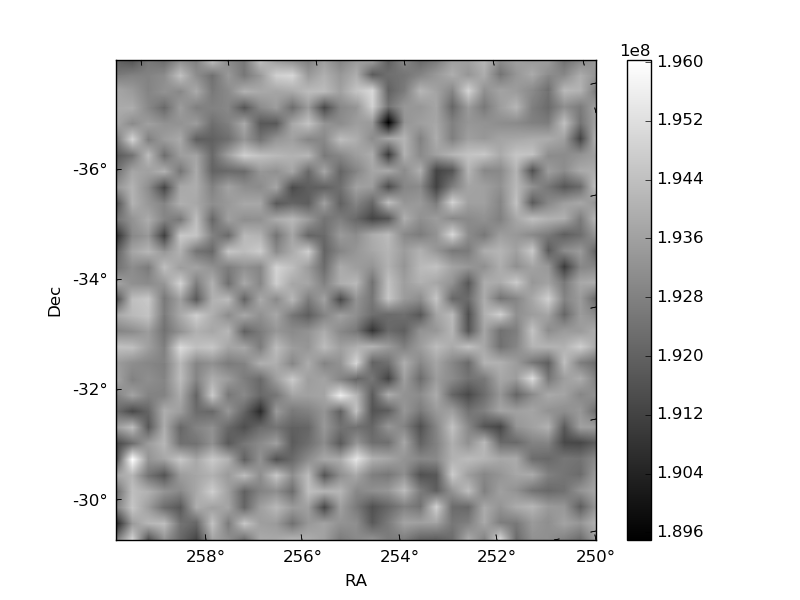 |
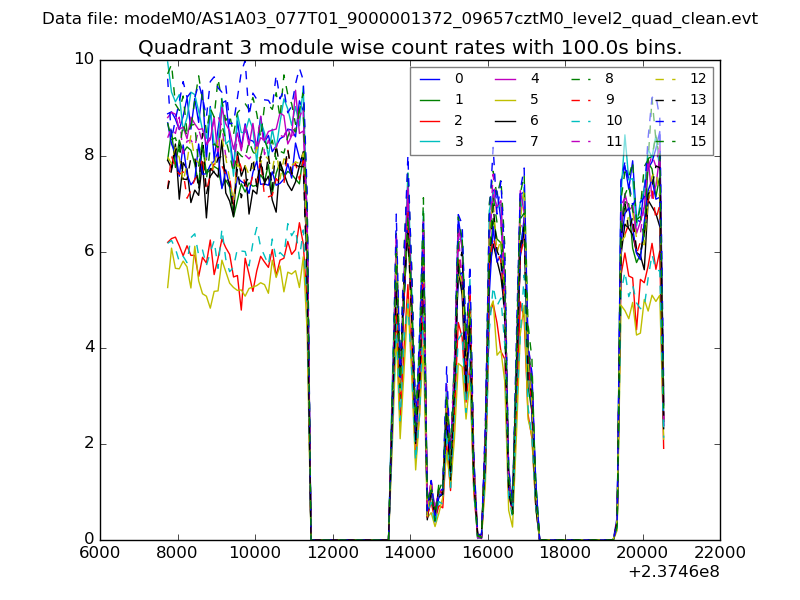
| Module-wise count rates for Quadrant D Data is divided into 100 sec bins |
 |
 |
| Parameter | Plot |
|---|---|
| CZT HV Monitor | 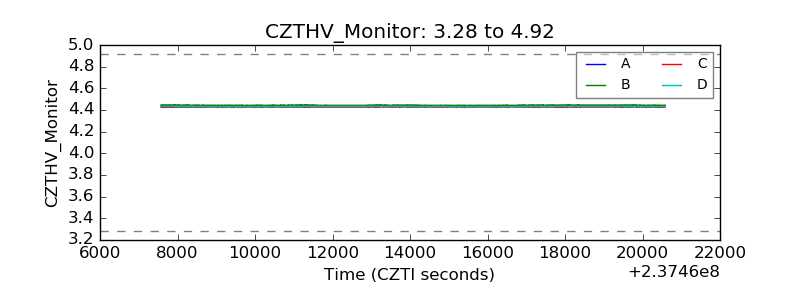 |
| D_VDD | 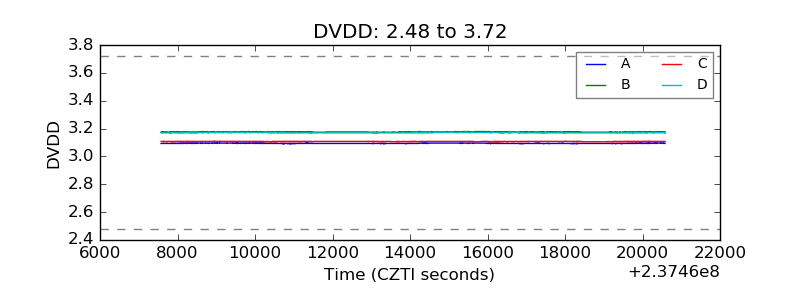 |
| Temperature 1 | 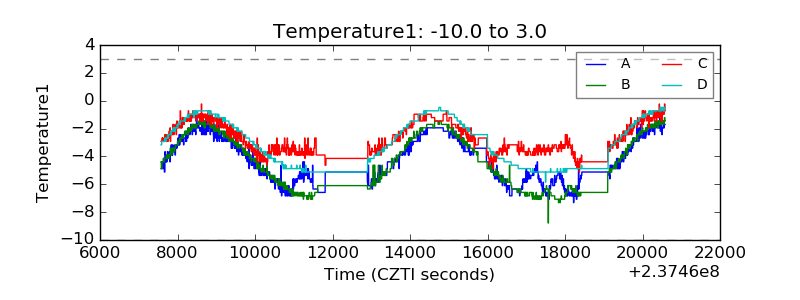 |
| Veto HV Monitor | 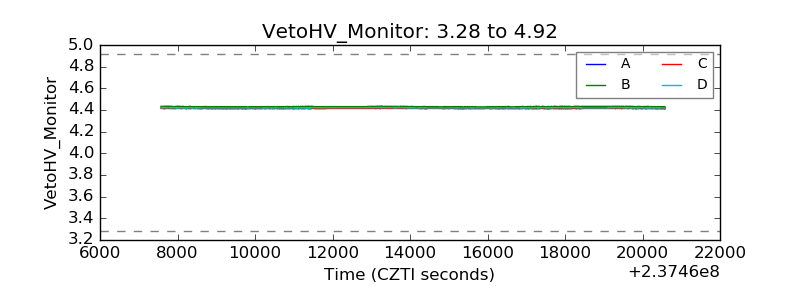 |
| Veto LLD | 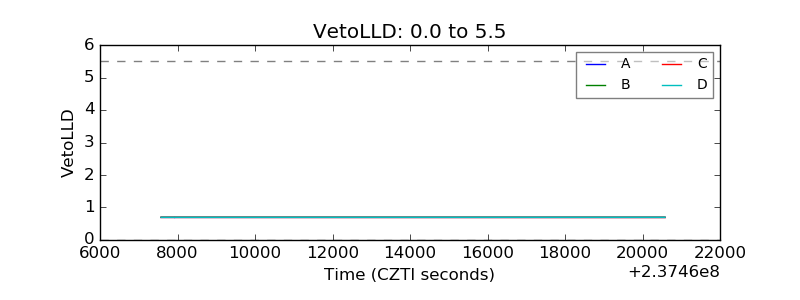 |
| Alpha Counter | 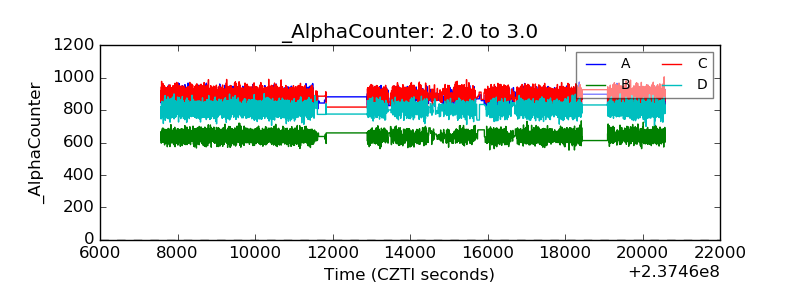 |
| _CPM_Rate | 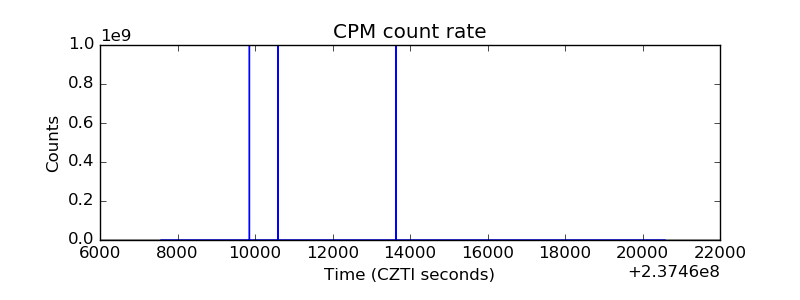 |
| CZT Counter | 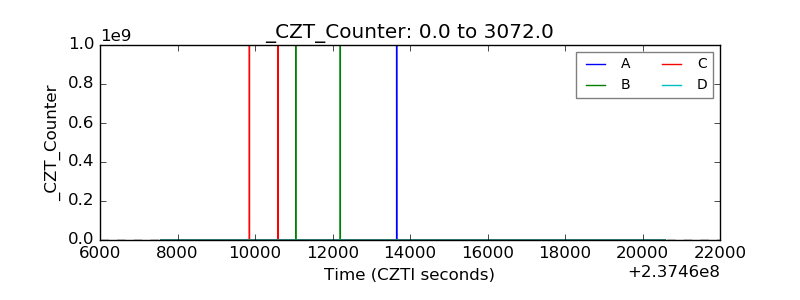 |
| +2.5 Volts monitor |  |
| +5 Volts monitor |  |
| _ROLL_ROT | 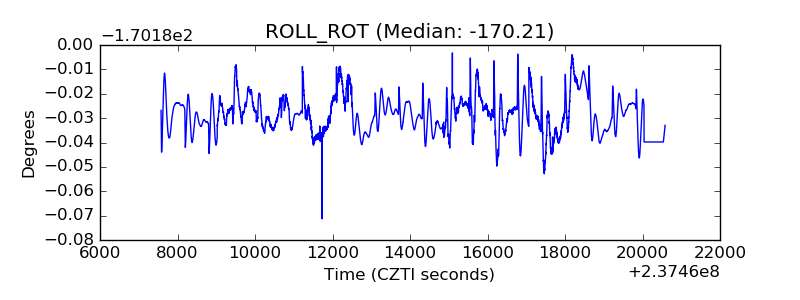 |
| _Roll_DEC | 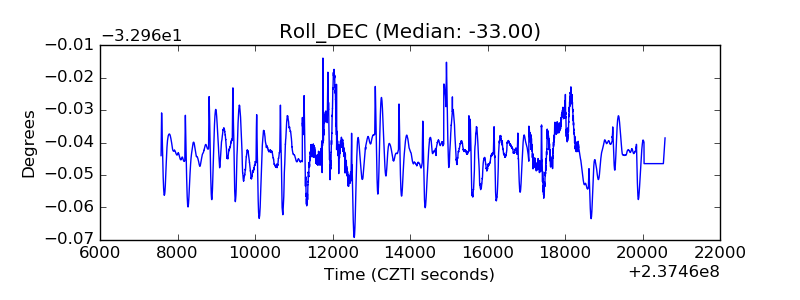 |
| _Roll_RA | 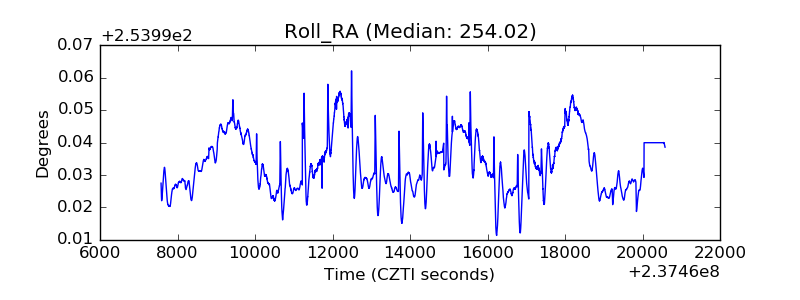 |
| Veto Counter | 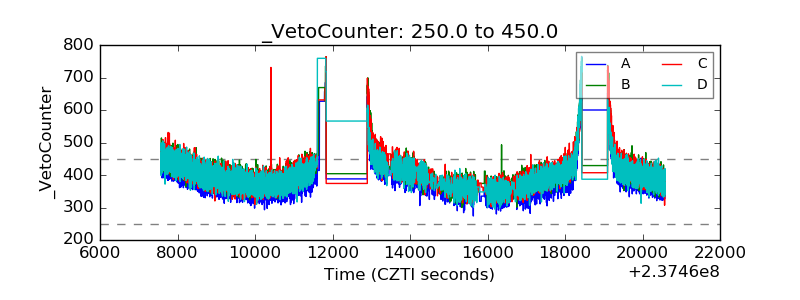 |