| Param | Original file | Final file |
|---|---|---|
| Filename | modeM0/AS1A03_077T01_9000001372_09658cztM0_level2.evt | modeM0/AS1A03_077T01_9000001372_09658cztM0_level2_quad_clean.evt |
| Size (bytes) | 228,435,840 | 40,207,680 |
| Size | 217.9 MB | 38.3 MB |
| Events in quadrant A | 1,624,027 | 255,395 |
| Events in quadrant B | 1,731,846 | 253,218 |
| Events in quadrant C | 1,593,565 | 255,030 |
| Events in quadrant D | 1,740,118 | 217,491 |
| Mode M9 | |||
|---|---|---|---|
| Quadrant | BADHDUFLAG | Total packets | Discarded packets |
| A | 0 | 3 | 0 |
| B | 0 | 3 | 0 |
| C | 0 | 3 | 0 |
| D | 0 | 3 | 1 |
| Mode SS | |||
|---|---|---|---|
| Quadrant | BADHDUFLAG | Total packets | Discarded packets |
| A | 0 | 144 | 78 |
| B | 0 | 143 | 75 |
| C | 0 | 142 | 70 |
| D | 0 | 143 | 72 |
| Mode M0 | |||
|---|---|---|---|
| Quadrant | BADHDUFLAG | Total packets | Discarded packets |
| A | 0 | 14732 | 7707 |
| B | 0 | 15309 | 8088 |
| C | 0 | 14676 | 7679 |
| D | 0 | 17533 | 10348 |
| Quadrant | Total seconds | Saturated seconds | Saturation percentage |
|---|---|---|---|
| A | 3360 | 70 | 2.083333% |
| B | 3355 | 82 | 2.444113% |
| C | 3368 | 21 | 0.623515% |
| D | 3102 | 42 | 1.353965% |
Noise dominated data is calculated using 1-second bins in cleaned event files. If a bin has >2000 counts, and if more than 50% of those come from <1% of pixels, then it is considered to be noise-dominated and hence unusable.
| Quadrant | # 1 sec bins | Bins with >0 counts | Bins with >2000 counts | High rate bins dominated by noise | Noise dominated (total time) | Noise dominated (detector-on time) | Marked lightcurve |
|---|---|---|---|---|---|---|---|
| A | 7478 | 4530 | 0 | 0 | 0.00% | 0.00% | 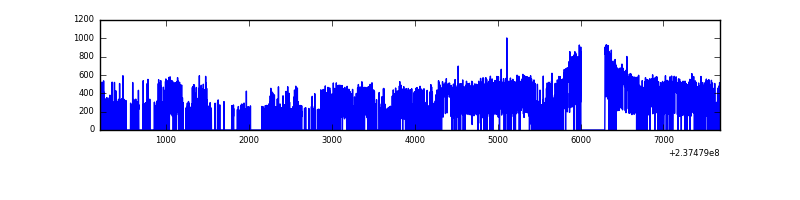 |
| B | 7460 | 4511 | 3 | 3 | 0.04% | 0.07% | 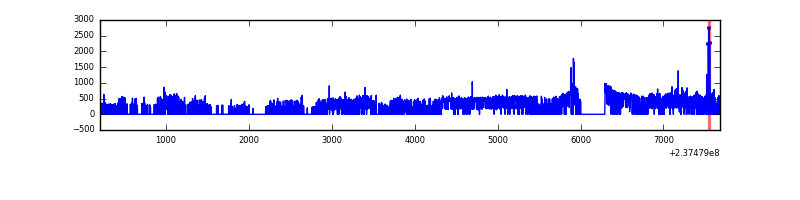 |
| C | 7451 | 4506 | 0 | 0 | 0.00% | 0.00% | 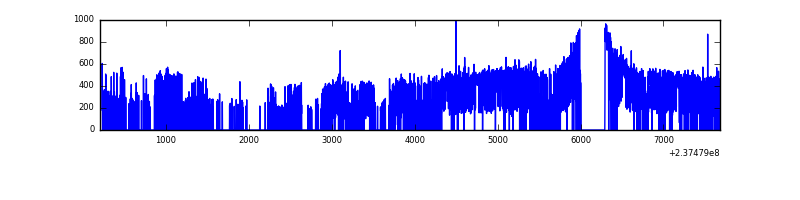 |
| D | 7466 | 4151 | 1 | 1 | 0.01% | 0.02% | 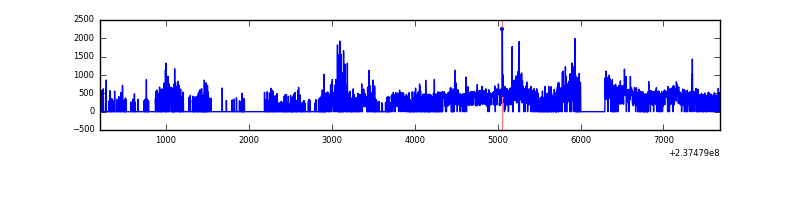 |
Top three noisy pixels from each quadrant. If the there are fewer than three noisy pixels in the level2.evt file, extra rows are filled as -1
| Pixel properties | Quadrant properties | ||||||
|---|---|---|---|---|---|---|---|
| Quadrant | DetID | PixID | Counts | Sigma | Mean | Median | Sigma |
| A | 1 | 162 | 5847 | 61.95 | 418 | 409 | 87.8 |
| A | 0 | 226 | 3894 | 39.7 | 418 | 409 | 87.8 |
| A | 12 | 194 | 3629 | 36.68 | 418 | 409 | 87.8 |
| B | 0 | 214 | 41197 | 494.87 | 417 | 408 | 82.4 |
| B | 0 | 85 | 19260 | 228.72 | 417 | 408 | 82.4 |
| B | 0 | 219 | 14021 | 165.16 | 417 | 408 | 82.4 |
| C | 13 | 61 | 3078 | 27.76 | 408 | 409 | 96.2 |
| C | 14 | 234 | 1666 | 13.07 | 408 | 409 | 96.2 |
| C | 3 | 202 | 1001 | 6.16 | 408 | 409 | 96.2 |
| D | 1 | 52 | 117651 | 1273.4 | 373 | 363 | 92.1 |
| D | 8 | 195 | 95904 | 1037.29 | 373 | 363 | 92.1 |
| D | 7 | 71 | 51811 | 558.57 | 373 | 363 | 92.1 |
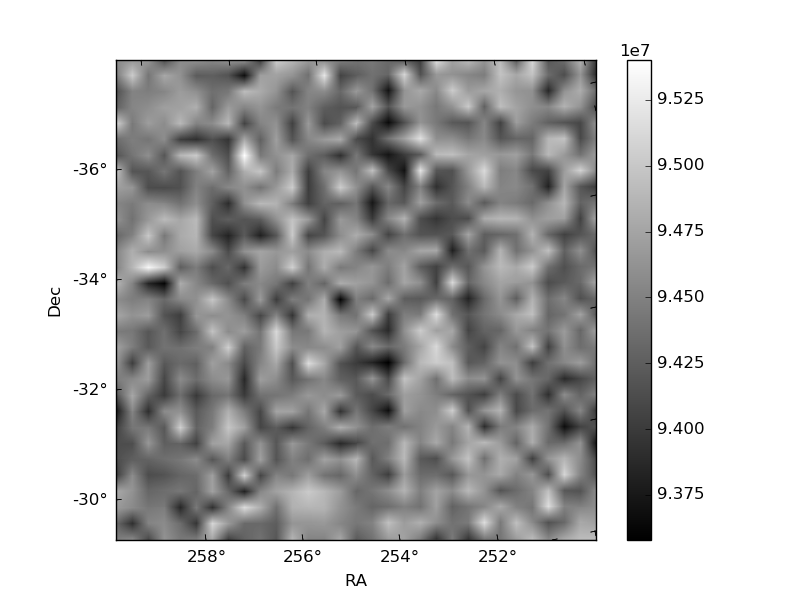
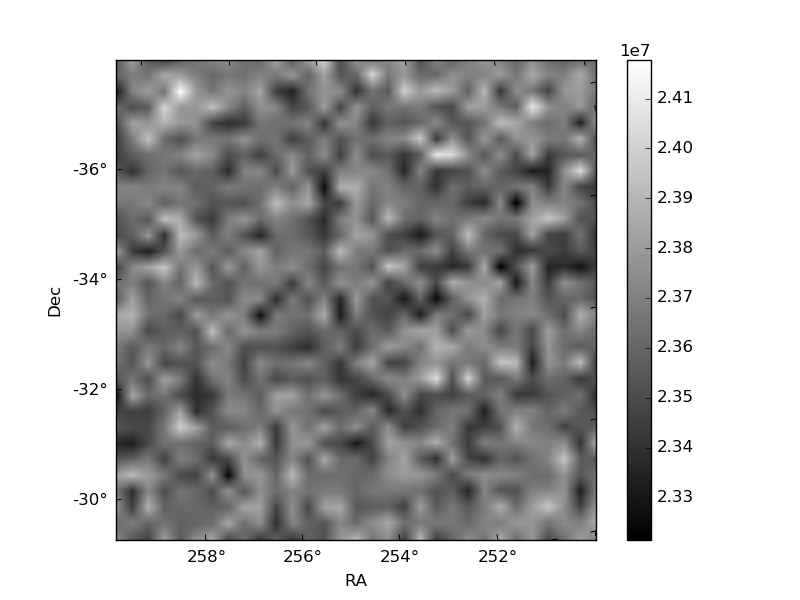
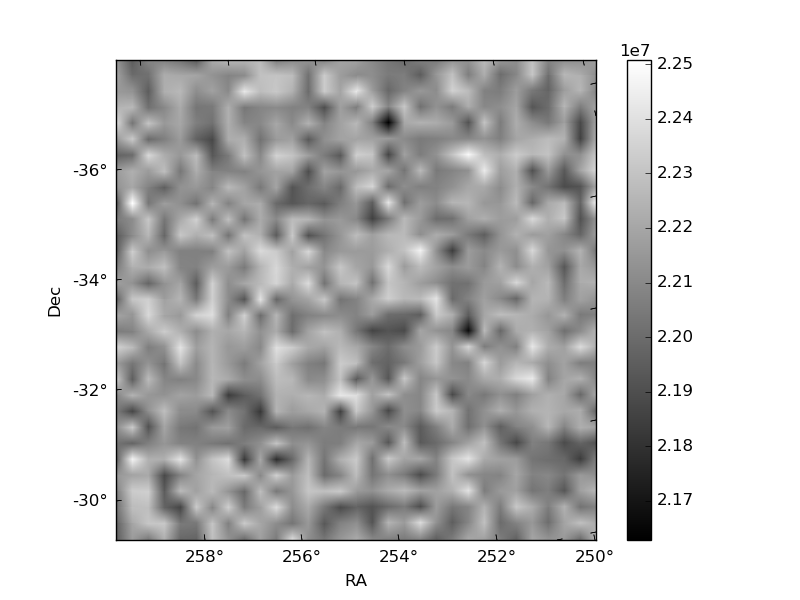
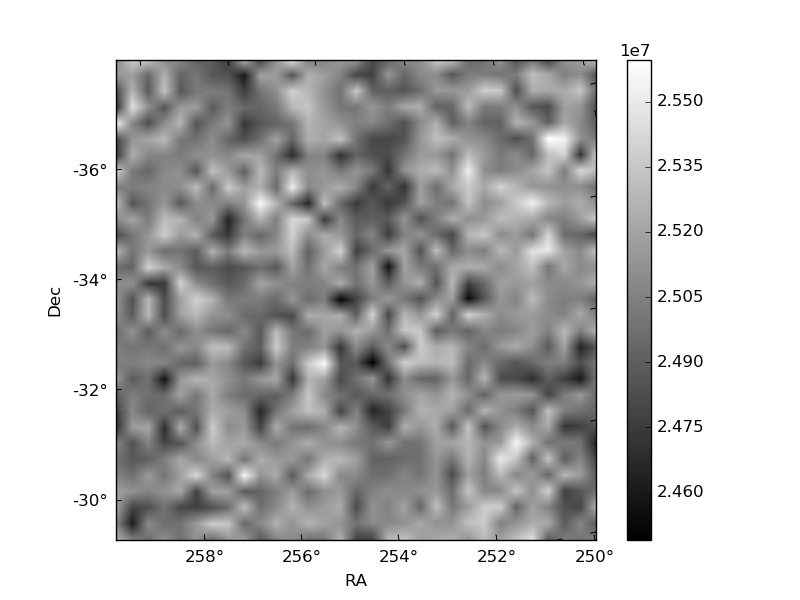
Histogram calculated using DETX and DETY for each event in the final _common_clean file
| Quadrant A | 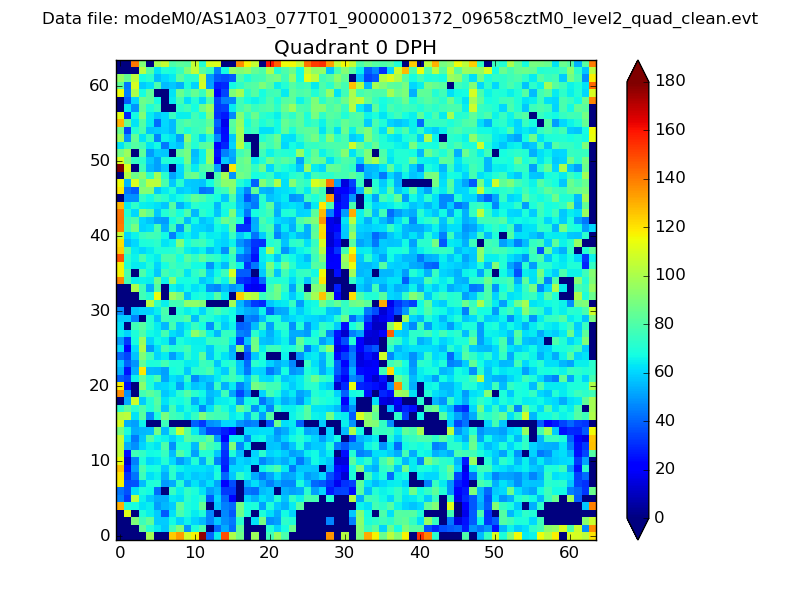 |
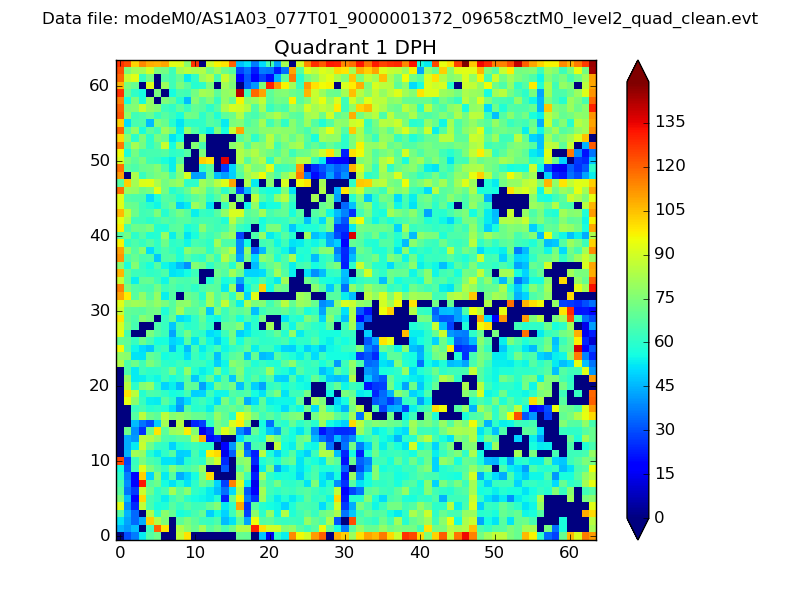 |
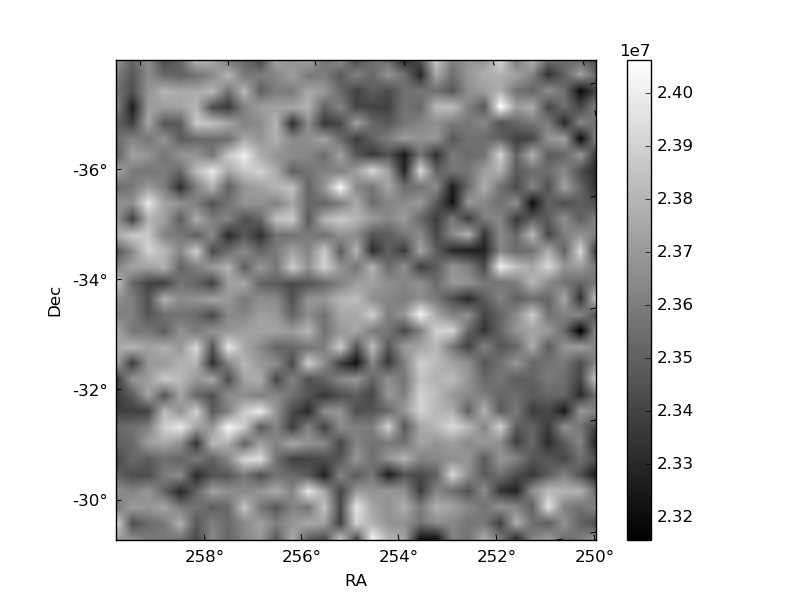
Quadrant B |
|---|---|---|---|
| Quadrant D | 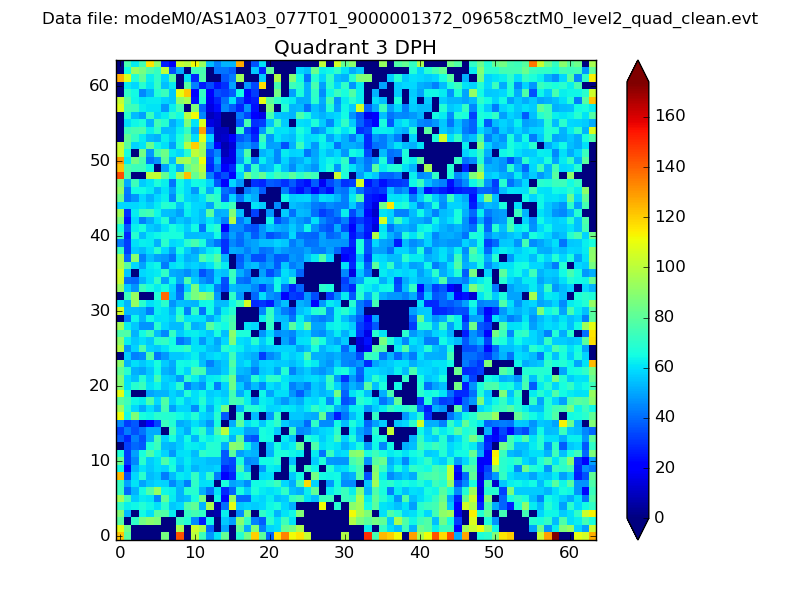 |
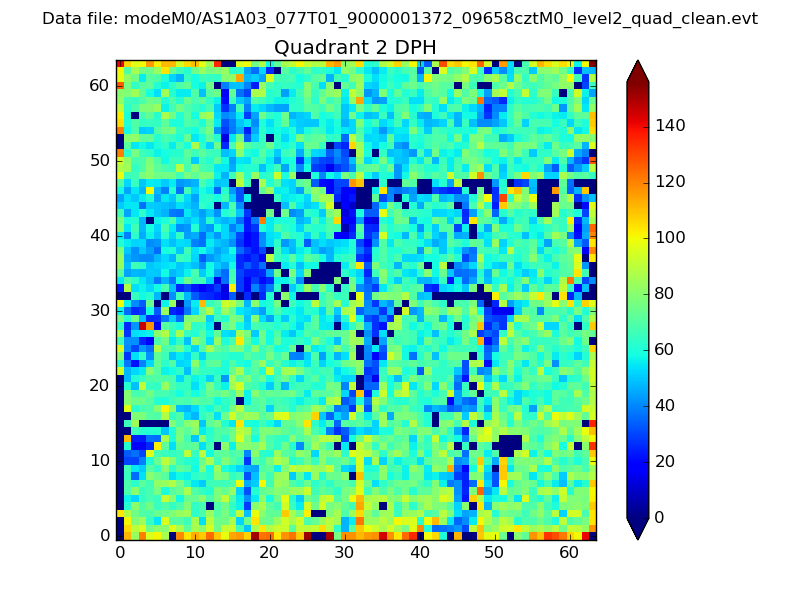 |
Quadrant C |
| Plot type | Count rate plots | Images |
|---|---|---|
| Comparison with Poisson distribution Blue bars denote a histogram of data divided into 1 sec bins. Red curve is a Poisson curve with rate = median count rate of data. |
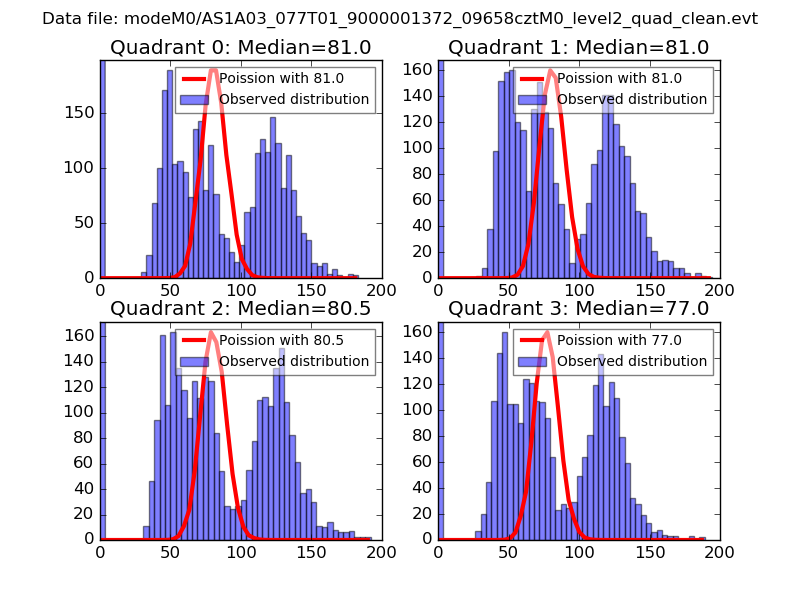 |
 |
| Quadrant-wise count rates Data is divided into 100 sec bins |
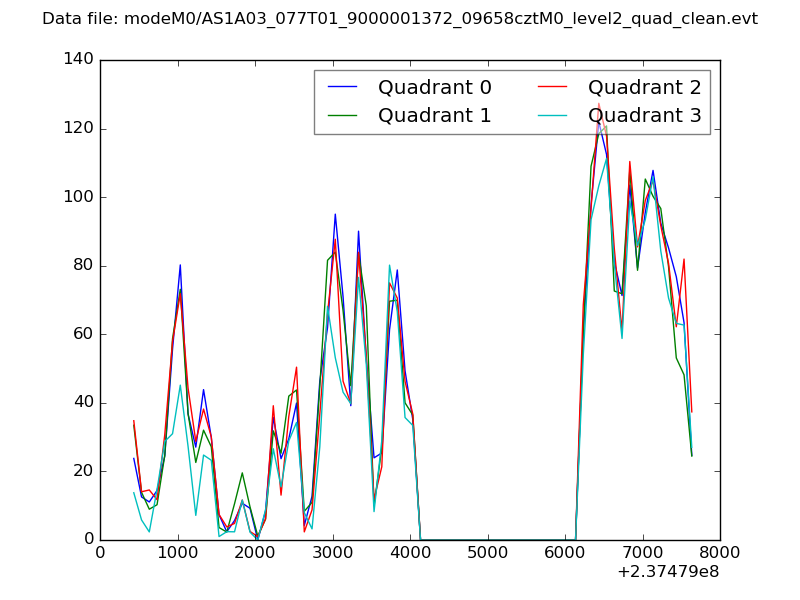 |
|
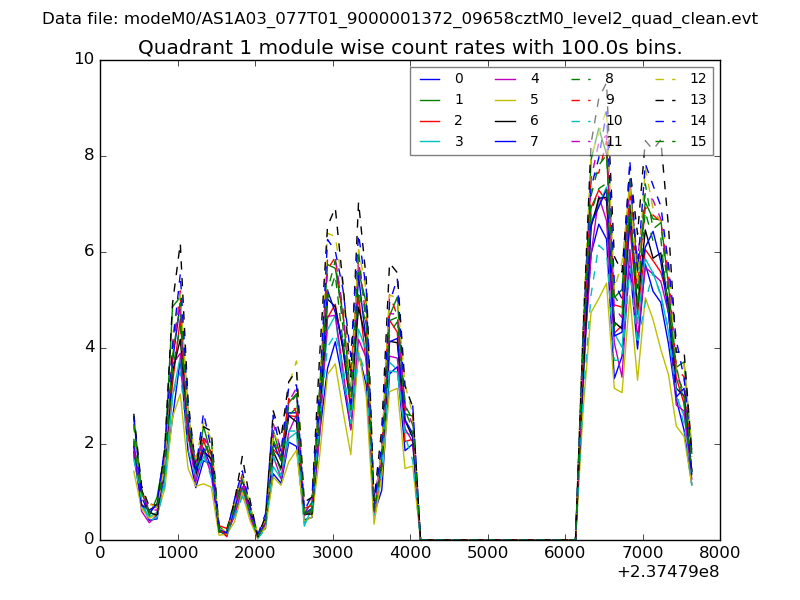
| Module-wise count rates for Quadrant A Data is divided into 100 sec bins |
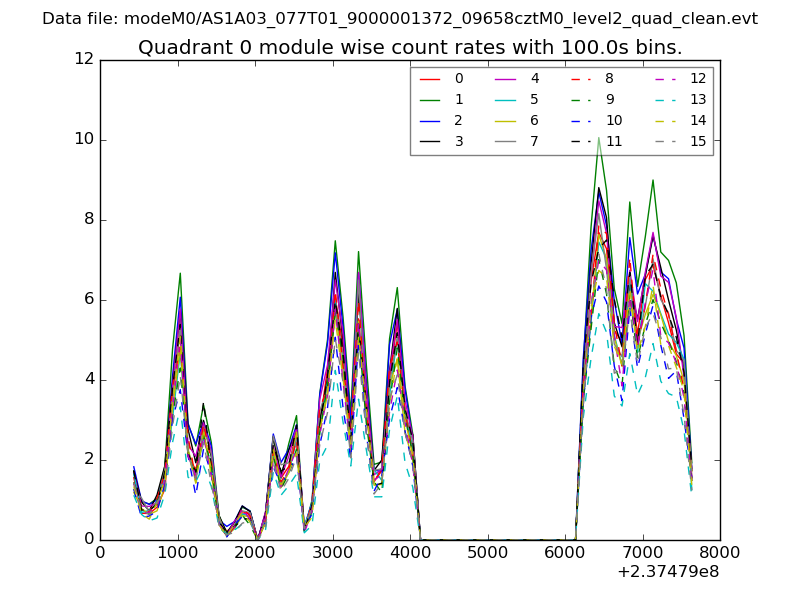 |
 |
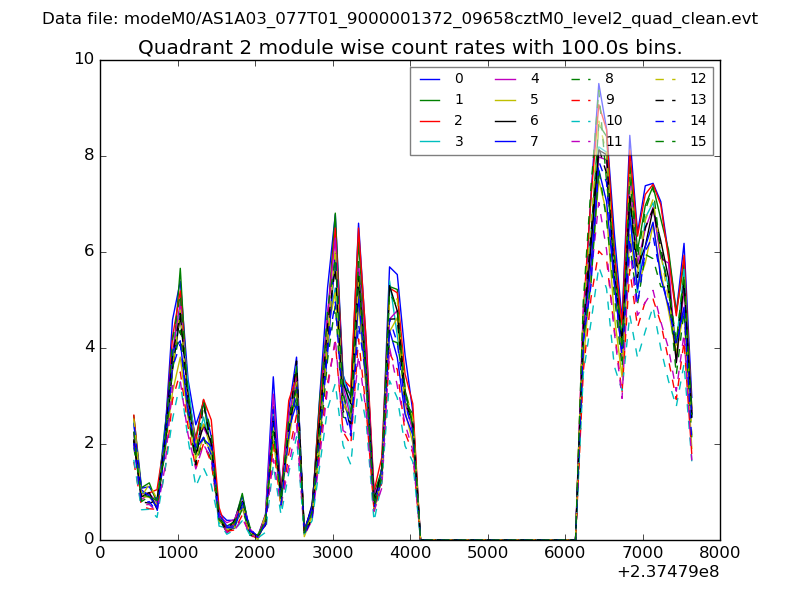
| Module-wise count rates for Quadrant B Data is divided into 100 sec bins |
 |
 |
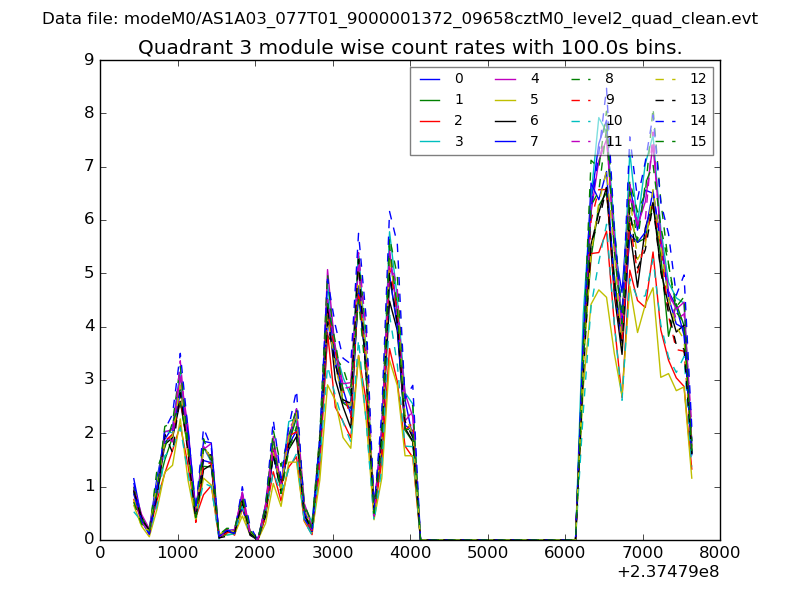
| Module-wise count rates for Quadrant C Data is divided into 100 sec bins |
 |
 |
| Module-wise count rates for Quadrant D Data is divided into 100 sec bins |
 |
 |
| Parameter | Plot |
|---|---|
| CZT HV Monitor | 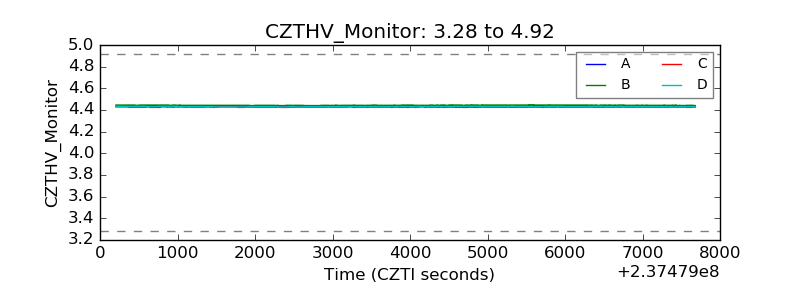 |
| D_VDD | 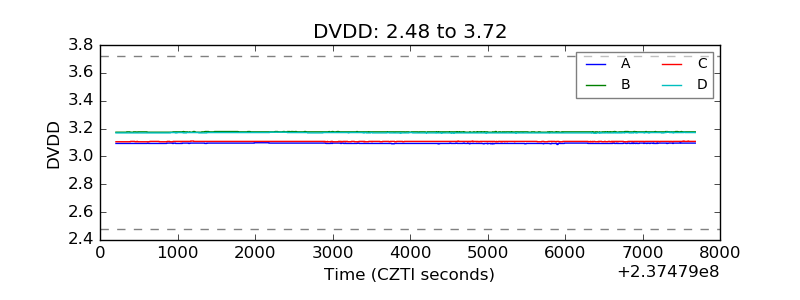 |
| Temperature 1 | 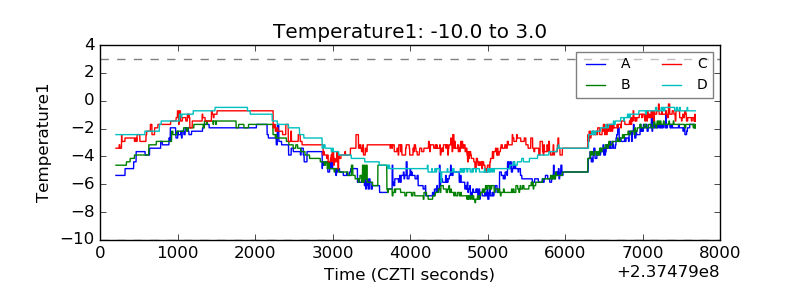 |
| Veto HV Monitor | 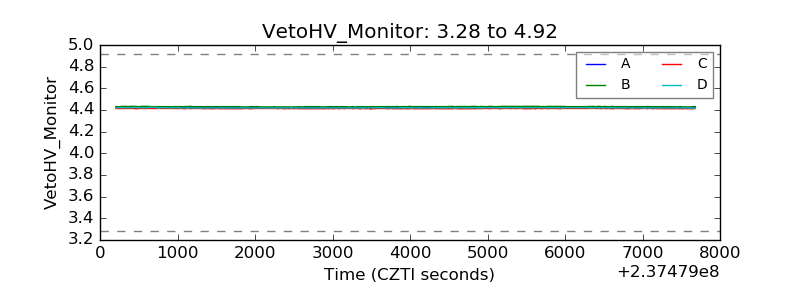 |
| Veto LLD | 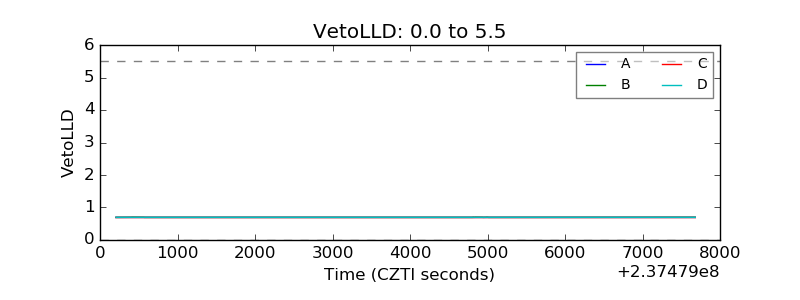 |
| Alpha Counter | 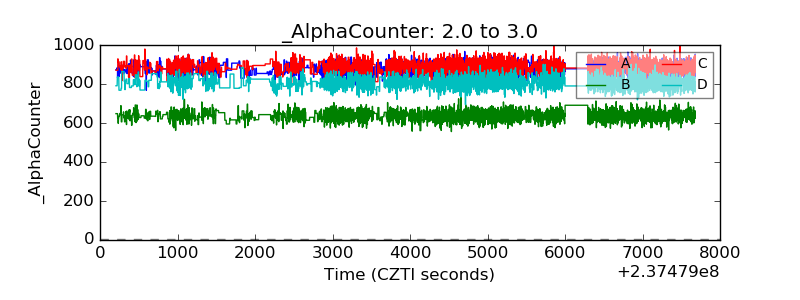 |
| _CPM_Rate | 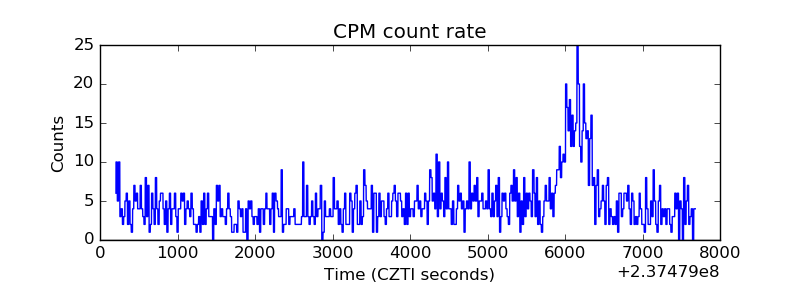 |
| CZT Counter | 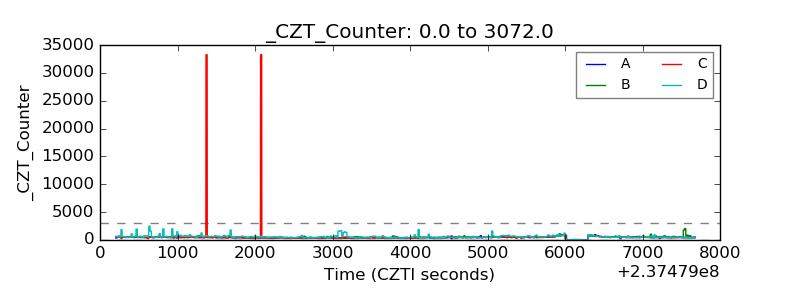 |
| +2.5 Volts monitor |  |
| +5 Volts monitor |  |
| _ROLL_ROT | 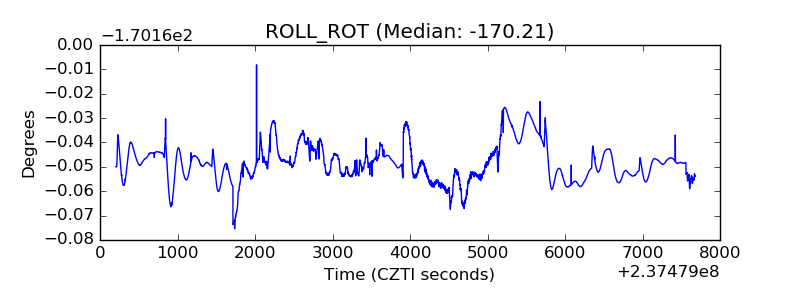 |
| _Roll_DEC | 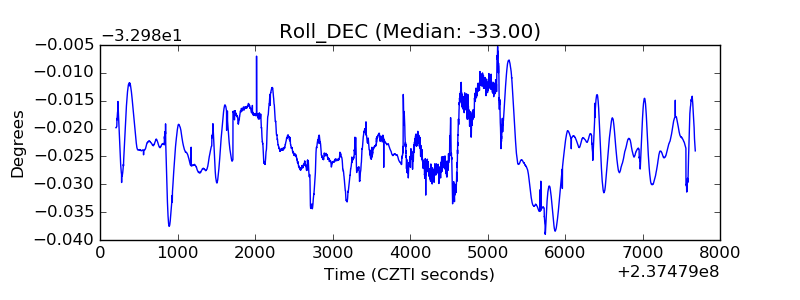 |
| _Roll_RA | 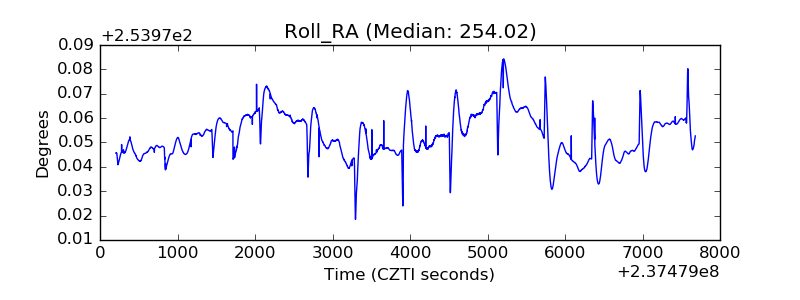 |
| Veto Counter | 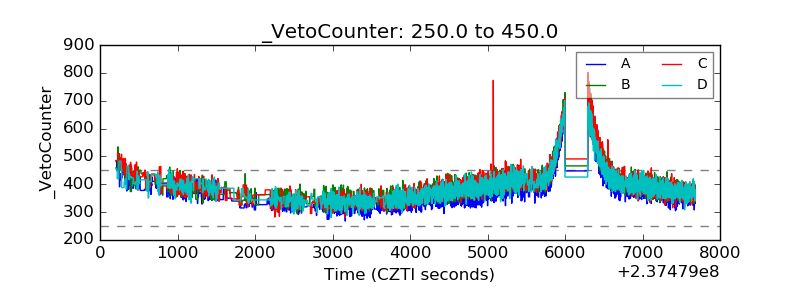 |