| Param | Original file | Final file |
|---|---|---|
| Filename | modeM0/AS1A03_077T01_9000001372_09662cztM0_level2.evt | modeM0/AS1A03_077T01_9000001372_09662cztM0_level2_quad_clean.evt |
| Size (bytes) | 8,026,560 | 2,407,680 |
| Size | 7.7 MB | 2.3 MB |
| Events in quadrant A | 54,036 | 13,550 |
| Events in quadrant B | 55,325 | 12,734 |
| Events in quadrant C | 70,032 | 18,476 |
| Events in quadrant D | 52,150 | 11,124 |
| Mode M9 | |||
|---|---|---|---|
| Quadrant | BADHDUFLAG | Total packets | Discarded packets |
| A | 0 | 5 | 5 |
| B | 0 | 4 | 3 |
| C | 0 | 5 | 5 |
| D | 0 | 6 | 5 |
| Mode SS | |||
|---|---|---|---|
| Quadrant | BADHDUFLAG | Total packets | Discarded packets |
| A | 0 | 126 | 122 |
| B | 0 | 125 | 123 |
| C | 0 | 127 | 124 |
| D | 0 | 126 | 124 |
| Mode M0 | |||
|---|---|---|---|
| Quadrant | BADHDUFLAG | Total packets | Discarded packets |
| A | 0 | 12654 | 12433 |
| B | 0 | 13279 | 13058 |
| C | 0 | 12477 | 12184 |
| D | 0 | 15299 | 15090 |
| Quadrant | Total seconds | Saturated seconds | Saturation percentage |
|---|---|---|---|
| A | 108 | 0 | 0.000000% |
| B | 99 | 0 | 0.000000% |
| C | 145 | 0 | 0.000000% |
| D | 97 | 1 | 1.030928% |
Noise dominated data is calculated using 1-second bins in cleaned event files. If a bin has >2000 counts, and if more than 50% of those come from <1% of pixels, then it is considered to be noise-dominated and hence unusable.
| Quadrant | # 1 sec bins | Bins with >0 counts | Bins with >2000 counts | High rate bins dominated by noise | Noise dominated (total time) | Noise dominated (detector-on time) | Marked lightcurve |
|---|---|---|---|---|---|---|---|
| A | 6709 | 208 | 0 | 0 | 0.00% | 0.00% | 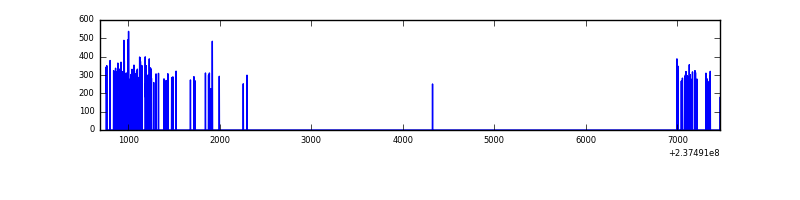 |
| B | 6681 | 187 | 0 | 0 | 0.00% | 0.00% | 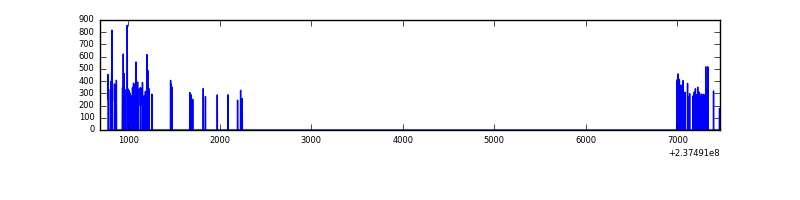 |
| C | 6738 | 269 | 0 | 0 | 0.00% | 0.00% | 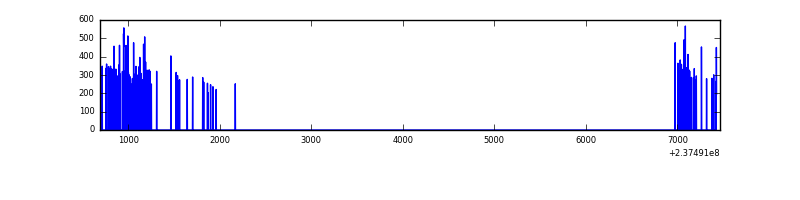 |
| D | 6633 | 185 | 0 | 0 | 0.00% | 0.00% | 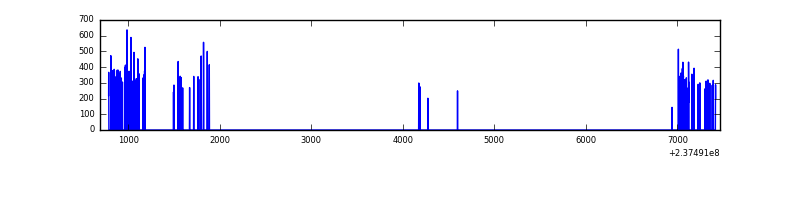 |
Top three noisy pixels from each quadrant. If the there are fewer than three noisy pixels in the level2.evt file, extra rows are filled as -1
| Pixel properties | Quadrant properties | ||||||
|---|---|---|---|---|---|---|---|
| Quadrant | DetID | PixID | Counts | Sigma | Mean | Median | Sigma |
| A | 7 | 223 | 1853 | 396.49 | 13 | 13 | 4.6 |
| A | 8 | 15 | 197 | 39.65 | 13 | 13 | 4.6 |
| A | 0 | 226 | 137 | 26.72 | 13 | 13 | 4.6 |
| B | 0 | 214 | 3491 | 827.75 | 12 | 12 | 4.2 |
| B | 0 | 85 | 1310 | 308.83 | 12 | 12 | 4.2 |
| B | 4 | 173 | 553 | 128.72 | 12 | 12 | 4.2 |
| C | 13 | 61 | 149 | 22.07 | 17 | 17 | 6.0 |
| C | 9 | 68 | 118 | 16.88 | 17 | 17 | 6.0 |
| C | 14 | 67 | 55 | 6.35 | 17 | 17 | 6.0 |
| D | 8 | 195 | 5830 | 1289.66 | 11 | 11 | 4.5 |
| D | 1 | 52 | 1827 | 402.48 | 11 | 11 | 4.5 |
| D | 2 | 234 | 325 | 69.59 | 11 | 11 | 4.5 |
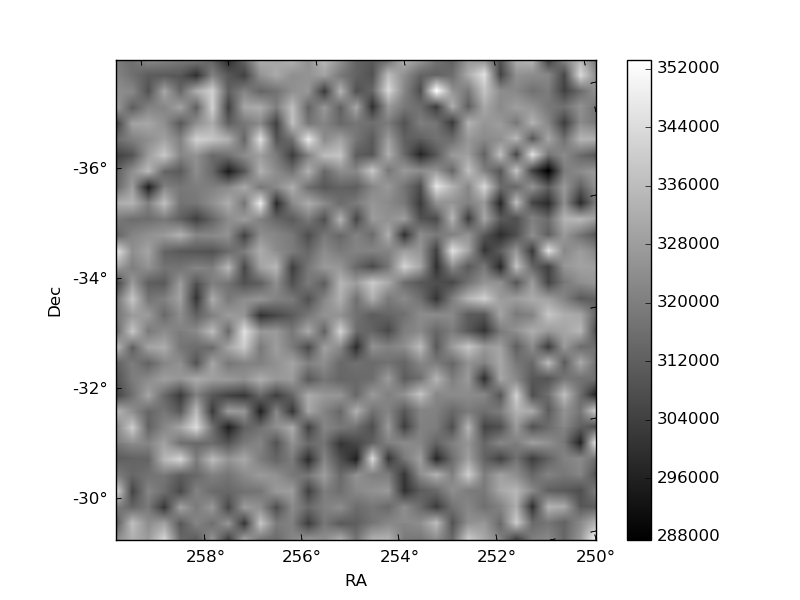
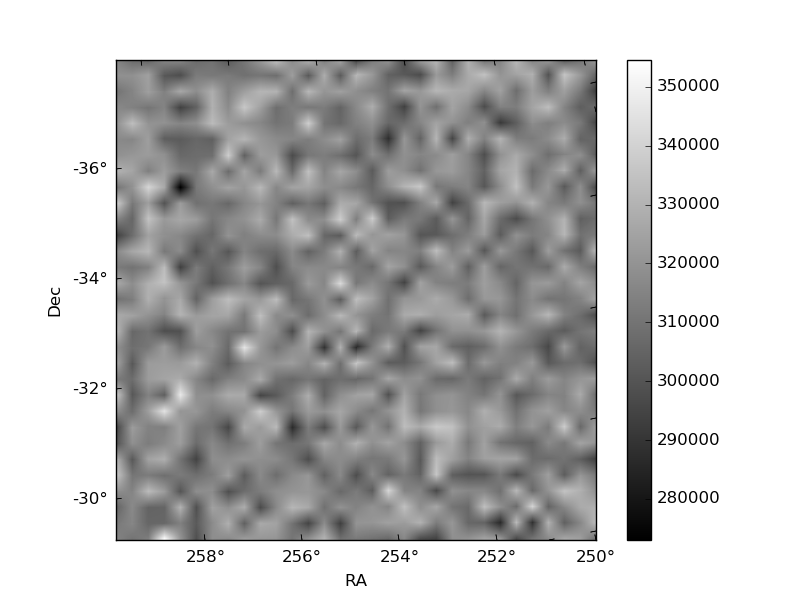
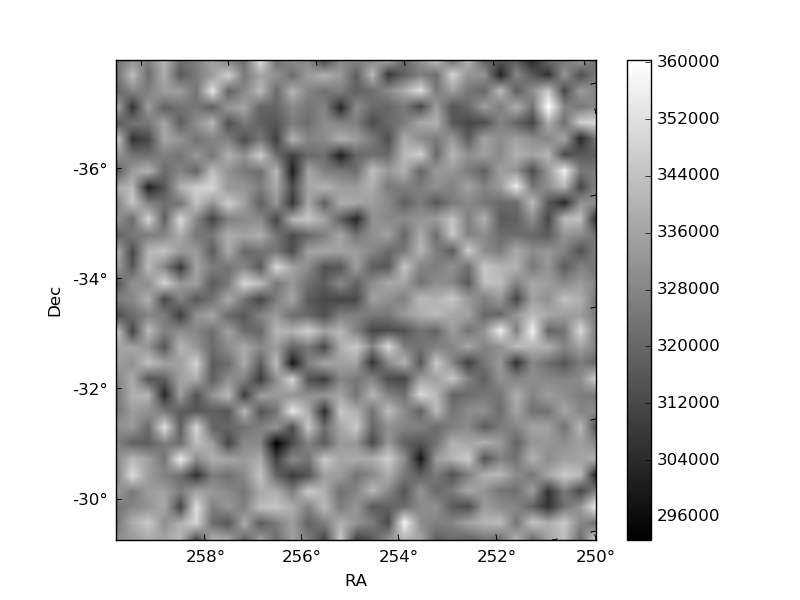
Histogram calculated using DETX and DETY for each event in the final _common_clean file
| Quadrant A | 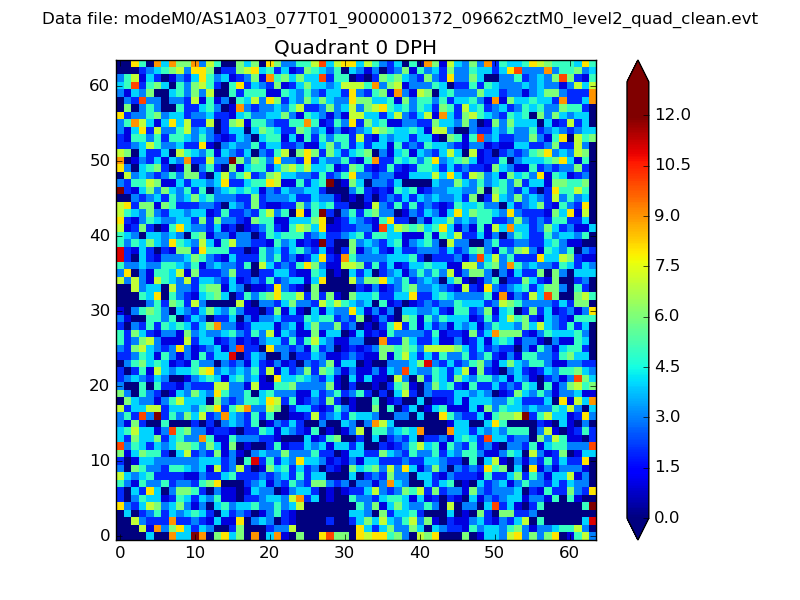 |
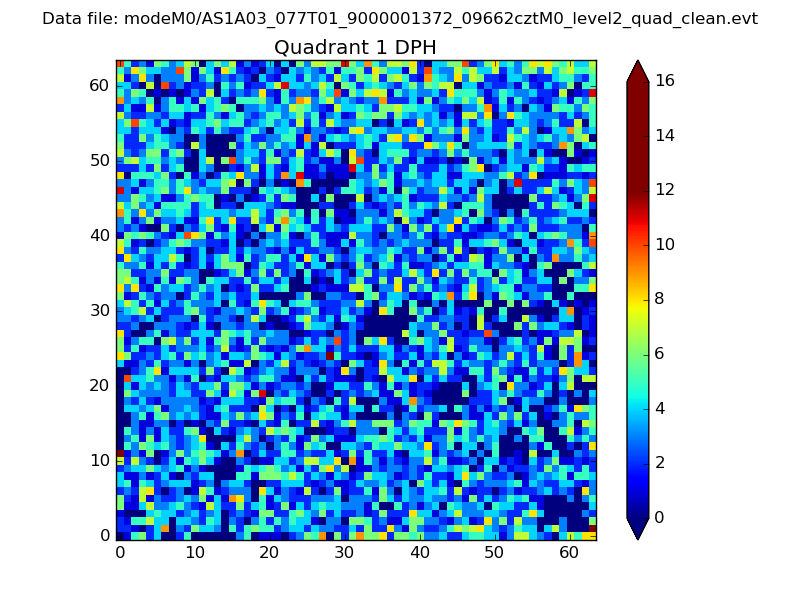 |
Quadrant B |
|---|---|---|---|
| Quadrant D |  |
 |
Quadrant C |
| Plot type | Count rate plots | Images |
|---|---|---|
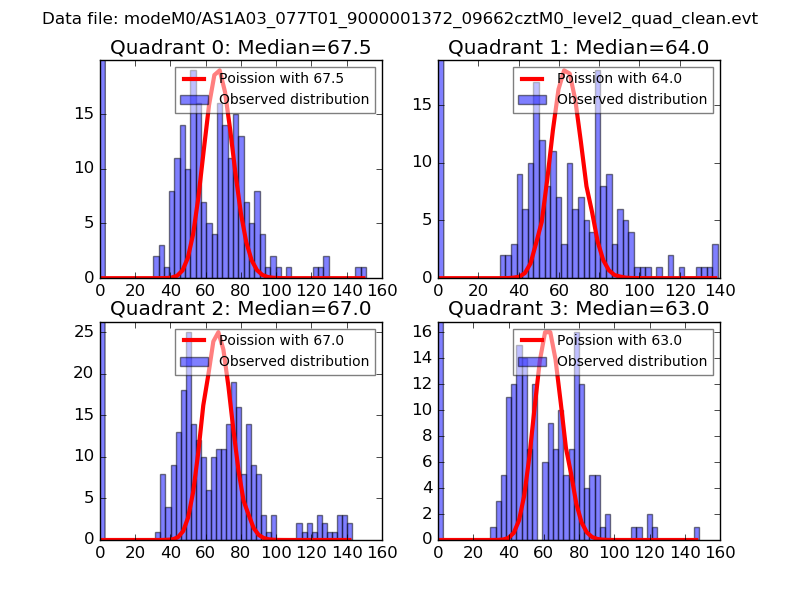
| Comparison with Poisson distribution Blue bars denote a histogram of data divided into 1 sec bins. Red curve is a Poisson curve with rate = median count rate of data. |
 |
 |
| Quadrant-wise count rates Data is divided into 100 sec bins |
 |
|
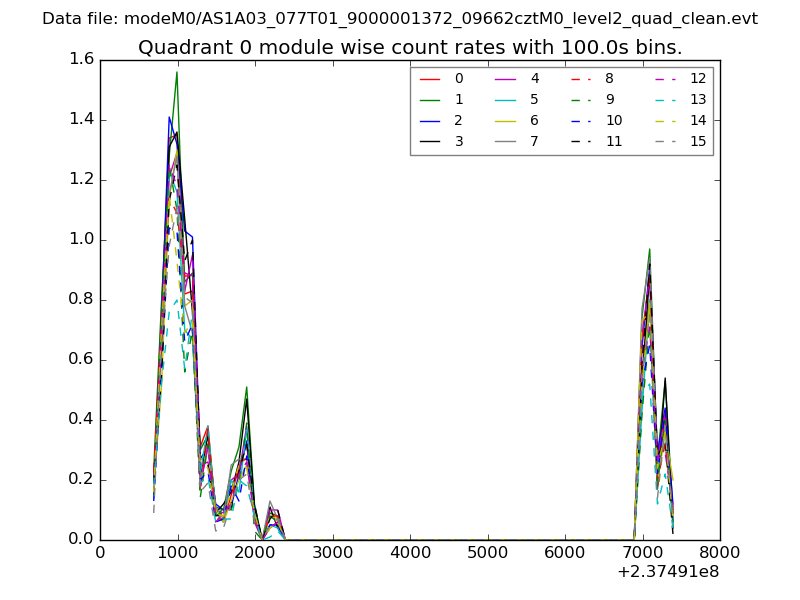
| Module-wise count rates for Quadrant A Data is divided into 100 sec bins |
 |
 |
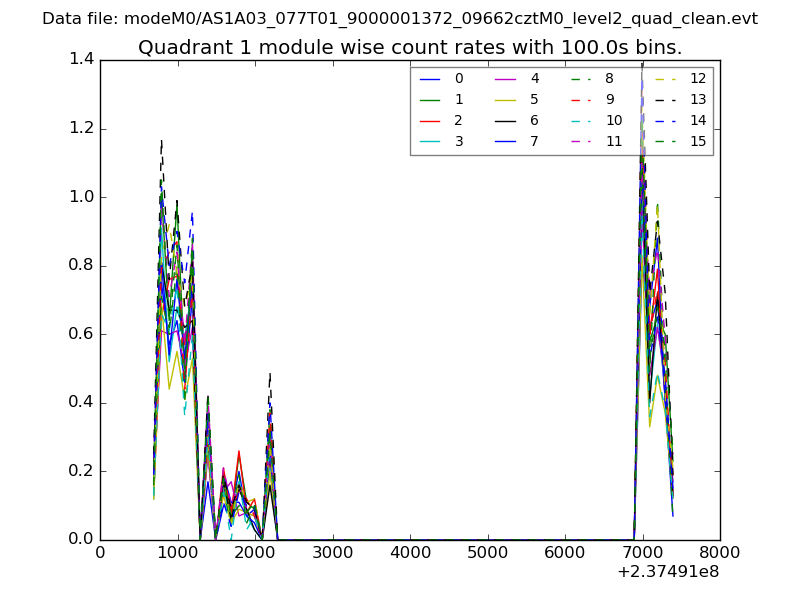
| Module-wise count rates for Quadrant B Data is divided into 100 sec bins |
 |
 |
| Module-wise count rates for Quadrant C Data is divided into 100 sec bins |
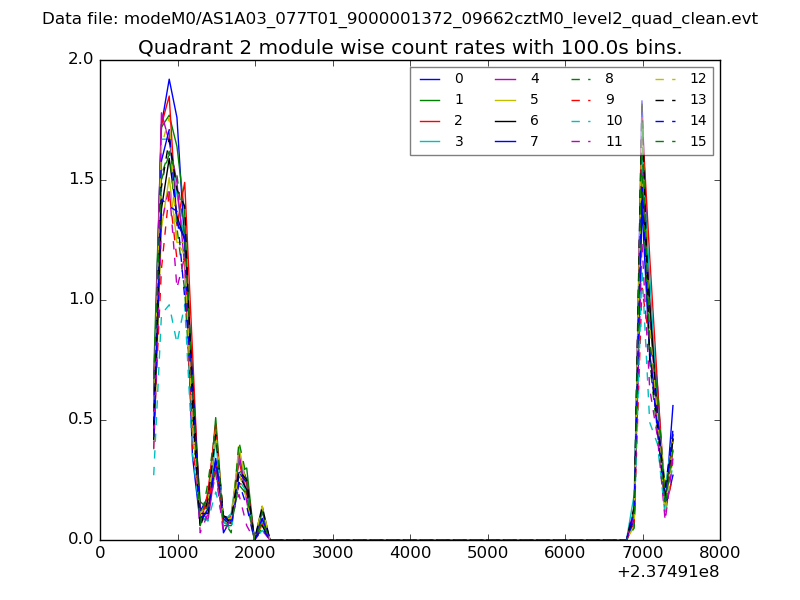 |
 |
| Module-wise count rates for Quadrant D Data is divided into 100 sec bins |
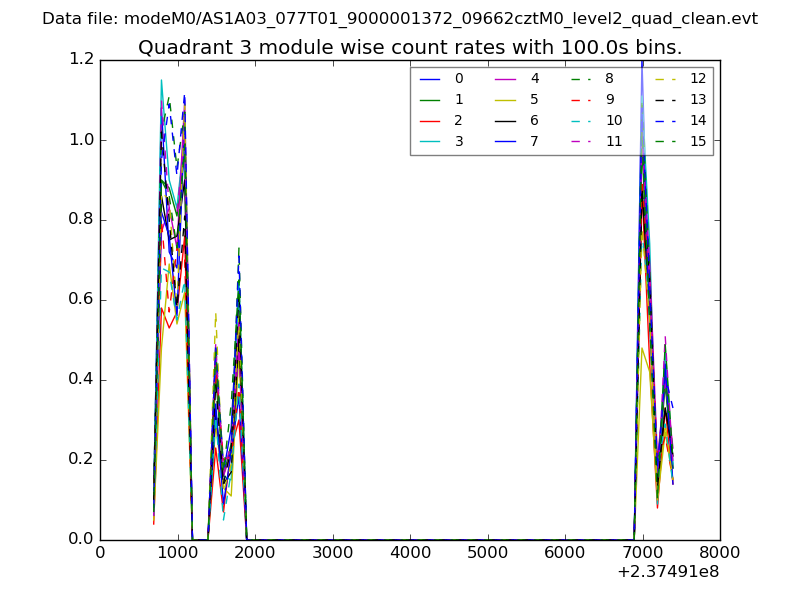 |
 |
| Parameter | Plot |
|---|---|
| CZT HV Monitor | 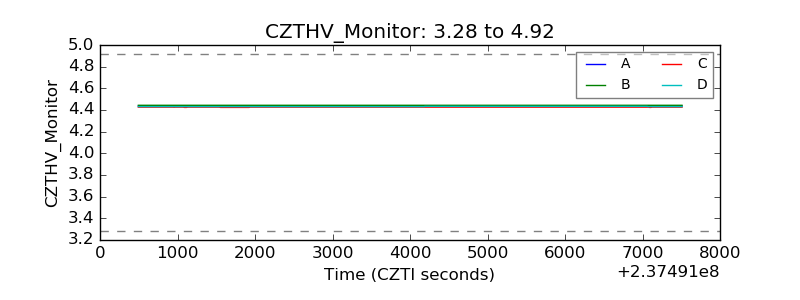 |
| D_VDD | 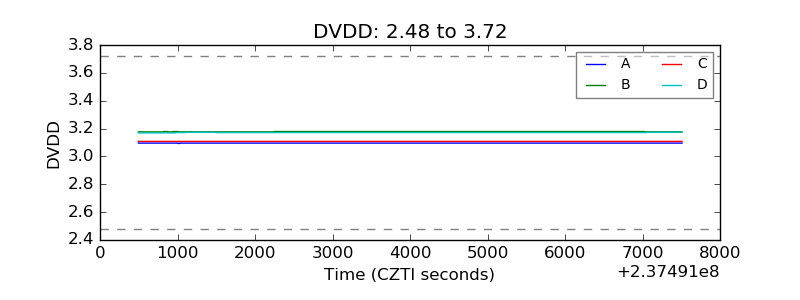 |
| Temperature 1 | 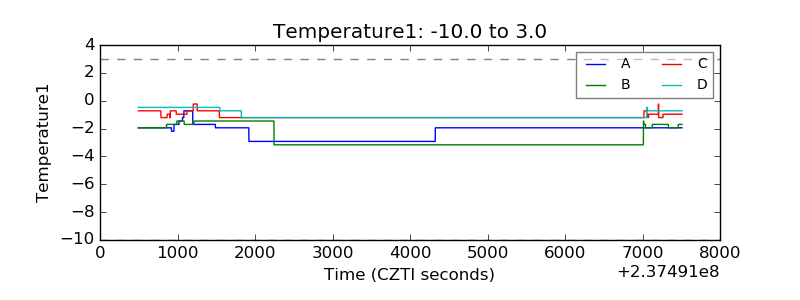 |
| Veto HV Monitor | 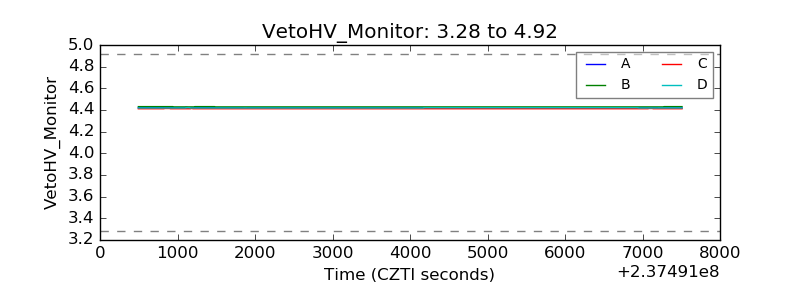 |
| Veto LLD | 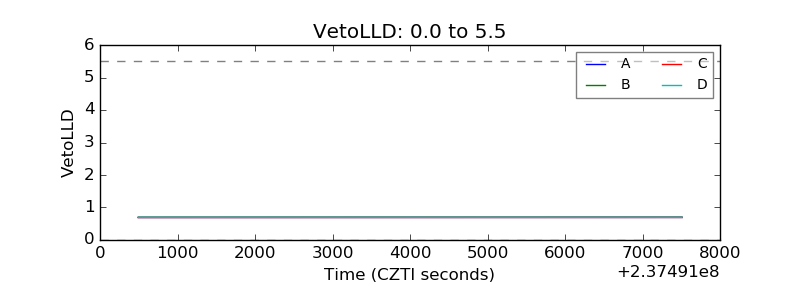 |
| Alpha Counter | 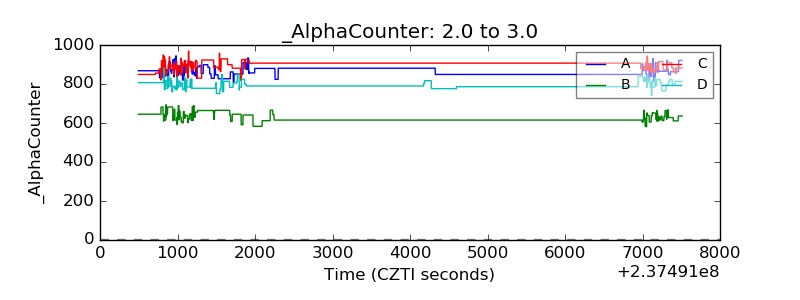 |
| _CPM_Rate | 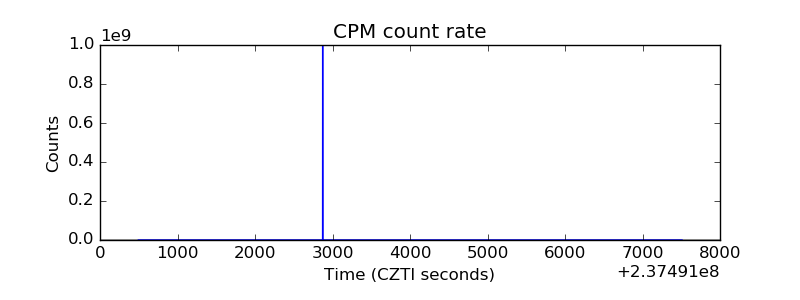 |
| CZT Counter |  |
| +2.5 Volts monitor |  |
| +5 Volts monitor | 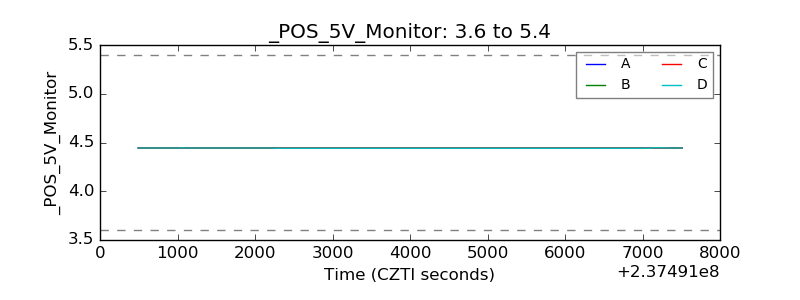 |
| _ROLL_ROT | 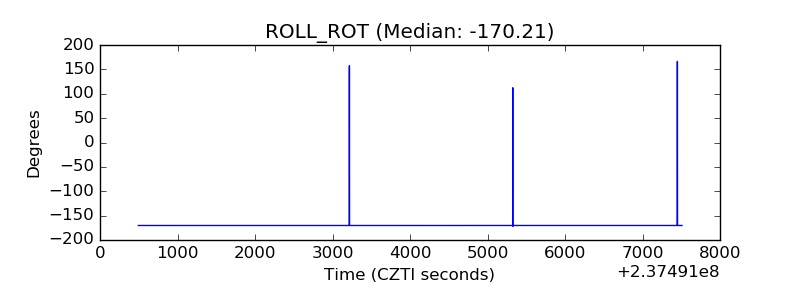 |
| _Roll_DEC | 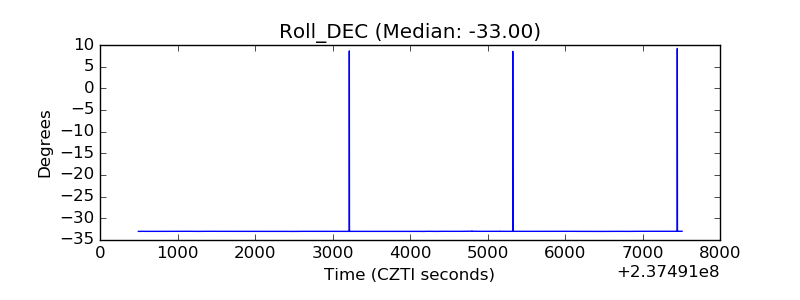 |
| _Roll_RA | 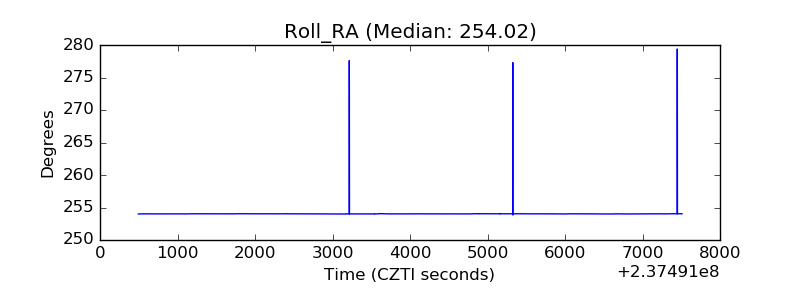 |
| Veto Counter | 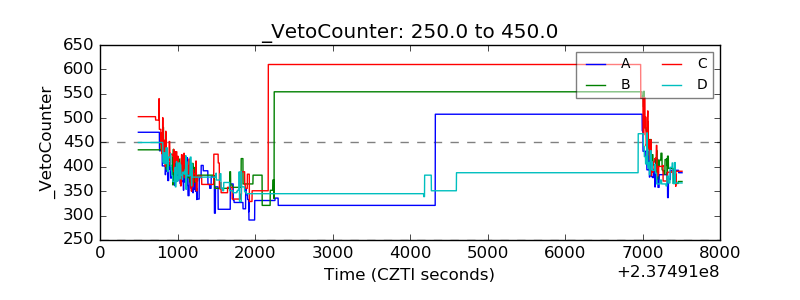 |