| Param | Original file | Final file |
|---|---|---|
| Filename | modeM0/AS1A03_077T01_9000001372_09663cztM0_level2.evt | modeM0/AS1A03_077T01_9000001372_09663cztM0_level2_quad_clean.evt |
| Size (bytes) | 1,015,441,920 | 189,673,920 |
| Size | 968.4 MB | 180.9 MB |
| Events in quadrant A | 7,186,591 | 1,204,876 |
| Events in quadrant B | 7,524,202 | 1,189,834 |
| Events in quadrant C | 6,871,712 | 1,195,625 |
| Events in quadrant D | 8,127,691 | 1,095,359 |
| Mode M9 | |||
|---|---|---|---|
| Quadrant | BADHDUFLAG | Total packets | Discarded packets |
| A | 0 | 17 | 5 |
| B | 0 | 17 | 8 |
| C | 0 | 17 | 5 |
| D | 0 | 17 | 5 |
| Mode SS | |||
|---|---|---|---|
| Quadrant | BADHDUFLAG | Total packets | Discarded packets |
| A | 0 | 473 | 155 |
| B | 0 | 473 | 142 |
| C | 0 | 473 | 144 |
| D | 0 | 472 | 156 |
| Mode M0 | |||
|---|---|---|---|
| Quadrant | BADHDUFLAG | Total packets | Discarded packets |
| A | 0 | 48089 | 16414 |
| B | 0 | 49600 | 17365 |
| C | 0 | 47801 | 16459 |
| D | 0 | 56229 | 22003 |
| Quadrant | Total seconds | Saturated seconds | Saturation percentage |
|---|---|---|---|
| A | 15435 | 135 | 0.874636% |
| B | 15293 | 166 | 1.085464% |
| C | 15380 | 43 | 0.279584% |
| D | 14769 | 236 | 1.597942% |
Noise dominated data is calculated using 1-second bins in cleaned event files. If a bin has >2000 counts, and if more than 50% of those come from <1% of pixels, then it is considered to be noise-dominated and hence unusable.
| Quadrant | # 1 sec bins | Bins with >0 counts | Bins with >2000 counts | High rate bins dominated by noise | Noise dominated (total time) | Noise dominated (detector-on time) | Marked lightcurve |
|---|---|---|---|---|---|---|---|
| A | 25006 | 19577 | 0 | 0 | 0.00% | 0.00% |  |
| B | 25004 | 19450 | 8 | 8 | 0.03% | 0.04% |  |
| C | 25004 | 19493 | 0 | 0 | 0.00% | 0.00% | 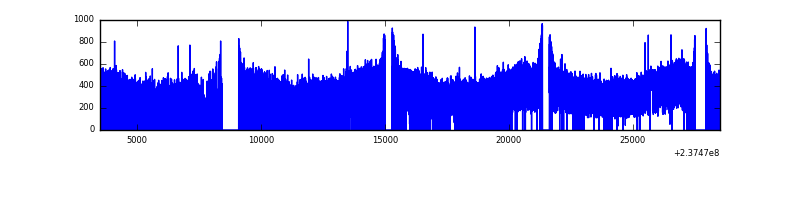 |
| D | 25006 | 18882 | 123 | 123 | 0.49% | 0.65% |  |
Top three noisy pixels from each quadrant. If the there are fewer than three noisy pixels in the level2.evt file, extra rows are filled as -1
| Pixel properties | Quadrant properties | ||||||
|---|---|---|---|---|---|---|---|
| Quadrant | DetID | PixID | Counts | Sigma | Mean | Median | Sigma |
| A | 7 | 223 | 111863 | 294.8 | 1825 | 1788 | 373.4 |
| A | 1 | 162 | 25262 | 62.87 | 1825 | 1788 | 373.4 |
| A | 0 | 226 | 17217 | 41.32 | 1825 | 1788 | 373.4 |
| B | 0 | 214 | 163126 | 468.5 | 1808 | 1767 | 344.4 |
| B | 0 | 219 | 68758 | 194.51 | 1808 | 1767 | 344.4 |
| B | 0 | 85 | 67680 | 191.38 | 1808 | 1767 | 344.4 |
| C | 13 | 61 | 13441 | 28.69 | 1759 | 1768 | 406.9 |
| C | 14 | 234 | 5113 | 8.22 | 1759 | 1768 | 406.9 |
| C | 5 | 128 | 5027 | 8.01 | 1759 | 1768 | 406.9 |
| D | 1 | 52 | 1051718 | 2503.47 | 1676 | 1633 | 419.5 |
| D | 8 | 195 | 425771 | 1011.17 | 1676 | 1633 | 419.5 |
| D | 2 | 152 | 75561 | 176.25 | 1676 | 1633 | 419.5 |
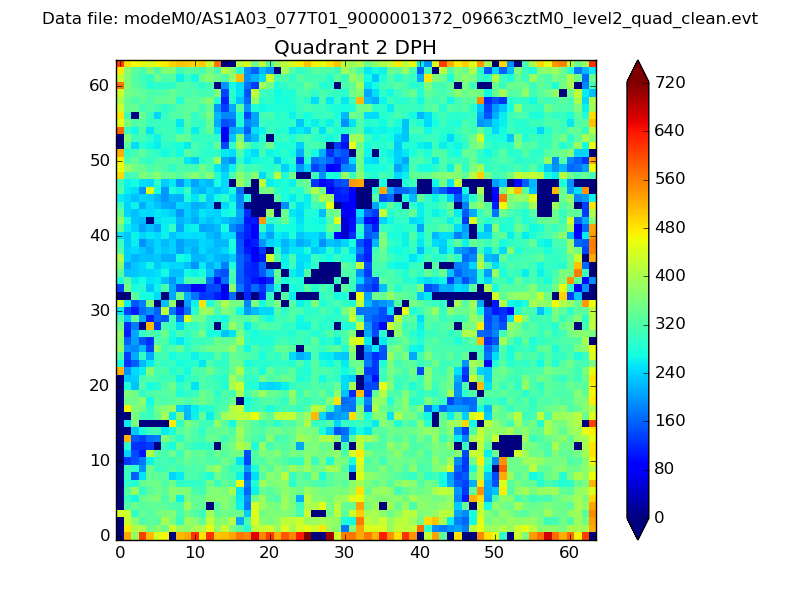
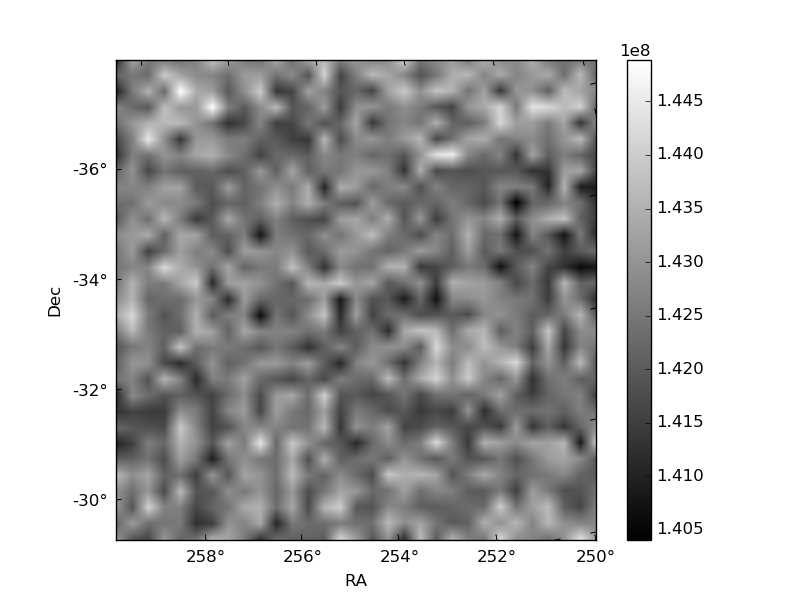
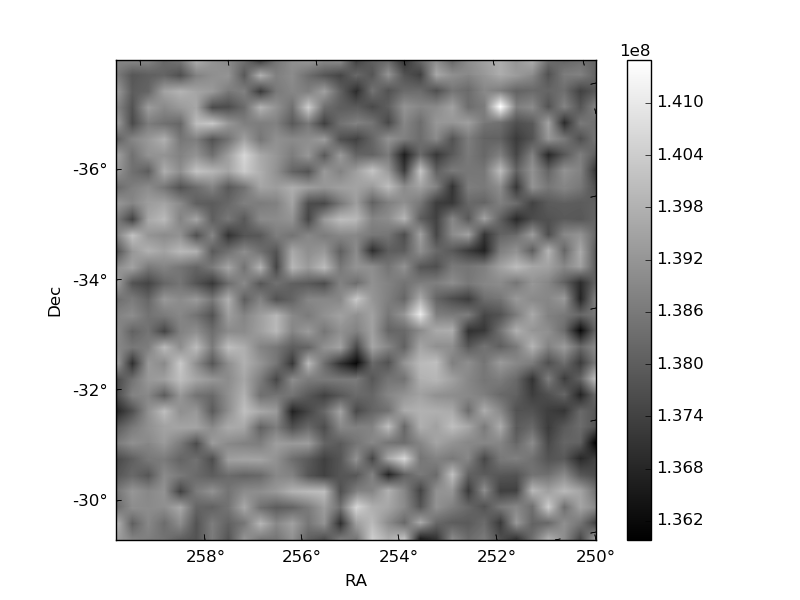
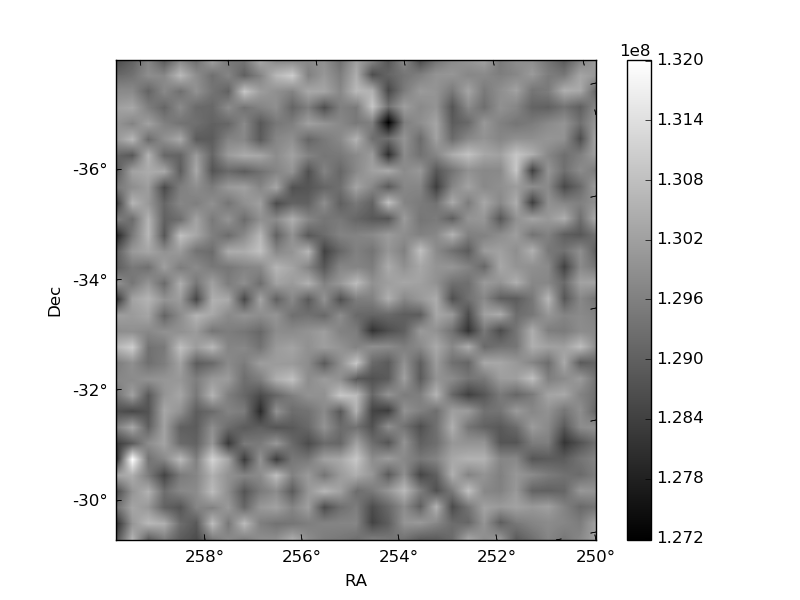
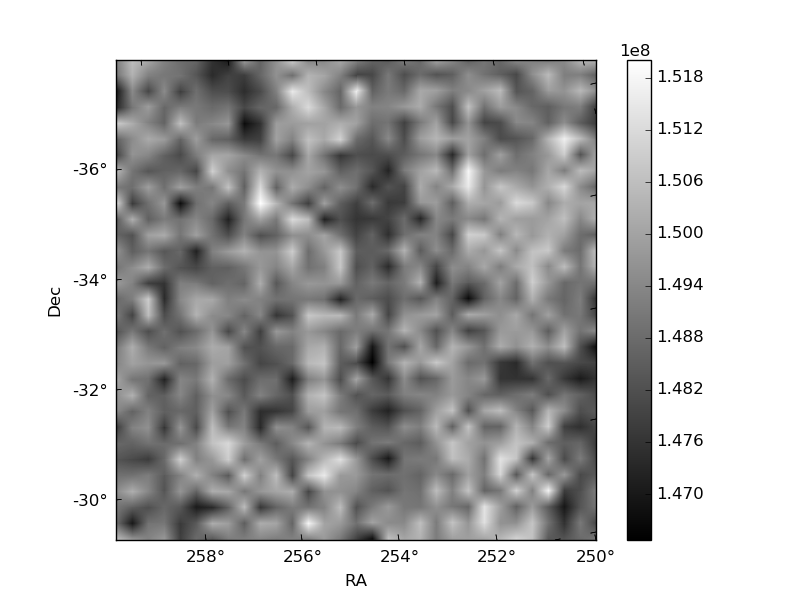
Histogram calculated using DETX and DETY for each event in the final _common_clean file
| Quadrant A | 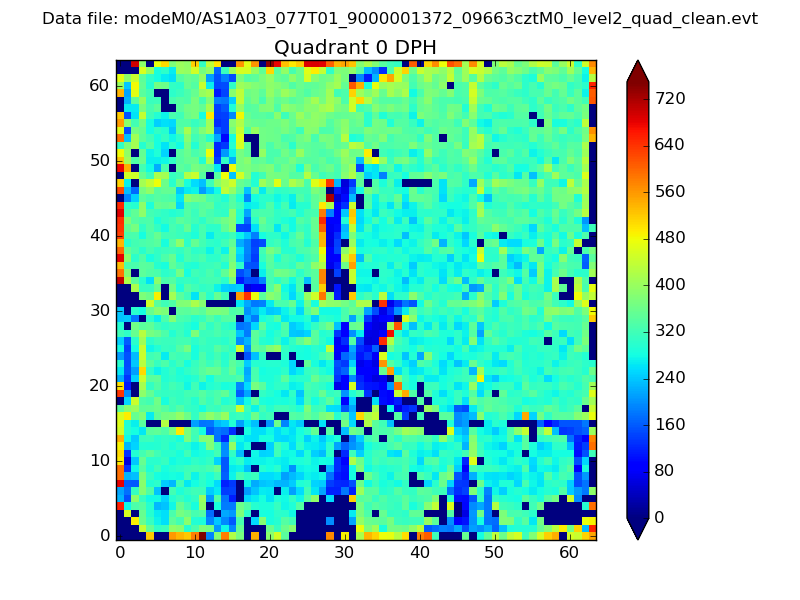 |
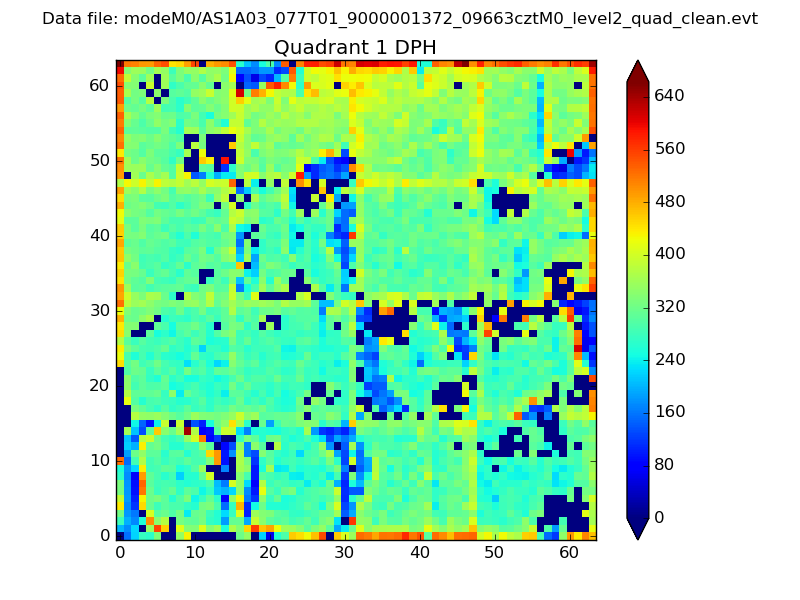 |
Quadrant B |
|---|---|---|---|
| Quadrant D | 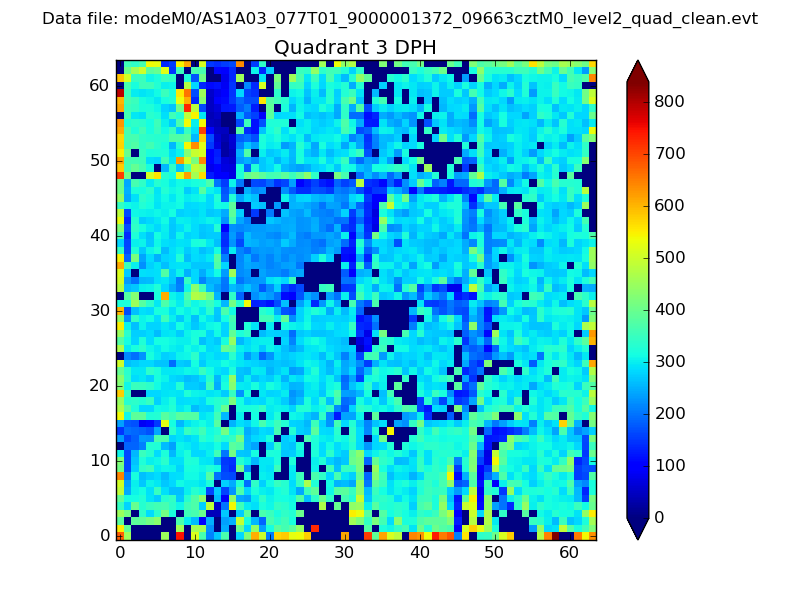 |
 |
Quadrant C |
| Plot type | Count rate plots | Images |
|---|---|---|
| Comparison with Poisson distribution Blue bars denote a histogram of data divided into 1 sec bins. Red curve is a Poisson curve with rate = median count rate of data. |
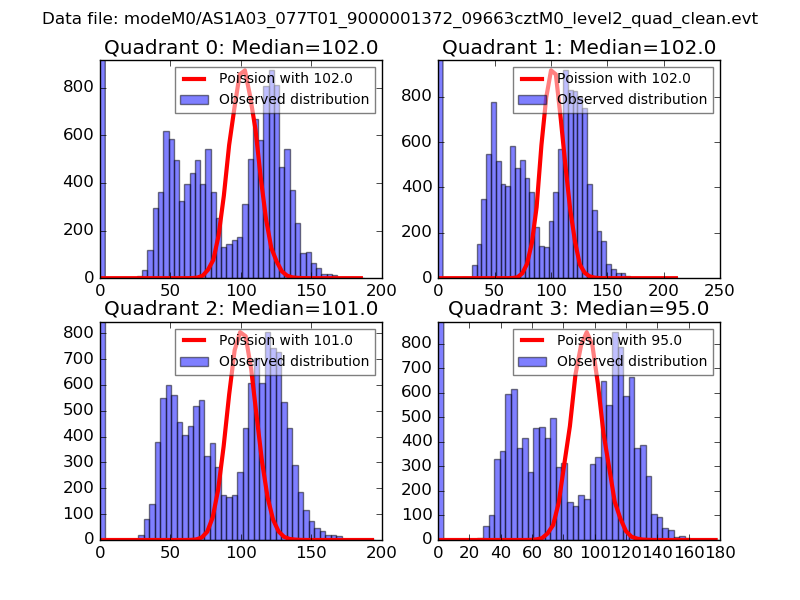 |
 |
| Quadrant-wise count rates Data is divided into 100 sec bins |
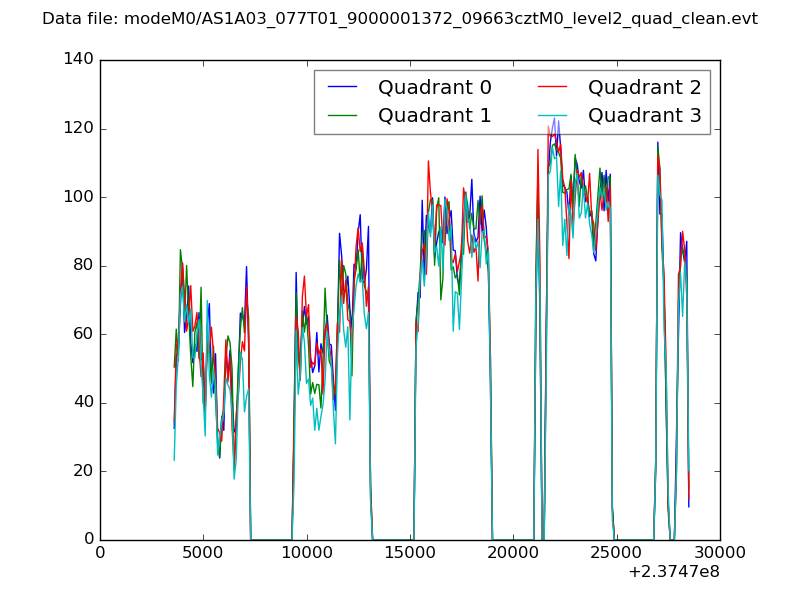 |
|
| Module-wise count rates for Quadrant A Data is divided into 100 sec bins |
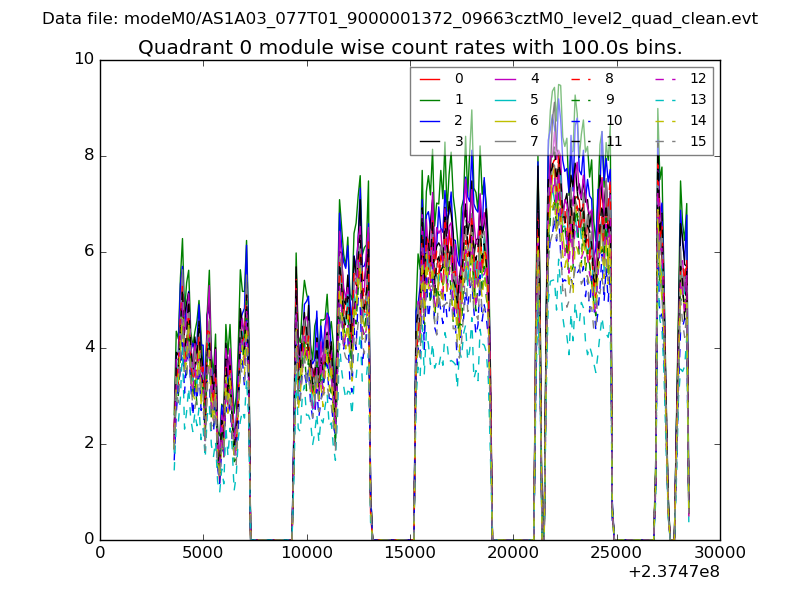 |
 |
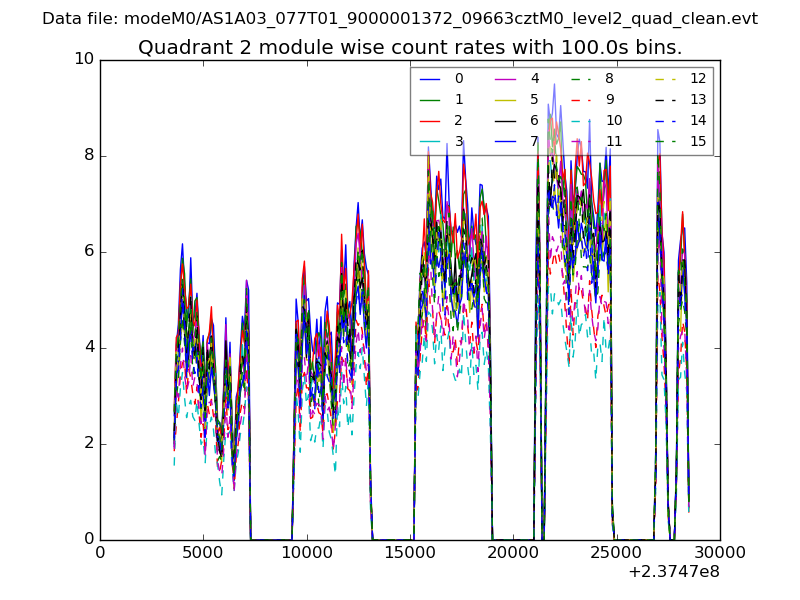
| Module-wise count rates for Quadrant B Data is divided into 100 sec bins |
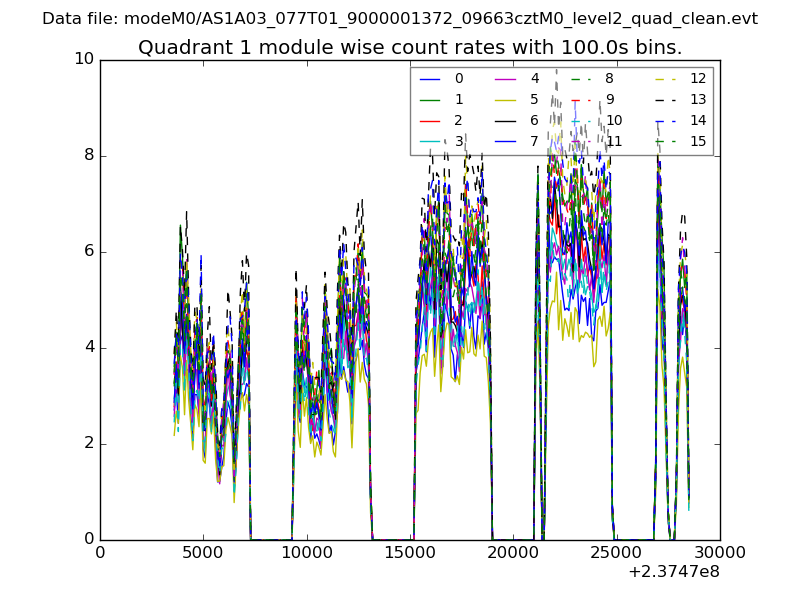 |
 |
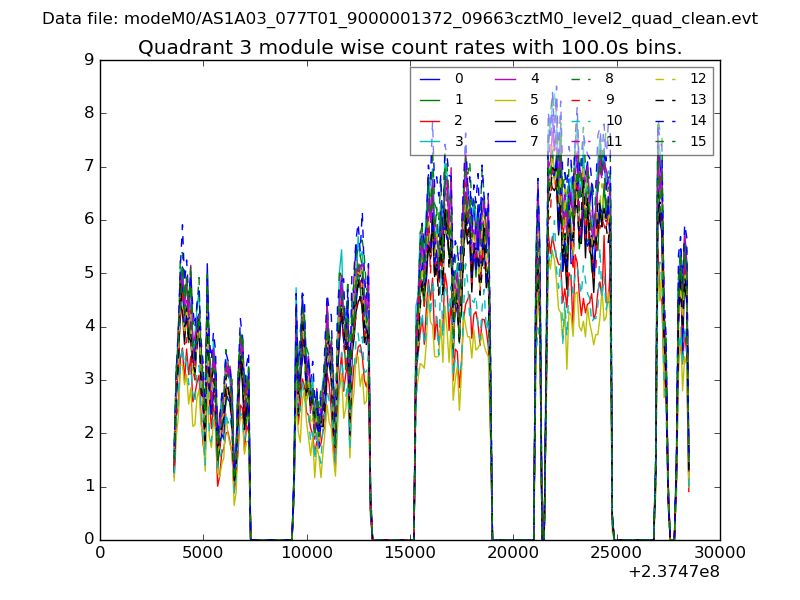
| Module-wise count rates for Quadrant C Data is divided into 100 sec bins |
 |
 |
| Module-wise count rates for Quadrant D Data is divided into 100 sec bins |
 |
 |
| Parameter | Plot |
|---|---|
| CZT HV Monitor | 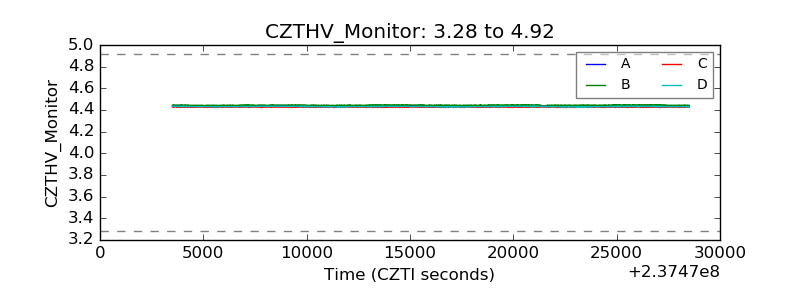 |
| D_VDD | 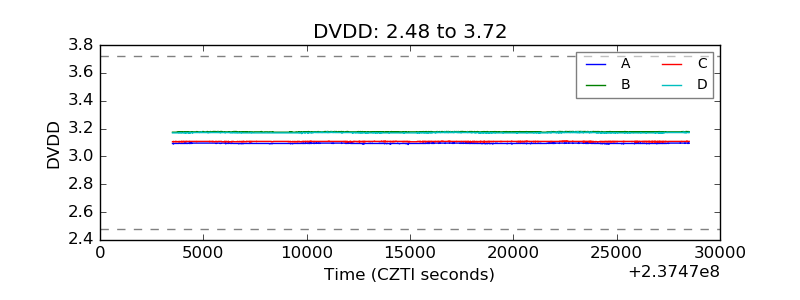 |
| Temperature 1 | 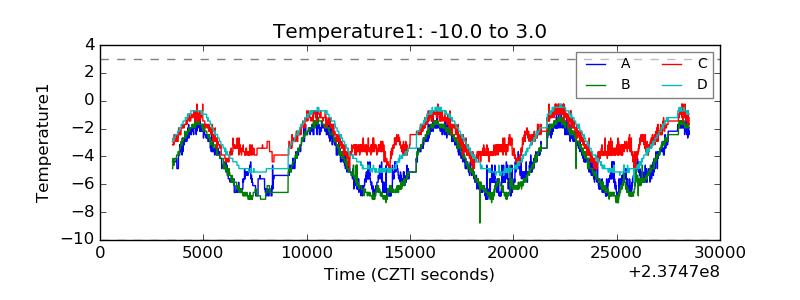 |
| Veto HV Monitor | 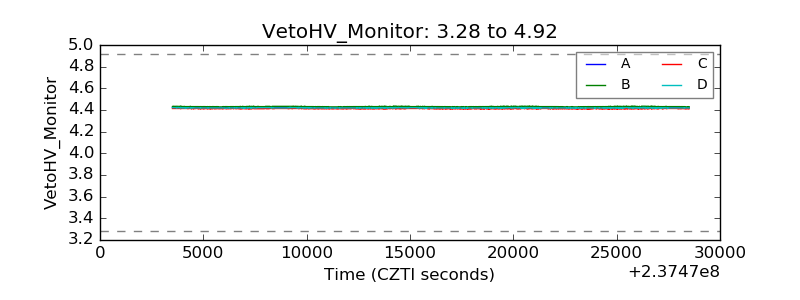 |
| Veto LLD | 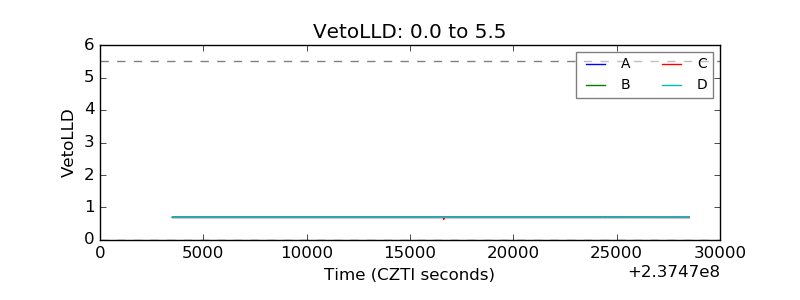 |
| Alpha Counter | 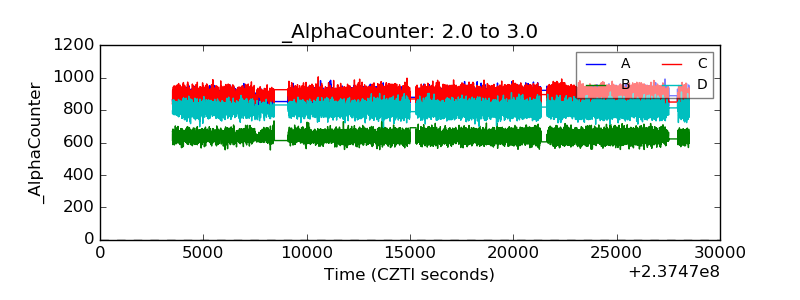 |
| _CPM_Rate | 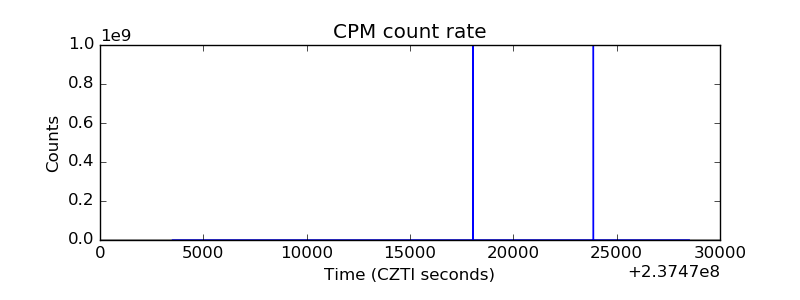 |
| CZT Counter | 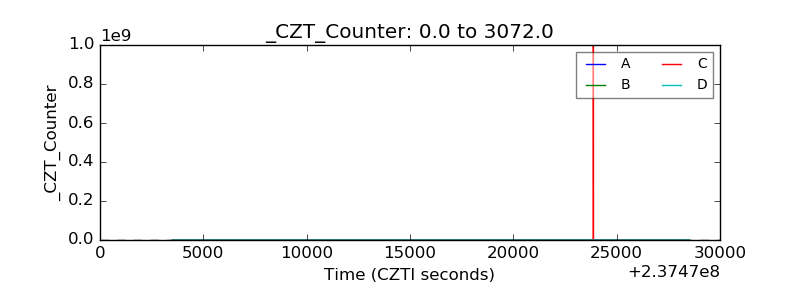 |
| +2.5 Volts monitor |  |
| +5 Volts monitor | 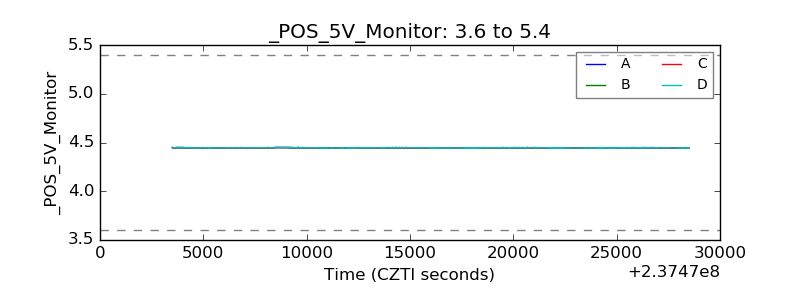 |
| _ROLL_ROT | 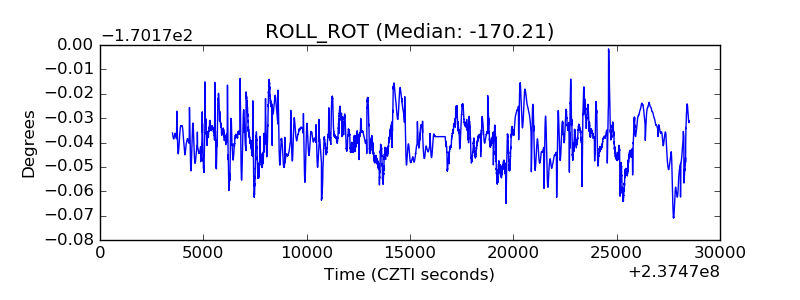 |
| _Roll_DEC | 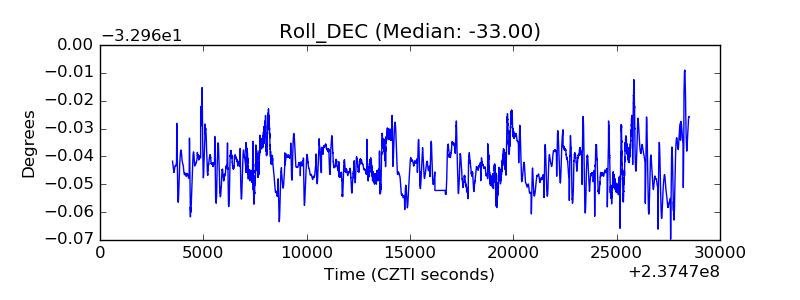 |
| _Roll_RA | 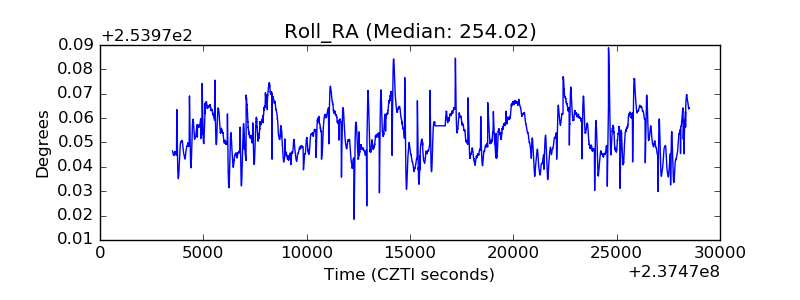 |
| Veto Counter | 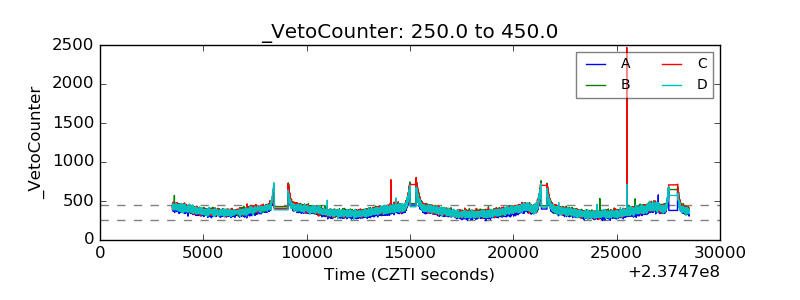 |