| Param | Original file | Final file |
|---|---|---|
| Filename | modeM0/AS1G07_028T01_9000001370cztM0_level2.fits | modeM0/AS1G07_028T01_9000001370cztM0_level2_quad_clean.evt |
| Size (bytes) | 149,425,920 | 131,595,840 |
| Size | 142.5 MB | 125.5 MB |
| Events in quadrant A | 972,536 | 826,613 |
| Events in quadrant B | 937,228 | 823,577 |
| Events in quadrant C | 678,258 | 508,641 |
| Events in quadrant D | 830,596 | 721,759 |
| Mode M9 | |||
|---|---|---|---|
| Quadrant | BADHDUFLAG | Total packets | Discarded packets |
| A | 0 | 13 | 0 |
| B | 0 | 11 | 0 |
| C | 0 | 13 | 0 |
| D | 0 | 12 | 0 |
| Mode M0 | |||
|---|---|---|---|
| Quadrant | BADHDUFLAG | Total packets | Discarded packets |
| A | 0 | 36240 | 0 |
| B | 0 | 36279 | 0 |
| C | 0 | 25541 | 0 |
| D | 0 | 39001 | 0 |
| Mode SS | |||
|---|---|---|---|
| Quadrant | BADHDUFLAG | Total packets | Discarded packets |
| A | 0 | 354 | 0 |
| B | 0 | 360 | 0 |
| C | 0 | 344 | 0 |
| D | 0 | 352 | 0 |
| Quadrant | Total seconds | Saturated seconds | Saturation percentage |
|---|---|---|---|
| A | 17253 | 510 | 2.956008% |
| B | 17207 | 587 | 3.411402% |
| C | 12065 | 449 | 3.721508% |
| D | 17102 | 500 | 2.923635% |
Noise dominated data is calculated using 1-second bins in cleaned event files. If a bin has >2000 counts, and if more than 50% of those come from <1% of pixels, then it is considered to be noise-dominated and hence unusable.
| Quadrant | # 1 sec bins | Bins with >0 counts | Bins with >2000 counts | High rate bins dominated by noise | Noise dominated (total time) | Noise dominated (detector-on time) | Marked lightcurve |
|---|---|---|---|---|---|---|---|
| A | 21655 | 19231 | 0 | 0 | 0.00% | 0.00% |  |
| B | 21655 | 19145 | 0 | 0 | 0.00% | 0.00% |  |
| C | 15493 | 13622 | 0 | 0 | 0.00% | 0.00% |  |
| D | 21655 | 19039 | 0 | 0 | 0.00% | 0.00% |  |
Top three noisy pixels from each quadrant. If the there are fewer than three noisy pixels in the level2.evt file, extra rows are filled as -1
| Pixel properties | Quadrant properties | ||||||
|---|---|---|---|---|---|---|---|
| Quadrant | DetID | PixID | Counts | Sigma | Mean | Median | Sigma |
| A | 0 | 29 | 944 | 10.64 | 252 | 234 | 66.7 |
| A | 14 | 188 | 940 | 10.58 | 252 | 234 | 66.7 |
| A | 14 | 204 | 831 | 8.95 | 252 | 234 | 66.7 |
| B | 2 | 9 | 833 | 11.49 | 246 | 233 | 52.2 |
| B | 2 | 8 | 630 | 7.6 | 246 | 233 | 52.2 |
| B | 3 | 17 | 621 | 7.43 | 246 | 233 | 52.2 |
| C | 12 | 241 | 536 | 7.56 | 179 | 166 | 49.0 |
| C | 2 | 191 | 488 | 6.58 | 179 | 166 | 49.0 |
| C | 9 | 188 | 459 | 5.98 | 179 | 166 | 49.0 |
| D | 3 | 14 | 616 | 6.09 | 236 | 214 | 66.0 |
| D | 6 | 231 | 601 | 5.86 | 236 | 214 | 66.0 |
| D | 6 | 38 | 600 | 5.85 | 236 | 214 | 66.0 |
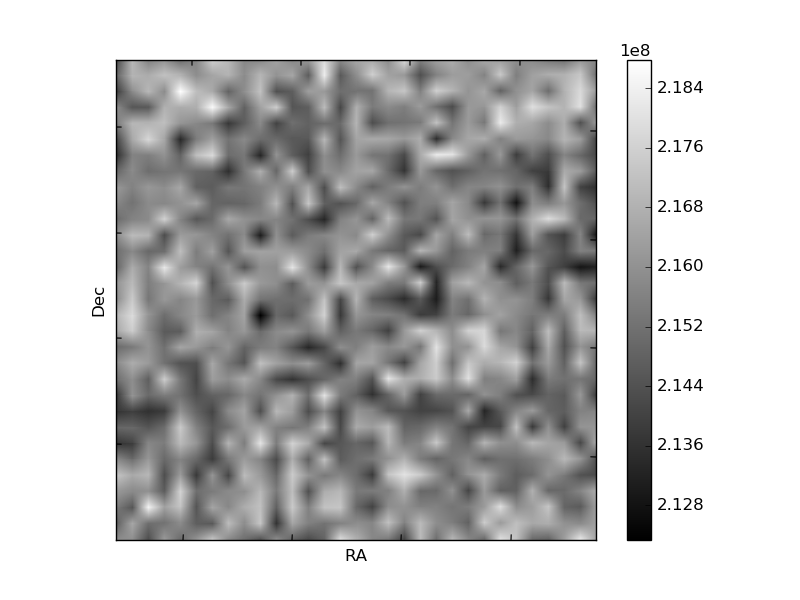
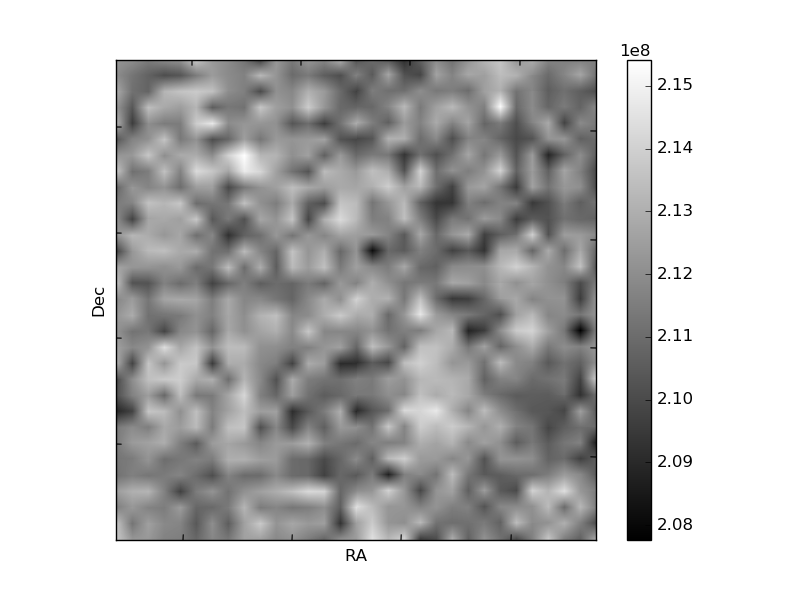
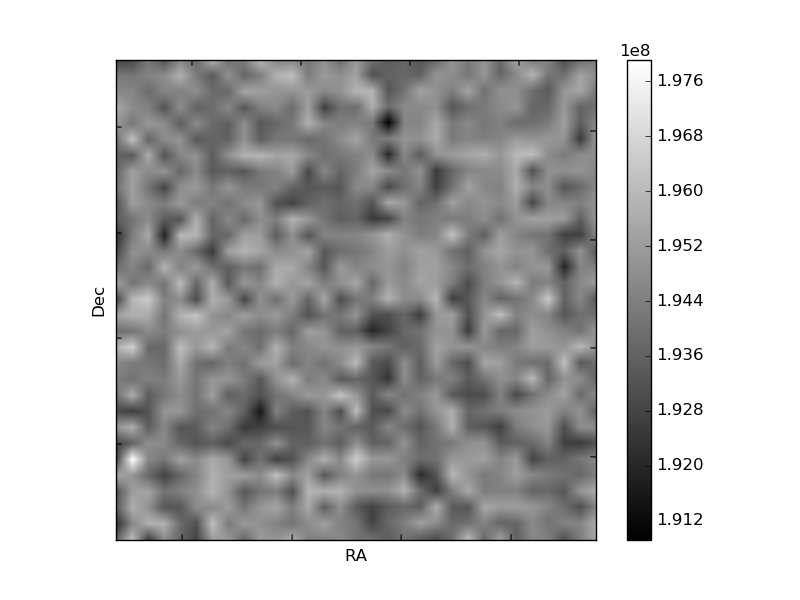
Histogram calculated using DETX and DETY for each event in the final _common_clean file
| Quadrant A | 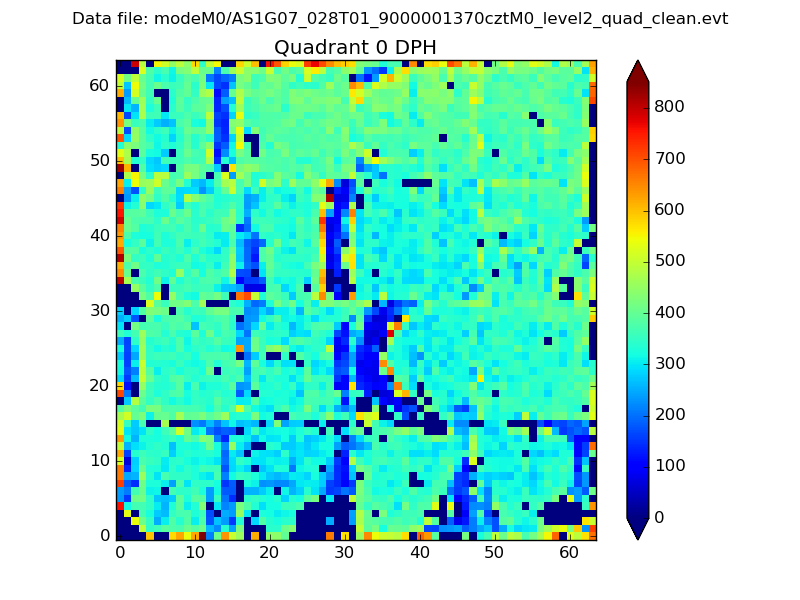 |
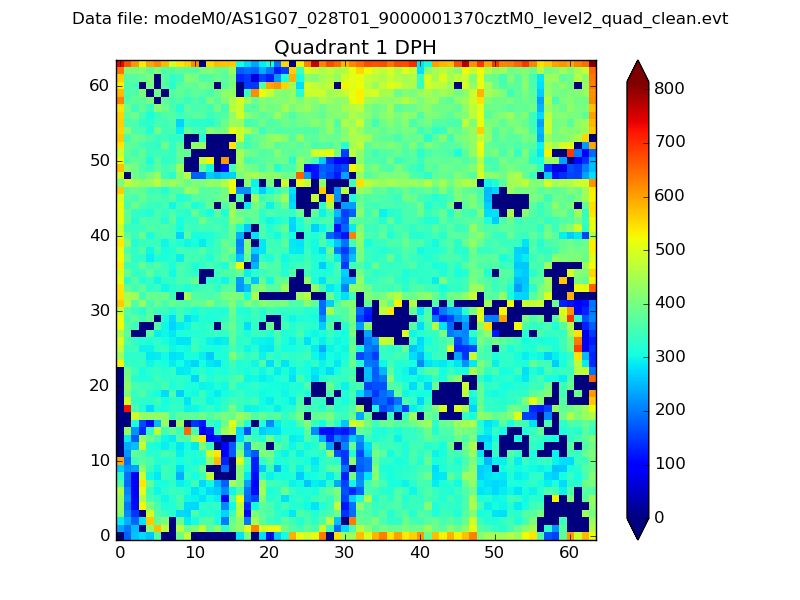 |
Quadrant B |
|---|---|---|---|
| Quadrant D | 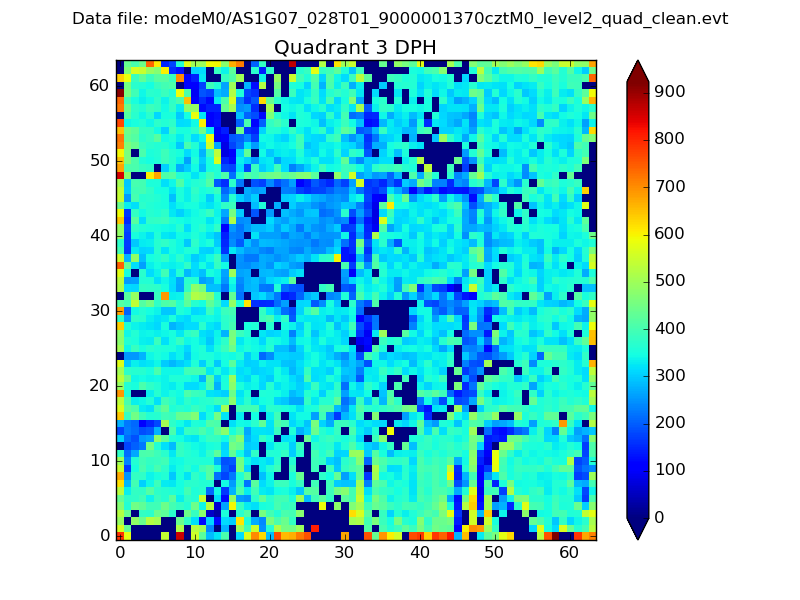 |
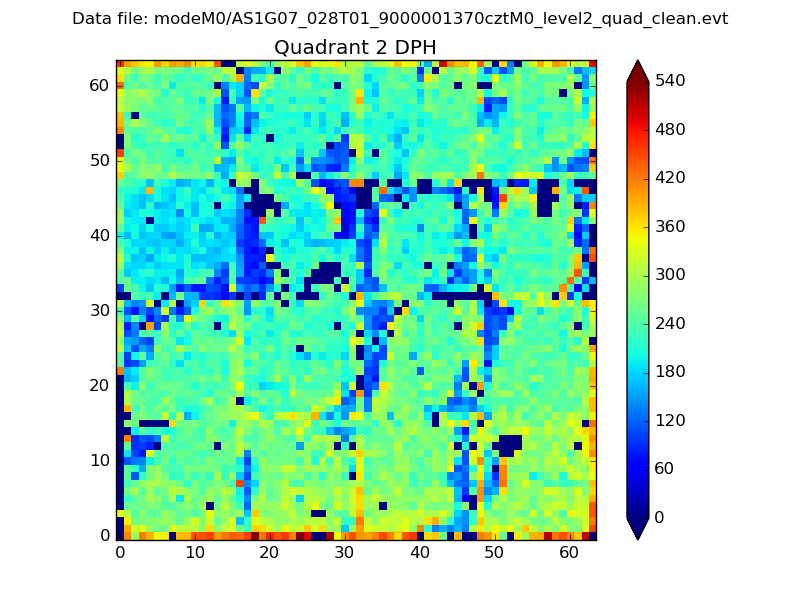 |
Quadrant C |
| Plot type | Count rate plots | Images |
|---|---|---|
| Comparison with Poisson distribution Blue bars denote a histogram of data divided into 1 sec bins. Red curve is a Poisson curve with rate = median count rate of data. |
 |
 |
| Quadrant-wise count rates Data is divided into 100 sec bins |
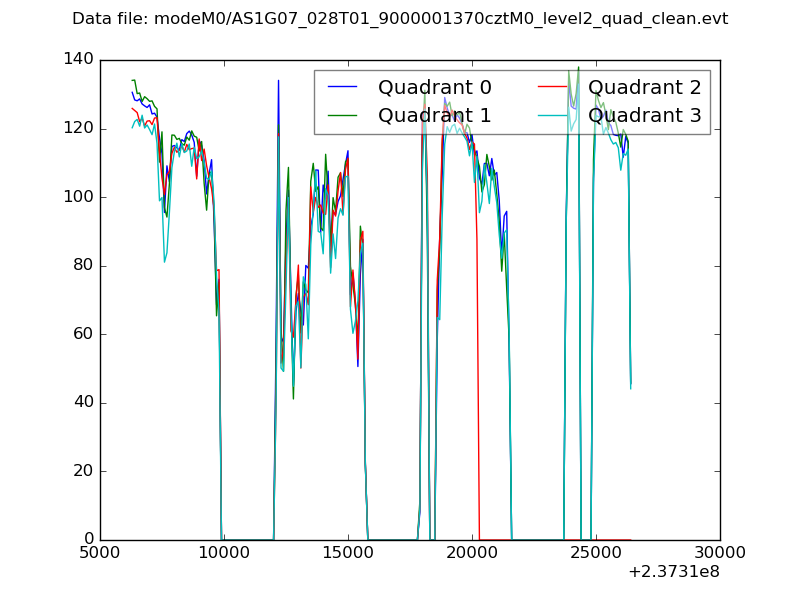 |
|
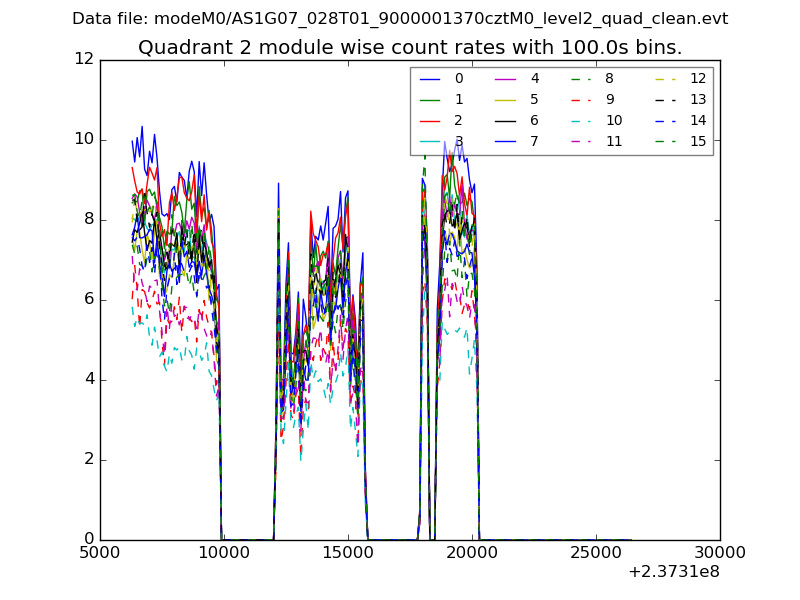
| Module-wise count rates for Quadrant A Data is divided into 100 sec bins |
 |
 |
| Module-wise count rates for Quadrant B Data is divided into 100 sec bins |
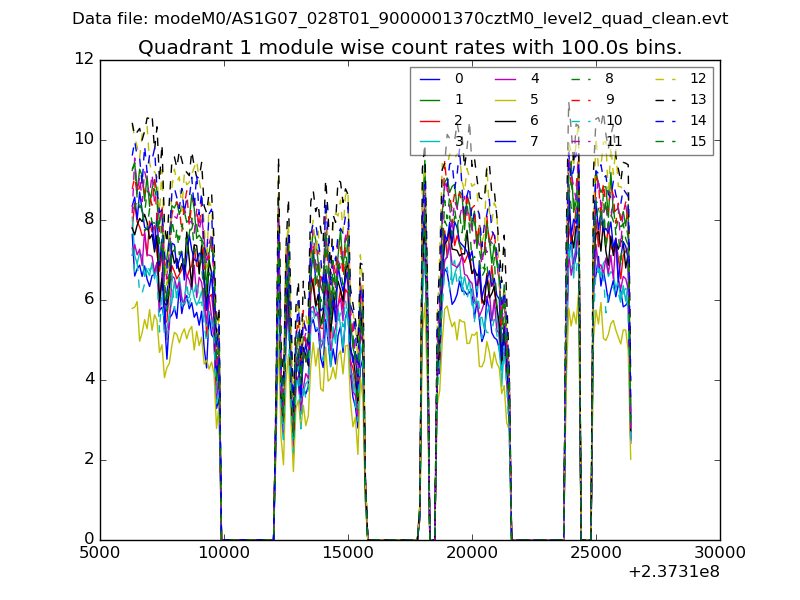 |
 |
| Module-wise count rates for Quadrant C Data is divided into 100 sec bins |
 |
 |
| Module-wise count rates for Quadrant D Data is divided into 100 sec bins |
 |
 |
| Parameter | Plot |
|---|---|
| CZT HV Monitor |  |
| D_VDD |  |
| Temperature 1 |  |
| Veto HV Monitor |  |
| Veto LLD |  |
| Alpha Counter |  |
| _CPM_Rate |  |
| CZT Counter |  |
| +2.5 Volts monitor | 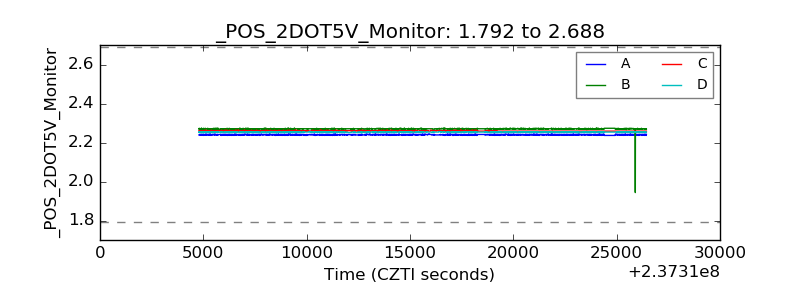 |
| +5 Volts monitor |  |
| _ROLL_ROT |  |
| _Roll_DEC | 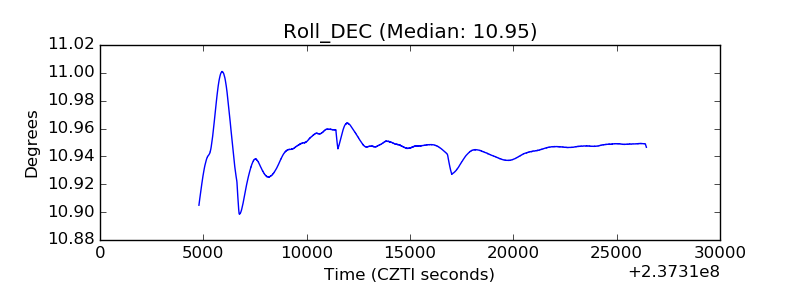 |
| _Roll_RA | 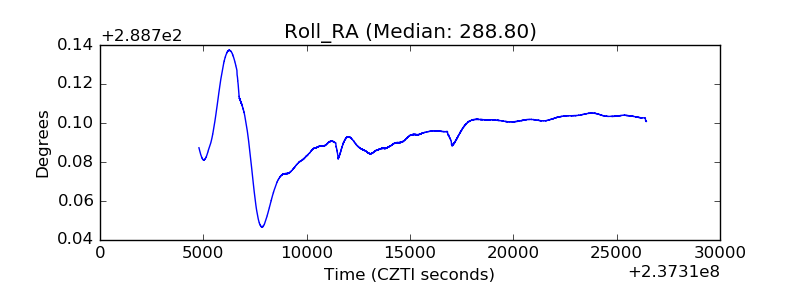 |
| Veto Counter |  |