| Param | Original file | Final file |
|---|---|---|
| Filename | modeM0/AS1G07_028T01_9000001370_09629cztM0_level2.evt | modeM0/AS1G07_028T01_9000001370_09629cztM0_level2_quad_clean.evt |
| Size (bytes) | 198,728,640 | 24,796,800 |
| Size | 189.5 MB | 23.6 MB |
| Events in quadrant A | 1,435,221 | 144,077 |
| Events in quadrant B | 1,470,653 | 146,419 |
| Events in quadrant C | 1,401,649 | 140,300 |
| Events in quadrant D | 1,535,613 | 136,865 |
| Mode M9 | |||
|---|---|---|---|
| Quadrant | BADHDUFLAG | Total packets | Discarded packets |
| A | 0 | 2 | 0 |
| B | 0 | 2 | 0 |
| C | 0 | 2 | 0 |
| D | 0 | 2 | 0 |
| Mode M0 | |||
|---|---|---|---|
| Quadrant | BADHDUFLAG | Total packets | Discarded packets |
| A | 0 | 5784 | 4 |
| B | 0 | 5850 | 1 |
| C | 0 | 5710 | 1 |
| D | 0 | 6165 | 1 |
| Mode SS | |||
|---|---|---|---|
| Quadrant | BADHDUFLAG | Total packets | Discarded packets |
| A | 0 | 54 | 0 |
| B | 0 | 54 | 0 |
| C | 0 | 54 | 0 |
| D | 0 | 54 | 0 |
| Quadrant | Total seconds | Saturated seconds | Saturation percentage |
|---|---|---|---|
| A | 2546 | 254 | 9.976434% |
| B | 2547 | 295 | 11.582254% |
| C | 2547 | 254 | 9.972517% |
| D | 2547 | 258 | 10.129564% |
Noise dominated data is calculated using 1-second bins in cleaned event files. If a bin has >2000 counts, and if more than 50% of those come from <1% of pixels, then it is considered to be noise-dominated and hence unusable.
| Quadrant | # 1 sec bins | Bins with >0 counts | Bins with >2000 counts | High rate bins dominated by noise | Noise dominated (total time) | Noise dominated (detector-on time) | Marked lightcurve |
|---|---|---|---|---|---|---|---|
| A | 2652 | 2550 | 1 | 1 | 0.04% | 0.04% | 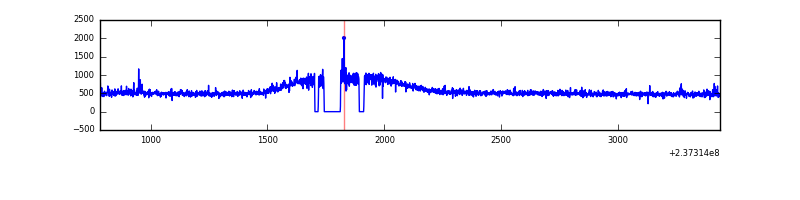 |
| B | 2652 | 2550 | 10 | 10 | 0.38% | 0.39% | 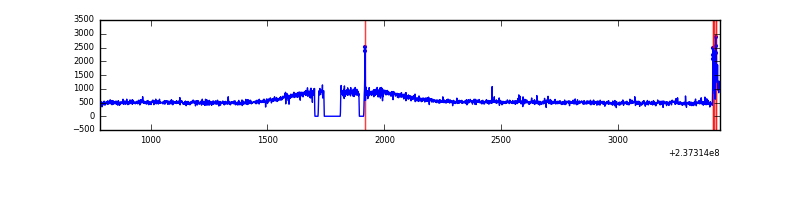 |
| C | 2652 | 2550 | 0 | 0 | 0.00% | 0.00% | 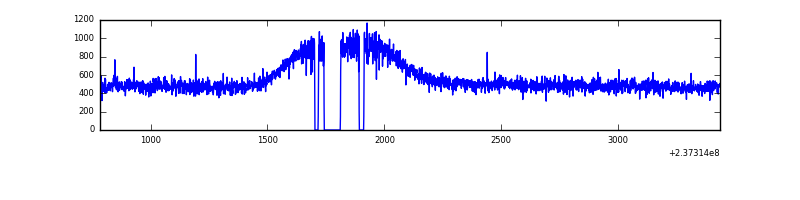 |
| D | 2652 | 2550 | 9 | 9 | 0.34% | 0.35% | 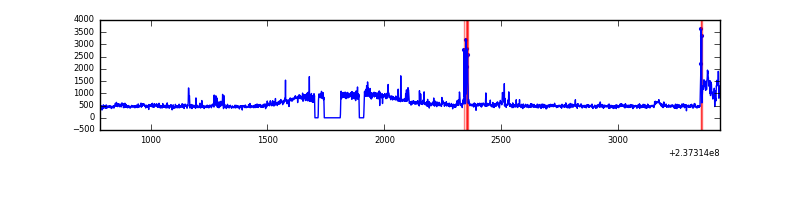 |
Top three noisy pixels from each quadrant. If the there are fewer than three noisy pixels in the level2.evt file, extra rows are filled as -1
| Pixel properties | Quadrant properties | ||||||
|---|---|---|---|---|---|---|---|
| Quadrant | DetID | PixID | Counts | Sigma | Mean | Median | Sigma |
| A | 1 | 162 | 14499 | 183.97 | 364 | 355 | 76.9 |
| A | 14 | 111 | 8488 | 105.78 | 364 | 355 | 76.9 |
| A | 1 | 178 | 4459 | 53.38 | 364 | 355 | 76.9 |
| B | 15 | 85 | 36251 | 484.59 | 363 | 353 | 74.1 |
| B | 10 | 252 | 9670 | 125.77 | 363 | 353 | 74.1 |
| B | 12 | 111 | 8580 | 111.06 | 363 | 353 | 74.1 |
| C | 13 | 61 | 2666 | 26.7 | 358 | 358 | 86.4 |
| C | 10 | 22 | 1418 | 12.26 | 358 | 358 | 86.4 |
| C | 12 | 4 | 1034 | 7.82 | 358 | 358 | 86.4 |
| D | 7 | 46 | 68161 | 760.11 | 359 | 349 | 89.2 |
| D | 10 | 172 | 44975 | 500.22 | 359 | 349 | 89.2 |
| D | 1 | 52 | 34523 | 383.06 | 359 | 349 | 89.2 |
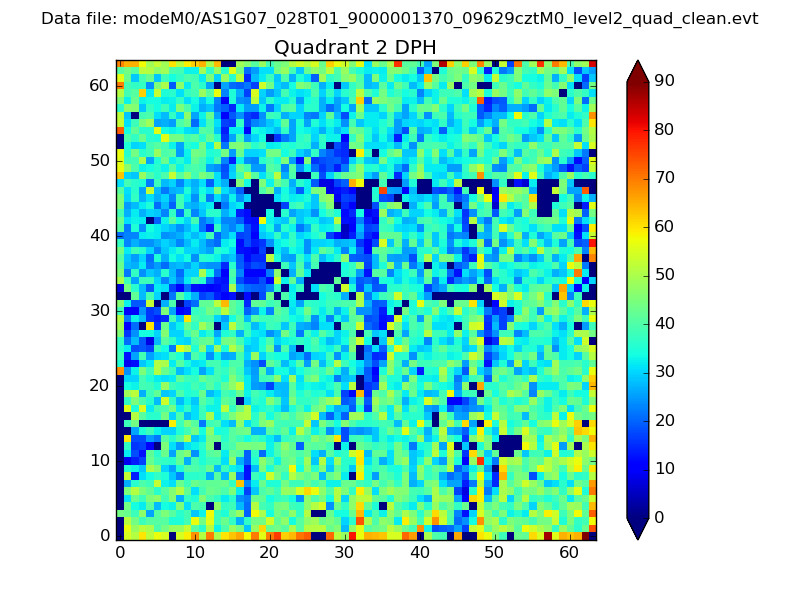
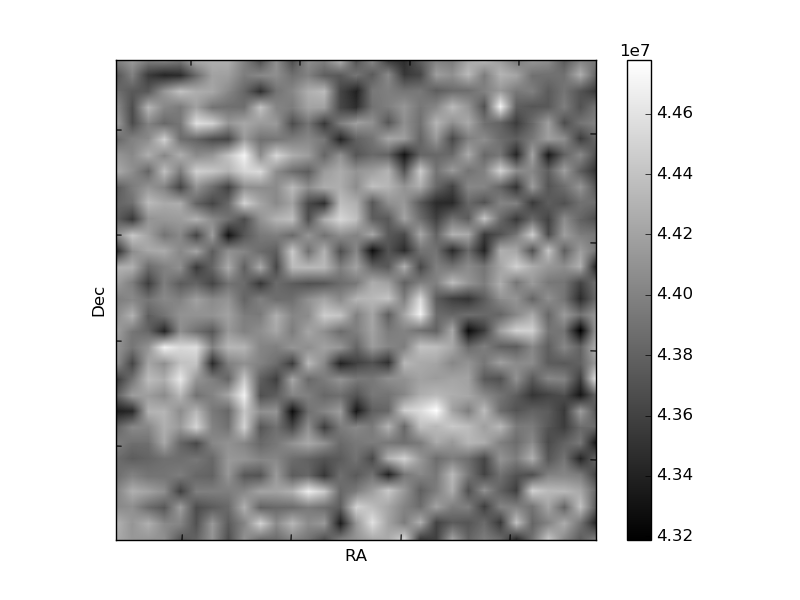
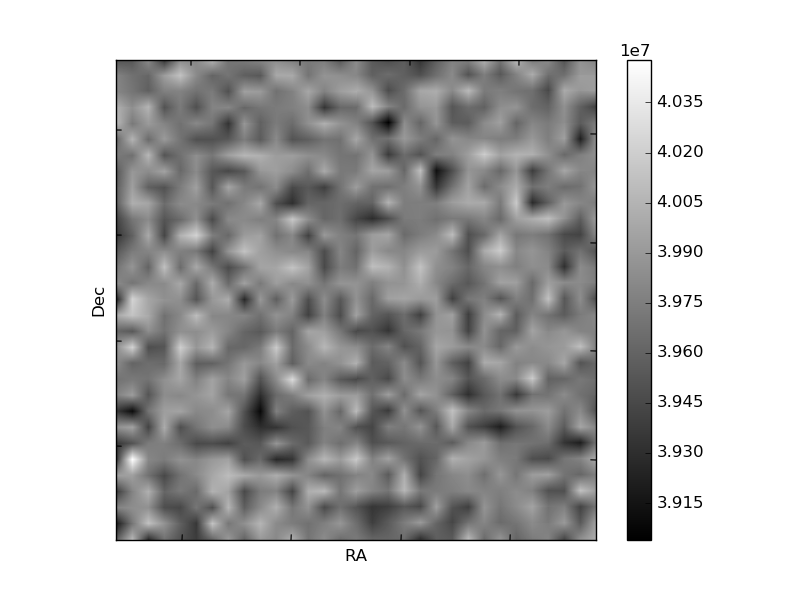
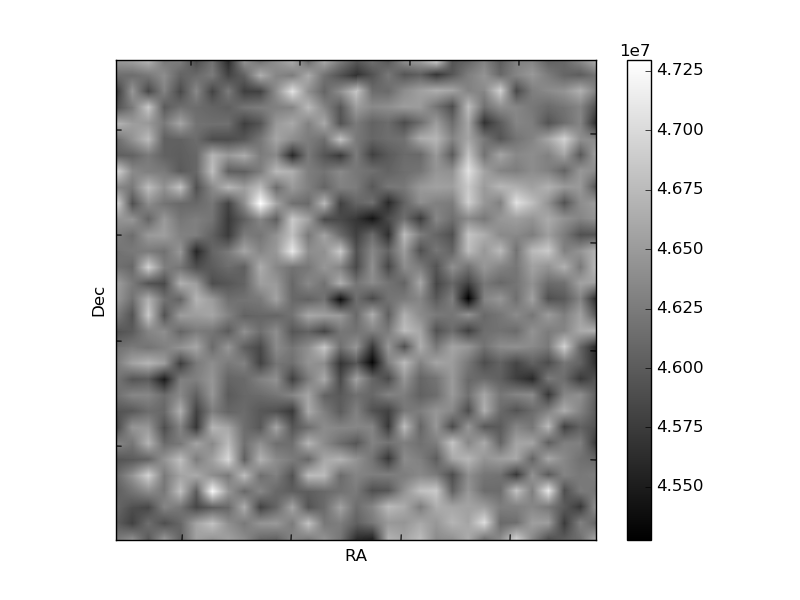
Histogram calculated using DETX and DETY for each event in the final _common_clean file
| Quadrant A | 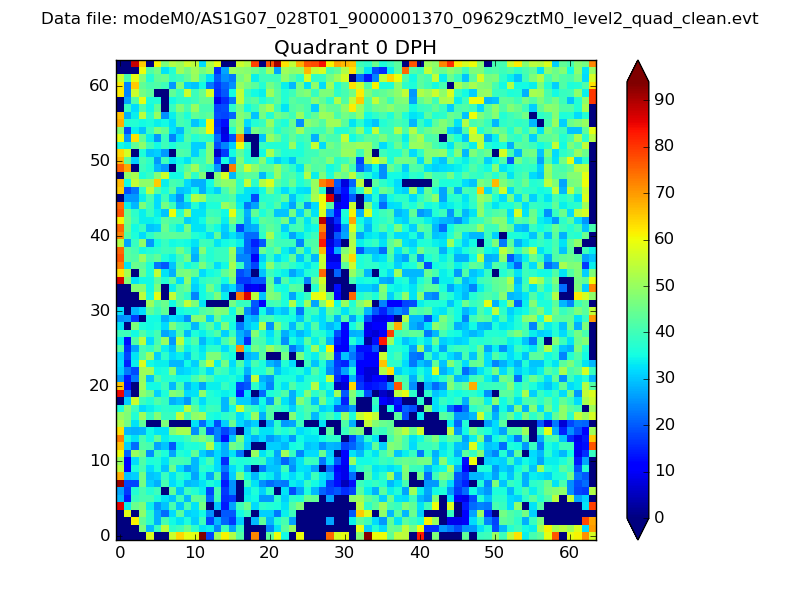 |
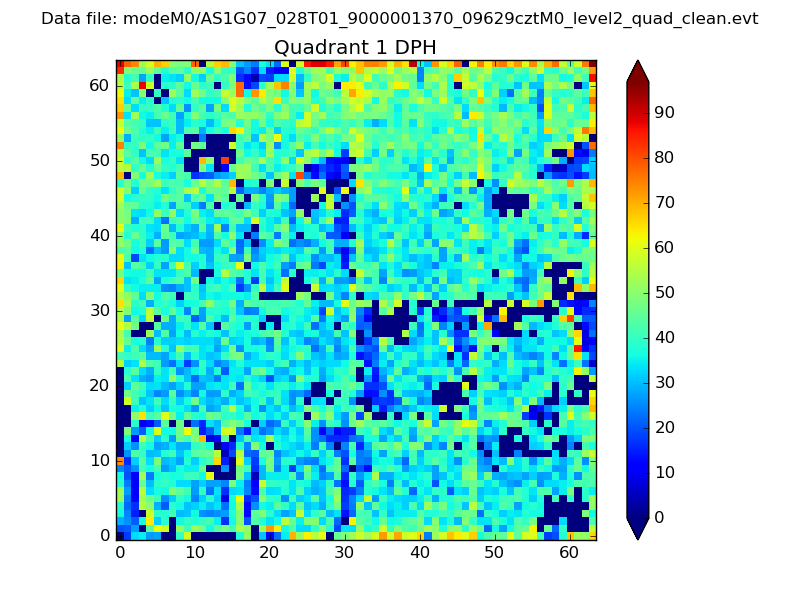 |
Quadrant B |
|---|---|---|---|
| Quadrant D | 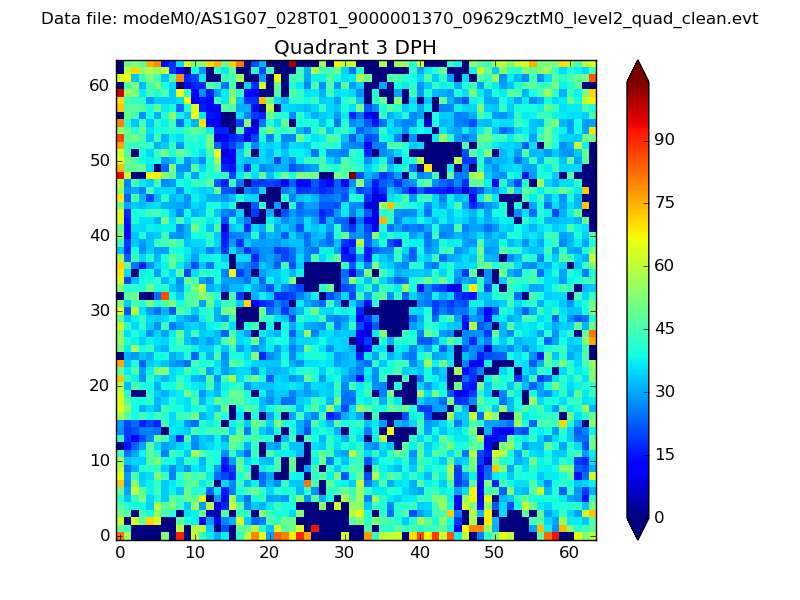 |
 |
Quadrant C |
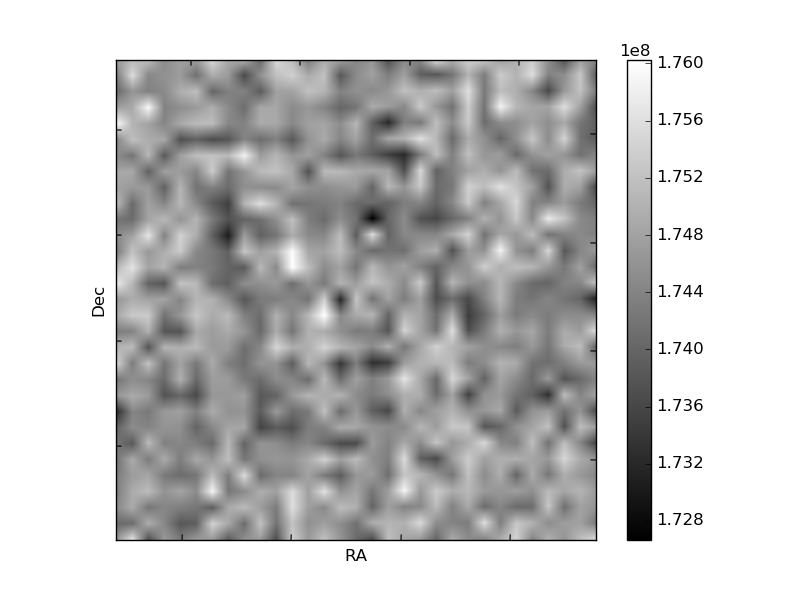
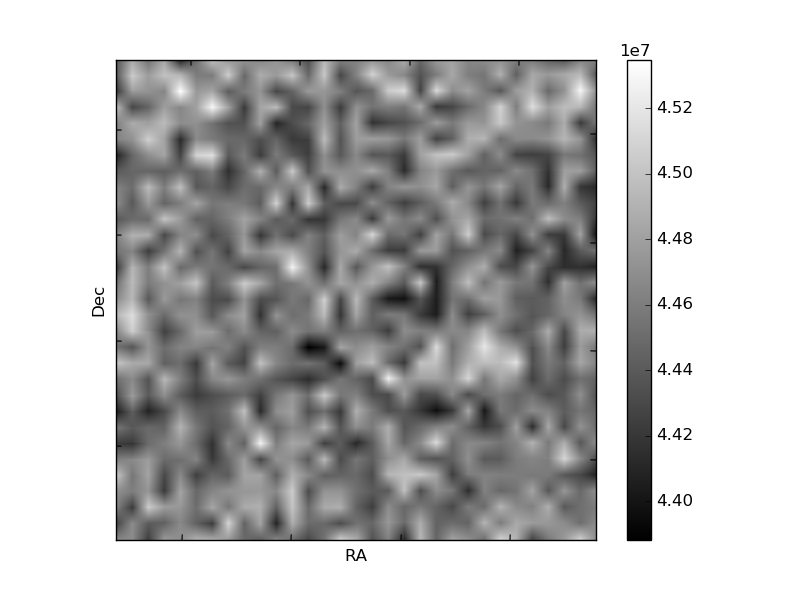
| Plot type | Count rate plots | Images |
|---|---|---|
| Comparison with Poisson distribution Blue bars denote a histogram of data divided into 1 sec bins. Red curve is a Poisson curve with rate = median count rate of data. |
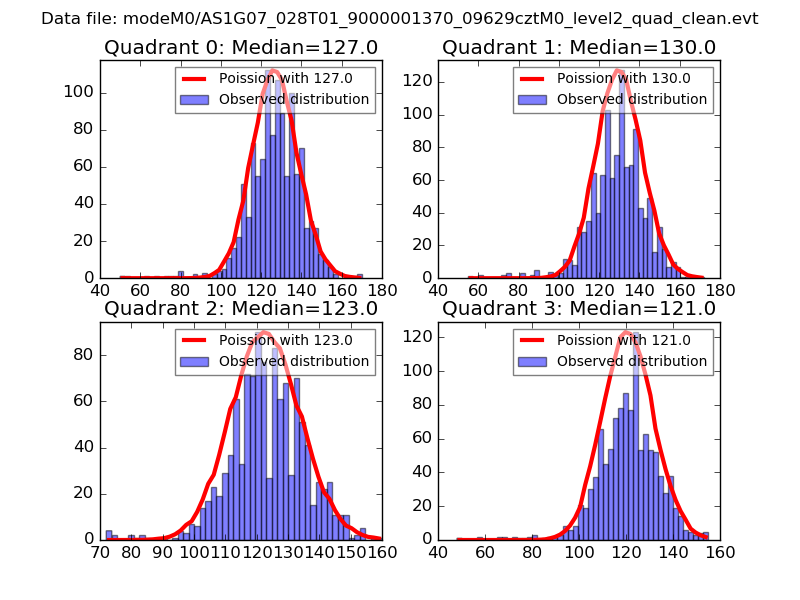 |
 |
| Quadrant-wise count rates Data is divided into 100 sec bins |
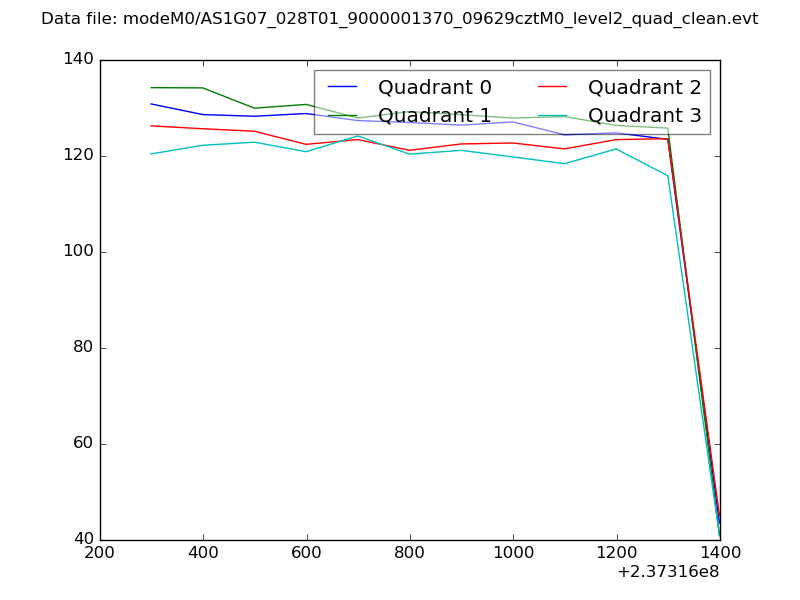 |
|
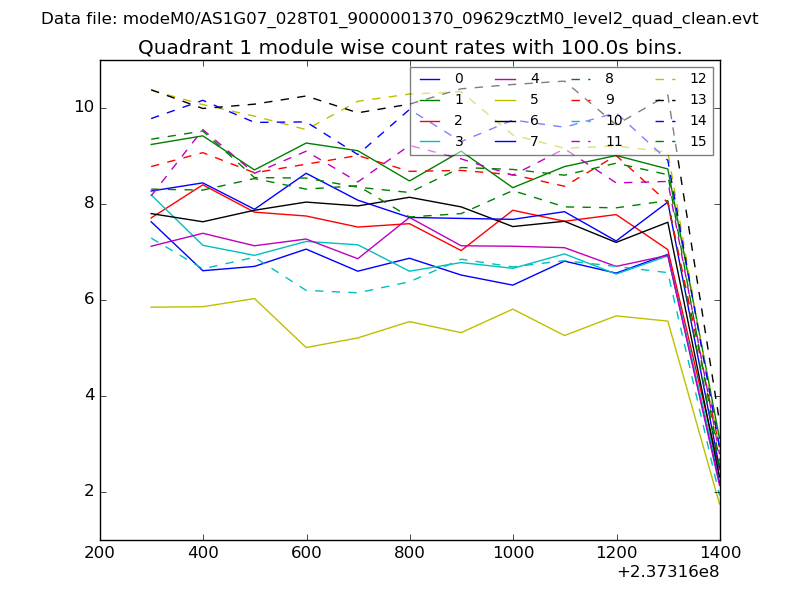
| Module-wise count rates for Quadrant A Data is divided into 100 sec bins |
 |
 |
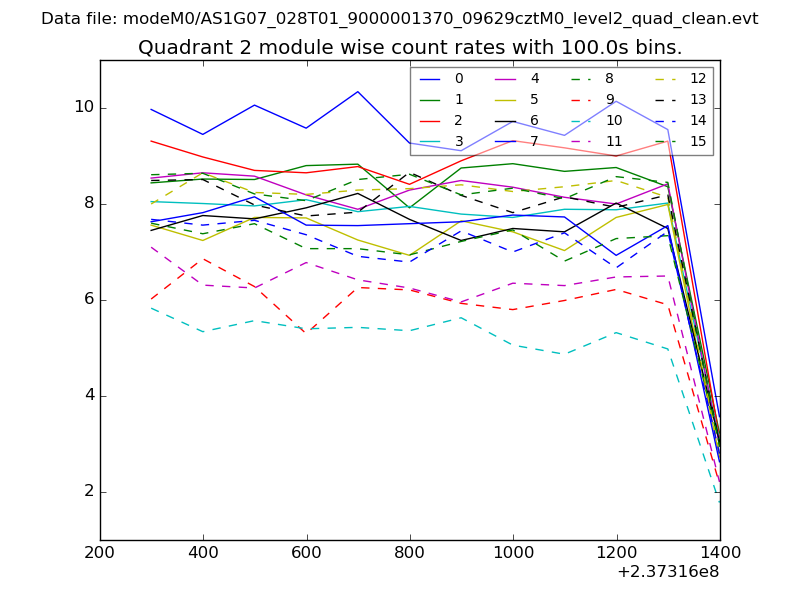
| Module-wise count rates for Quadrant B Data is divided into 100 sec bins |
 |
 |
| Module-wise count rates for Quadrant C Data is divided into 100 sec bins |
 |
 |
| Module-wise count rates for Quadrant D Data is divided into 100 sec bins |
 |
 |
| Parameter | Plot |
|---|---|
| CZT HV Monitor | 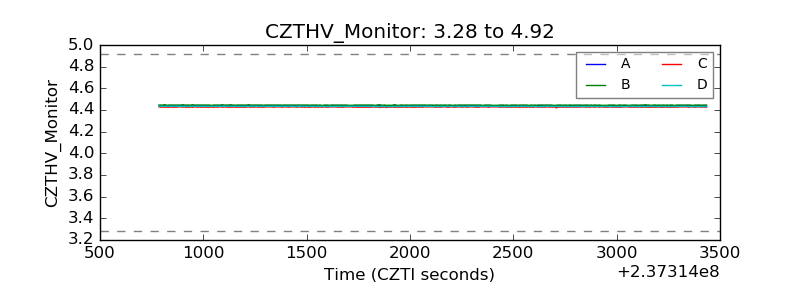 |
| D_VDD | 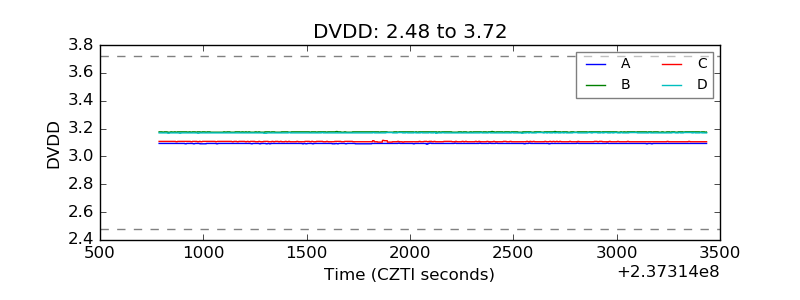 |
| Temperature 1 | 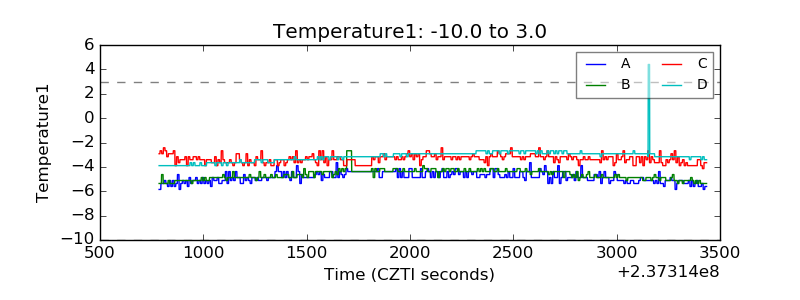 |
| Veto HV Monitor | 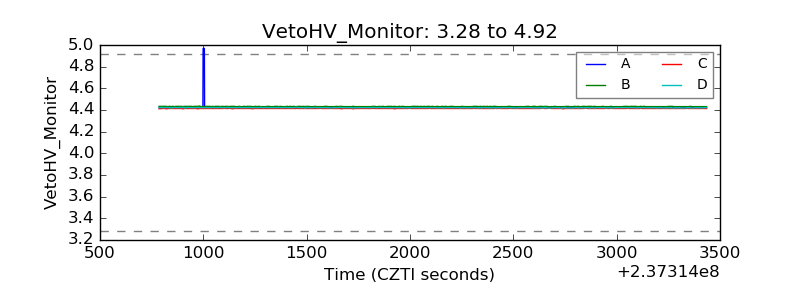 |
| Veto LLD |  |
| Alpha Counter | 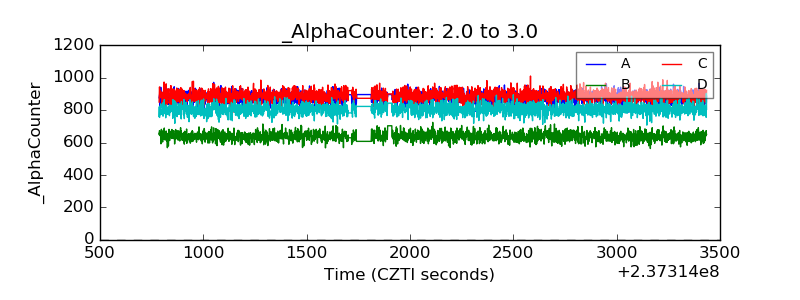 |
| _CPM_Rate | 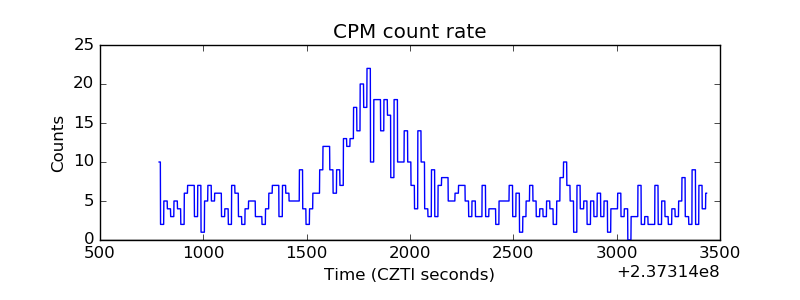 |
| CZT Counter | 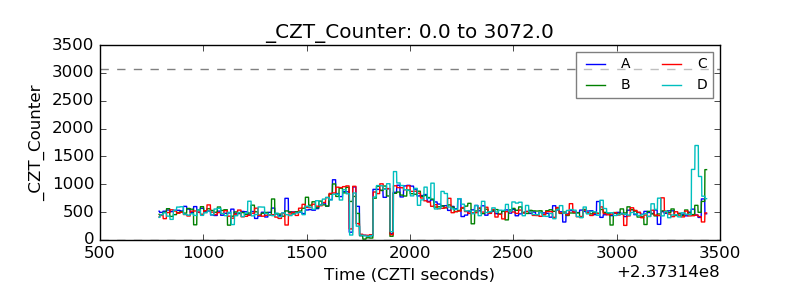 |
| +2.5 Volts monitor |  |
| +5 Volts monitor |  |
| _ROLL_ROT | 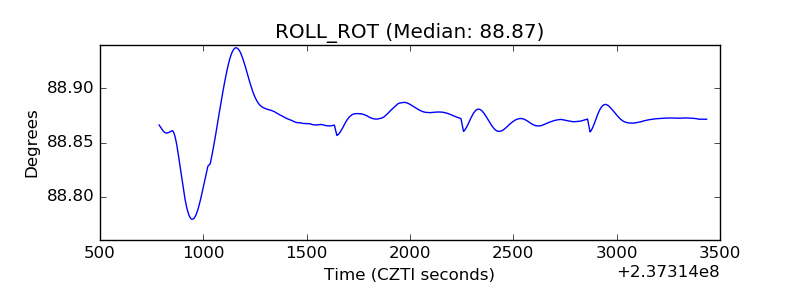 |
| _Roll_DEC | 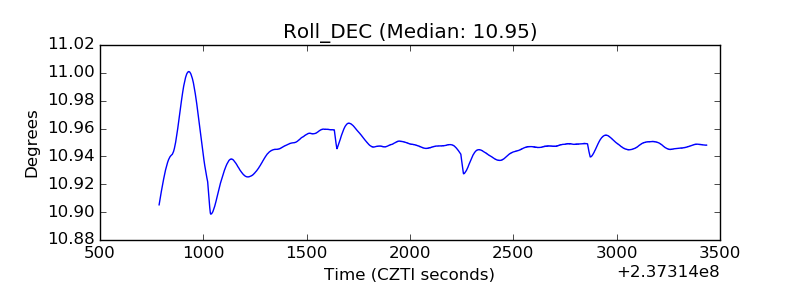 |
| _Roll_RA | 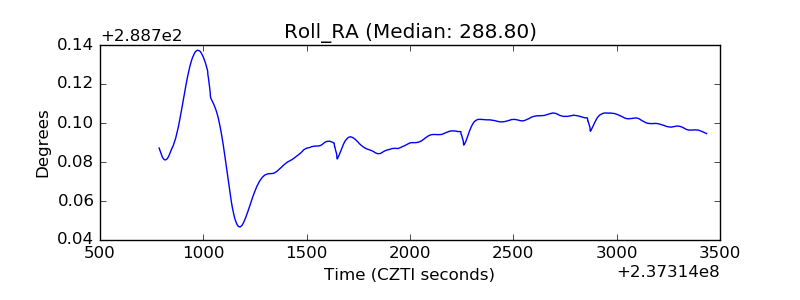 |
| Veto Counter |  |