| Param | Original file | Final file |
|---|---|---|
| Filename | modeM0/AS1G07_028T01_9000001370_09630cztM0_level2.evt | modeM0/AS1G07_028T01_9000001370_09630cztM0_level2_quad_clean.evt |
| Size (bytes) | 384,960,960 | 81,538,560 |
| Size | 367.1 MB | 77.8 MB |
| Events in quadrant A | 2,777,474 | 526,227 |
| Events in quadrant B | 2,736,536 | 526,722 |
| Events in quadrant C | 2,678,180 | 515,690 |
| Events in quadrant D | 3,071,701 | 496,630 |
| Mode M9 | |||
|---|---|---|---|
| Quadrant | BADHDUFLAG | Total packets | Discarded packets |
| A | 0 | 1 | 0 |
| B | 0 | 1 | 0 |
| C | 0 | 1 | 0 |
| D | 0 | 1 | 0 |
| Mode M0 | |||
|---|---|---|---|
| Quadrant | BADHDUFLAG | Total packets | Discarded packets |
| A | 0 | 16035 | 3956 |
| B | 0 | 16139 | 4223 |
| C | 0 | 16168 | 4228 |
| D | 0 | 17703 | 4784 |
| Mode SS | |||
|---|---|---|---|
| Quadrant | BADHDUFLAG | Total packets | Discarded packets |
| A | 0 | 153 | 41 |
| B | 0 | 154 | 30 |
| C | 0 | 154 | 36 |
| D | 0 | 154 | 34 |
| Quadrant | Total seconds | Saturated seconds | Saturation percentage |
|---|---|---|---|
| A | 5825 | 133 | 2.283262% |
| B | 5726 | 138 | 2.410059% |
| C | 5781 | 104 | 1.798997% |
| D | 5691 | 109 | 1.915305% |
Noise dominated data is calculated using 1-second bins in cleaned event files. If a bin has >2000 counts, and if more than 50% of those come from <1% of pixels, then it is considered to be noise-dominated and hence unusable.
| Quadrant | # 1 sec bins | Bins with >0 counts | Bins with >2000 counts | High rate bins dominated by noise | Noise dominated (total time) | Noise dominated (detector-on time) | Marked lightcurve |
|---|---|---|---|---|---|---|---|
| A | 7637 | 6855 | 0 | 0 | 0.00% | 0.00% | 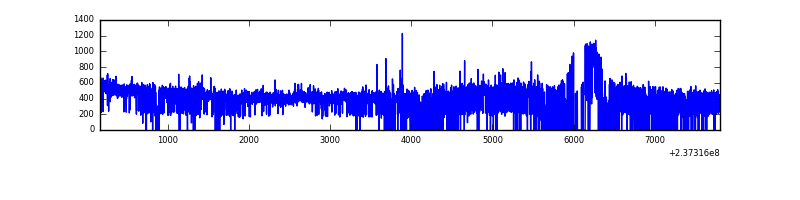 |
| B | 7637 | 6762 | 2 | 2 | 0.03% | 0.03% | 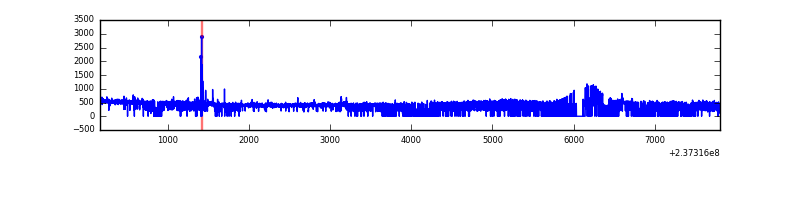 |
| C | 7637 | 6792 | 0 | 0 | 0.00% | 0.00% | 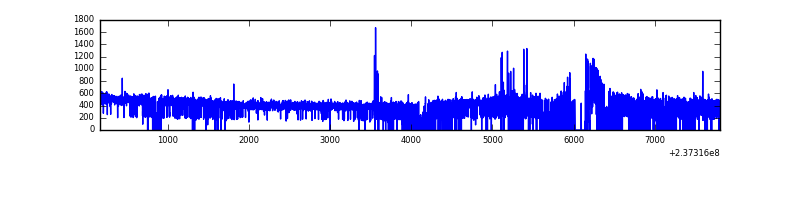 |
| D | 7637 | 6695 | 16 | 16 | 0.21% | 0.24% | 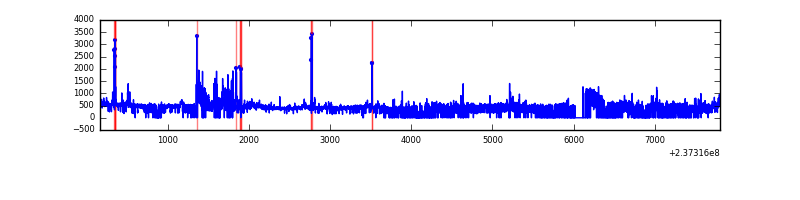 |
Top three noisy pixels from each quadrant. If the there are fewer than three noisy pixels in the level2.evt file, extra rows are filled as -1
| Pixel properties | Quadrant properties | ||||||
|---|---|---|---|---|---|---|---|
| Quadrant | DetID | PixID | Counts | Sigma | Mean | Median | Sigma |
| A | 1 | 162 | 33410 | 225.07 | 707 | 692 | 145.4 |
| A | 1 | 178 | 9701 | 61.97 | 707 | 692 | 145.4 |
| A | 1 | 161 | 9016 | 57.26 | 707 | 692 | 145.4 |
| B | 15 | 85 | 21804 | 156.18 | 692 | 675 | 135.3 |
| B | 12 | 111 | 15632 | 110.56 | 692 | 675 | 135.3 |
| B | 11 | 111 | 12781 | 89.49 | 692 | 675 | 135.3 |
| C | 4 | 254 | 27065 | 166.11 | 677 | 681 | 158.8 |
| C | 13 | 61 | 4908 | 26.61 | 677 | 681 | 158.8 |
| C | 8 | 128 | 3527 | 17.91 | 677 | 681 | 158.8 |
| D | 7 | 46 | 264192 | 1634.18 | 668 | 651 | 161.3 |
| D | 1 | 52 | 142427 | 879.13 | 668 | 651 | 161.3 |
| D | 13 | 104 | 47567 | 290.92 | 668 | 651 | 161.3 |
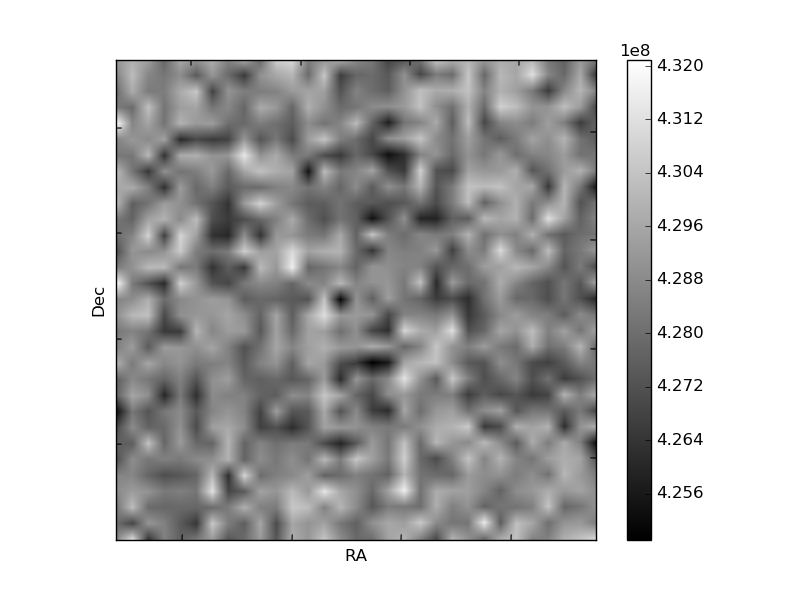
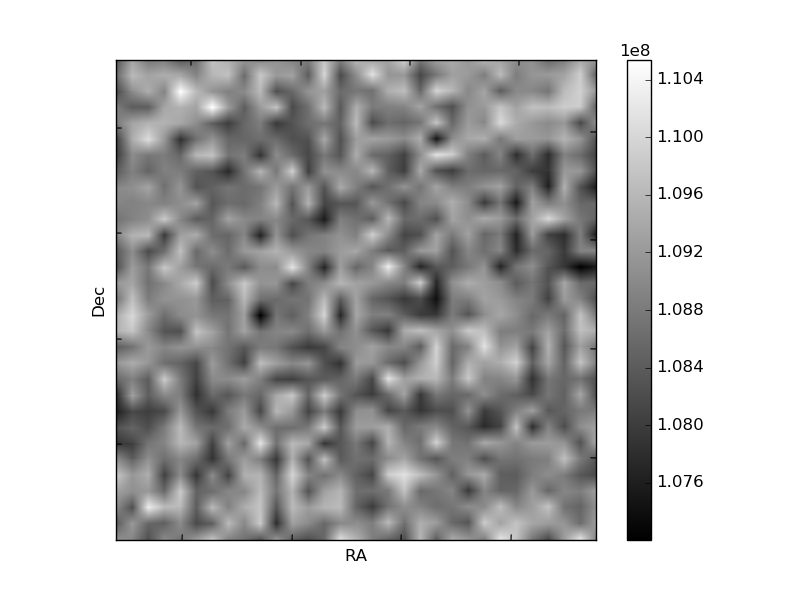
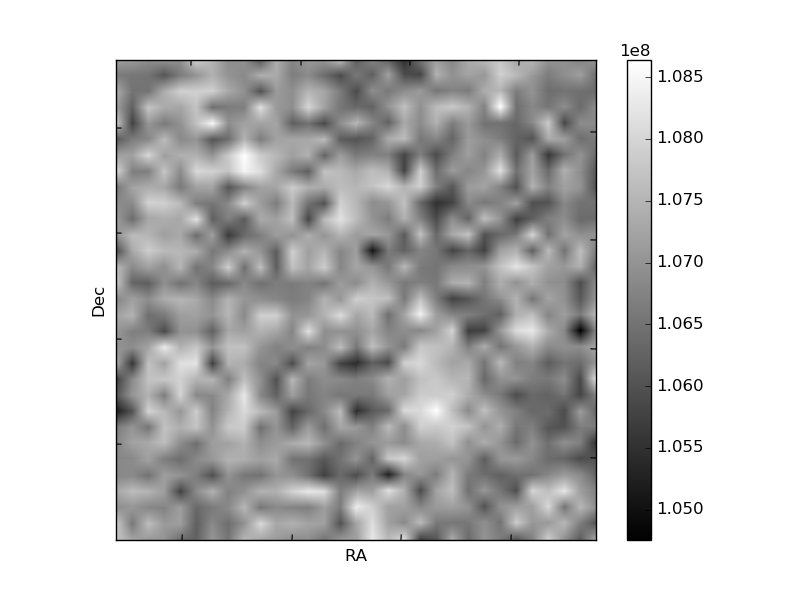
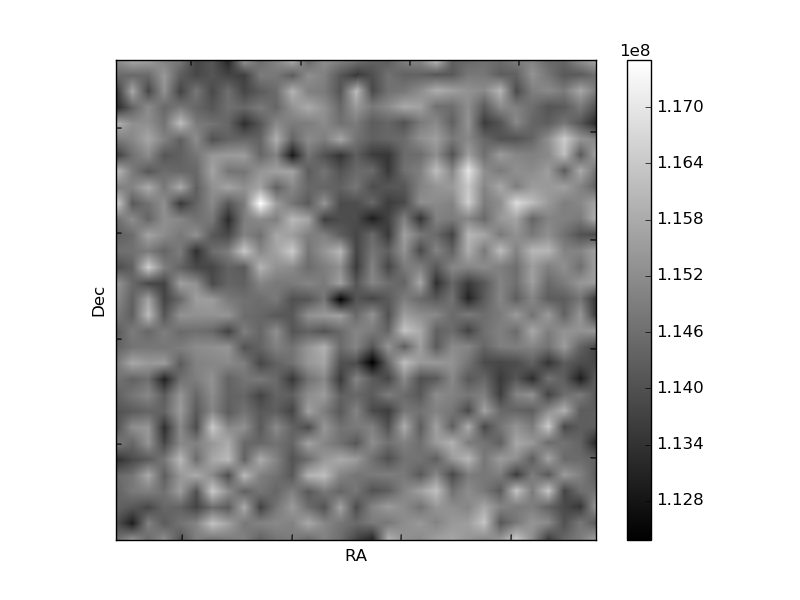
Histogram calculated using DETX and DETY for each event in the final _common_clean file
| Quadrant A | 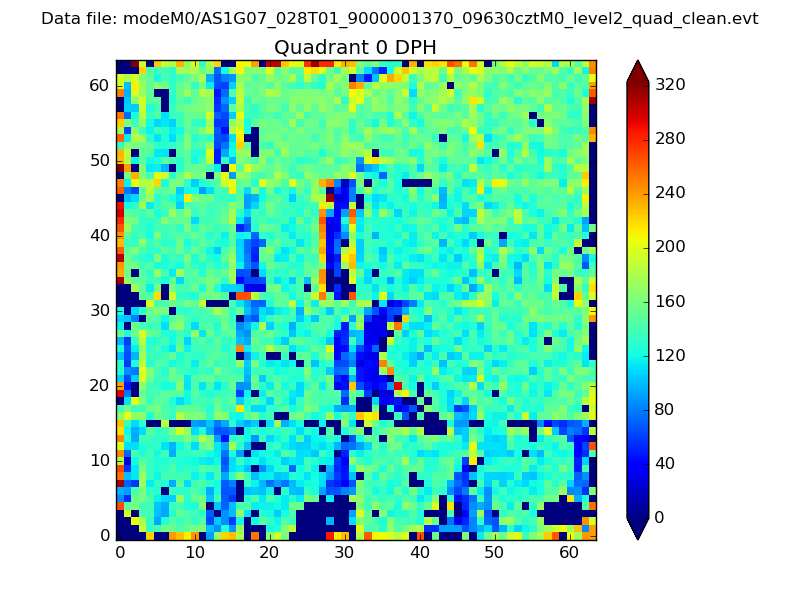 |
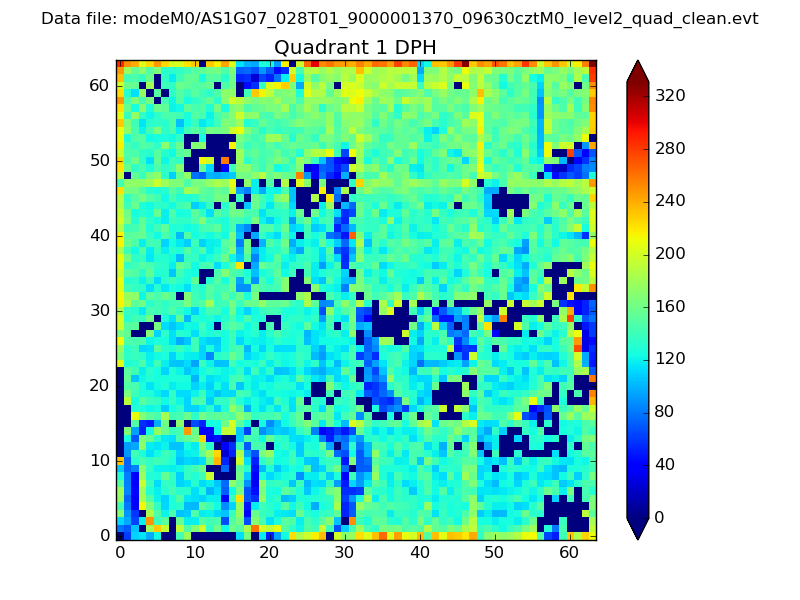 |
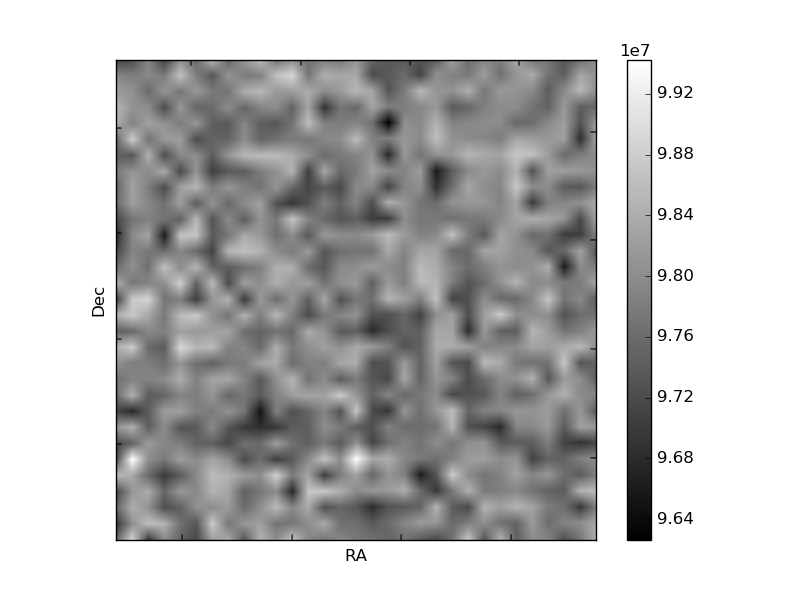
Quadrant B |
|---|---|---|---|
| Quadrant D |  |
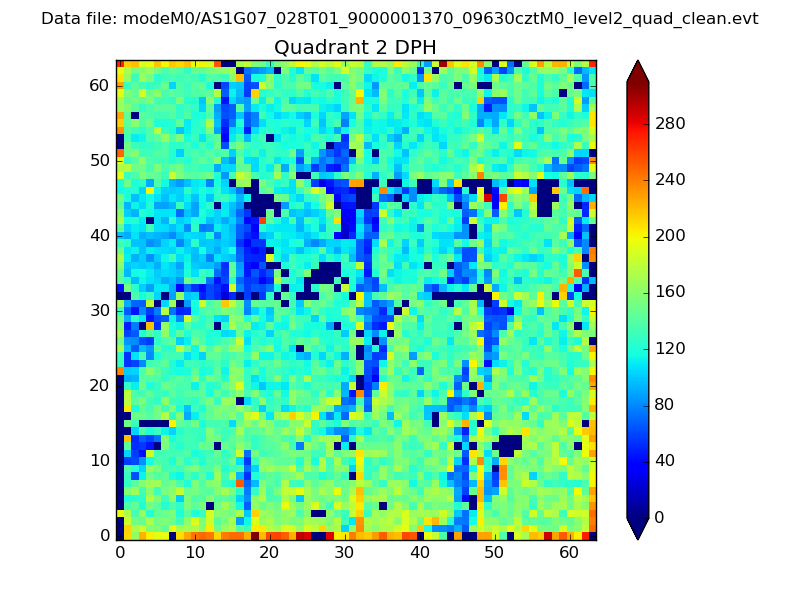 |
Quadrant C |
| Plot type | Count rate plots | Images |
|---|---|---|
| Comparison with Poisson distribution Blue bars denote a histogram of data divided into 1 sec bins. Red curve is a Poisson curve with rate = median count rate of data. |
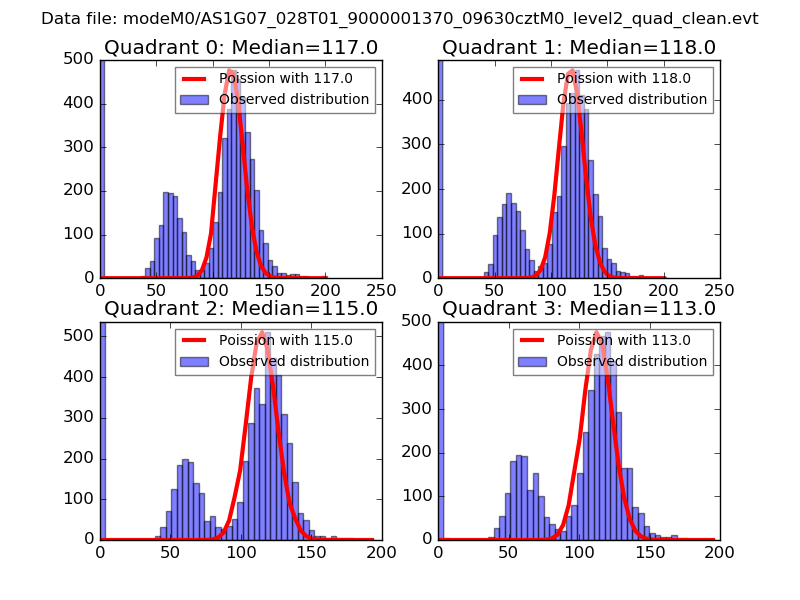 |
 |
| Quadrant-wise count rates Data is divided into 100 sec bins |
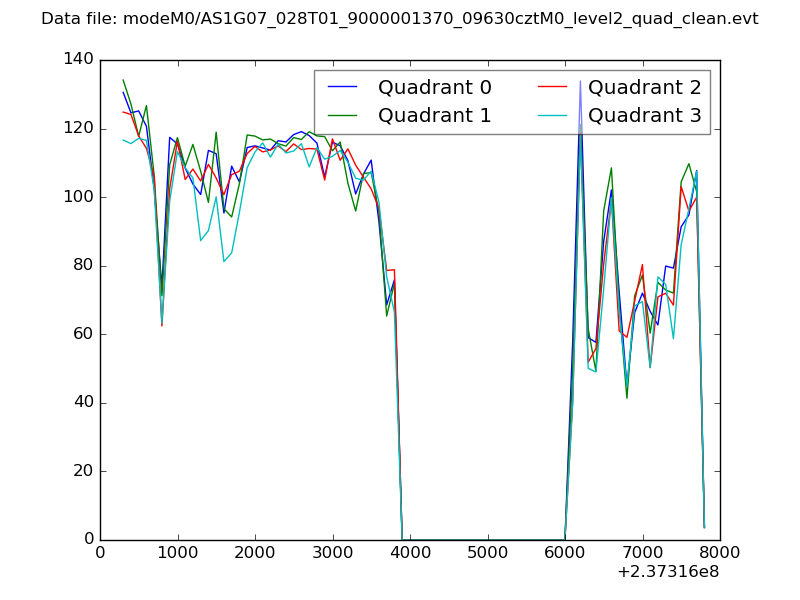 |
|
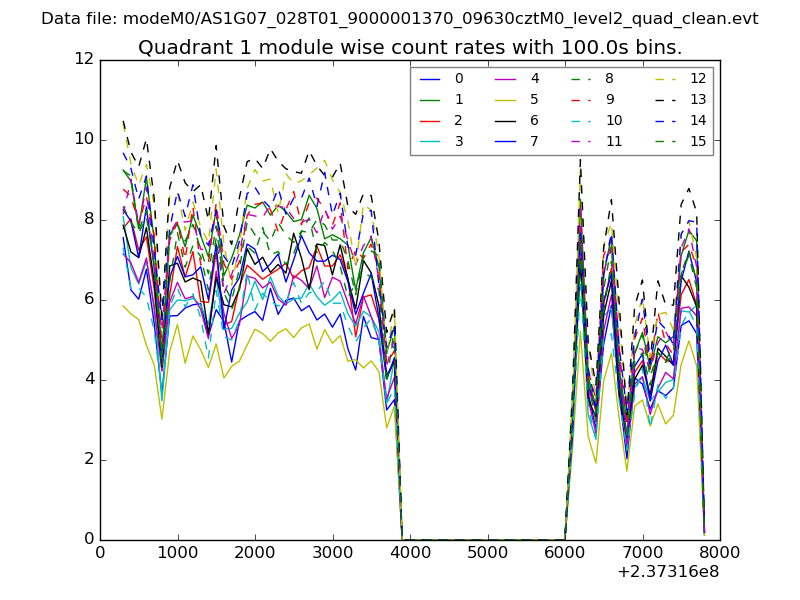
| Module-wise count rates for Quadrant A Data is divided into 100 sec bins |
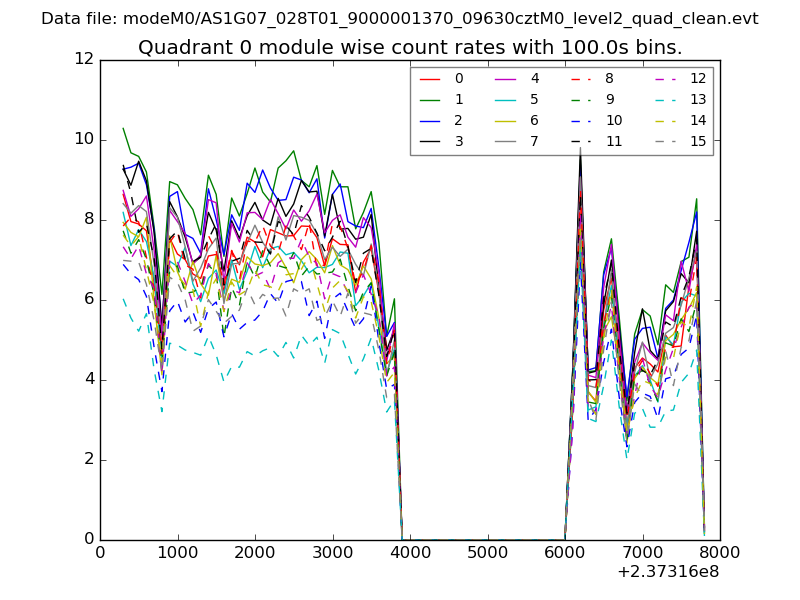 |
 |
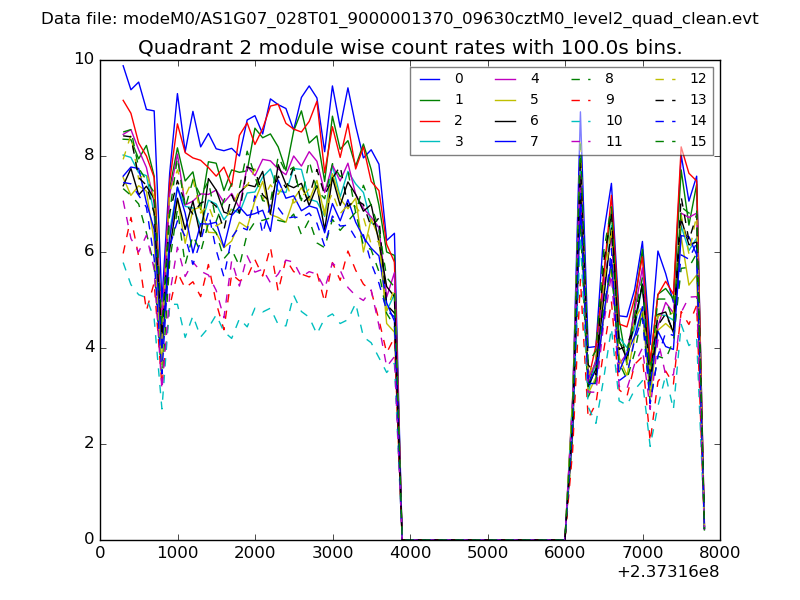
| Module-wise count rates for Quadrant B Data is divided into 100 sec bins |
 |
 |
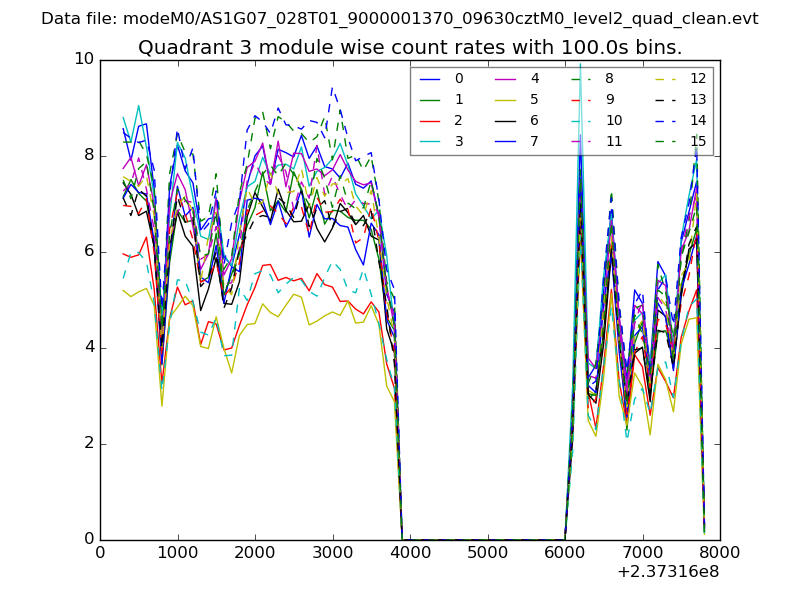
| Module-wise count rates for Quadrant C Data is divided into 100 sec bins |
 |
 |
| Module-wise count rates for Quadrant D Data is divided into 100 sec bins |
 |
 |
| Parameter | Plot |
|---|---|
| CZT HV Monitor | 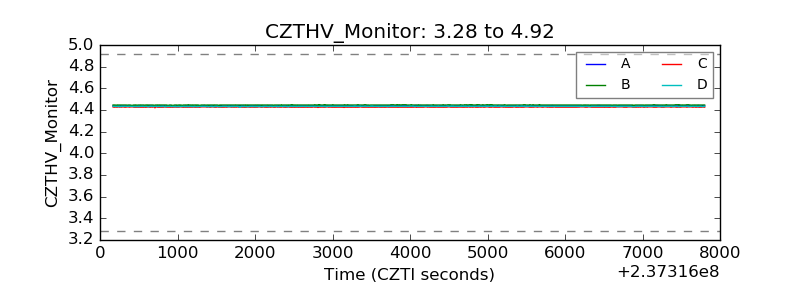 |
| D_VDD | 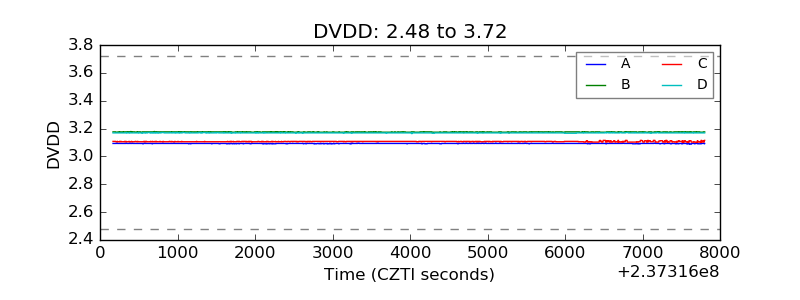 |
| Temperature 1 | 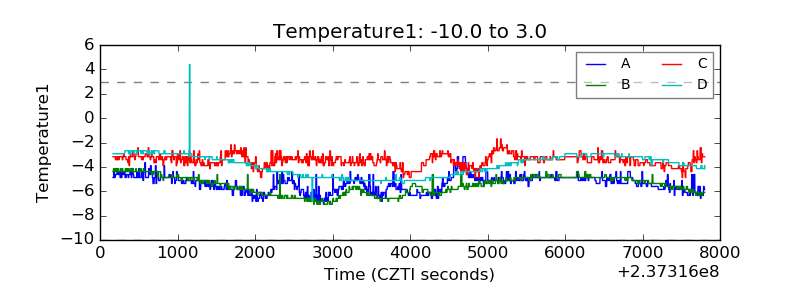 |
| Veto HV Monitor | 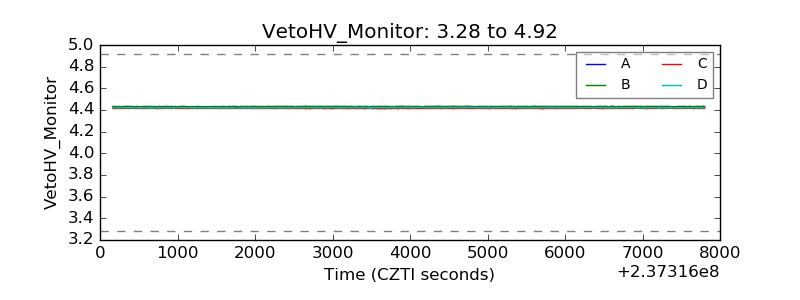 |
| Veto LLD | 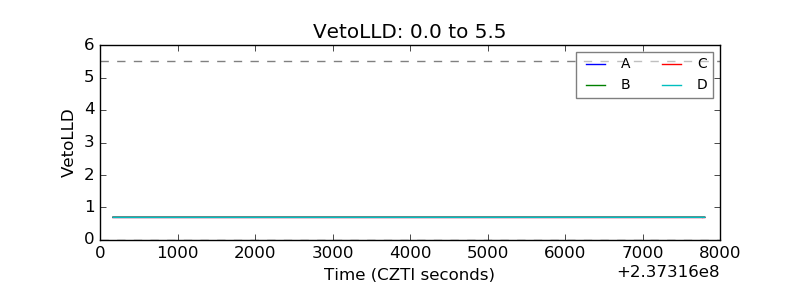 |
| Alpha Counter | 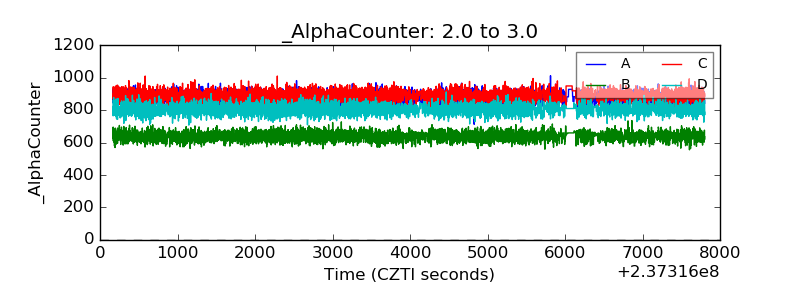 |
| _CPM_Rate | 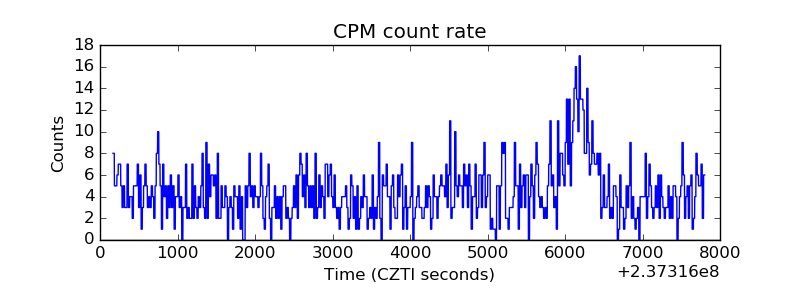 |
| CZT Counter | 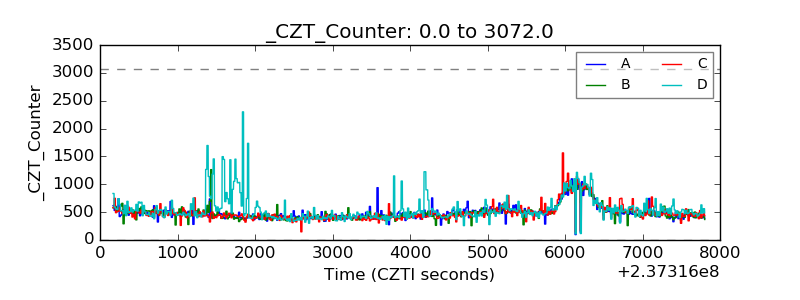 |
| +2.5 Volts monitor |  |
| +5 Volts monitor | 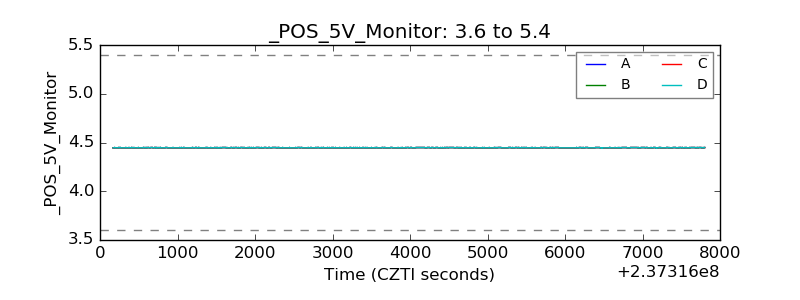 |
| _ROLL_ROT | 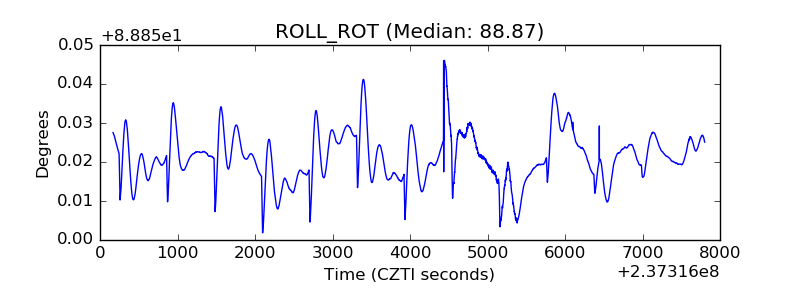 |
| _Roll_DEC | 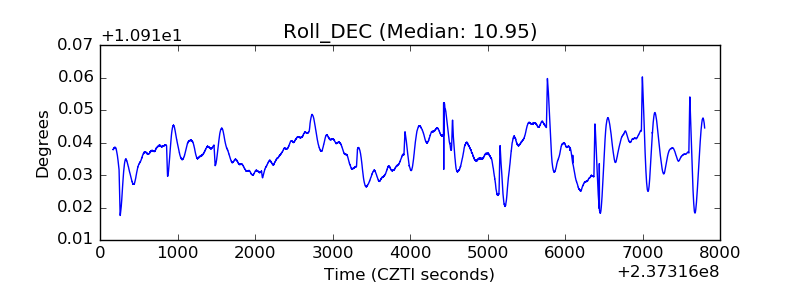 |
| _Roll_RA | 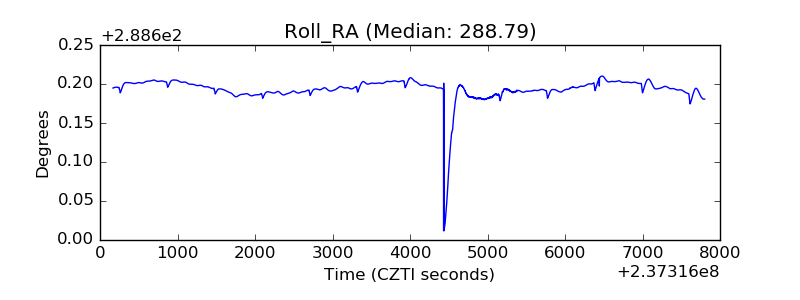 |
| Veto Counter | 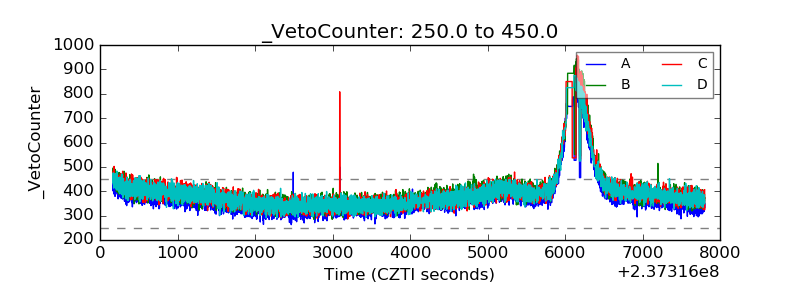 |