| Param | Original file | Final file |
|---|---|---|
| Filename | modeM0/AS1G07_028T01_9000001370_09631cztM0_level2.evt | modeM0/AS1G07_028T01_9000001370_09631cztM0_level2_quad_clean.evt |
| Size (bytes) | 433,615,680 | 90,054,720 |
| Size | 413.5 MB | 85.9 MB |
| Events in quadrant A | 3,008,894 | 576,780 |
| Events in quadrant B | 3,074,356 | 585,142 |
| Events in quadrant C | 3,131,697 | 576,933 |
| Events in quadrant D | 3,490,743 | 551,890 |
| Mode M9 | |||
|---|---|---|---|
| Quadrant | BADHDUFLAG | Total packets | Discarded packets |
| A | 0 | 5 | 0 |
| B | 0 | 5 | 1 |
| C | 0 | 5 | 0 |
| D | 0 | 5 | 1 |
| Mode M0 | |||
|---|---|---|---|
| Quadrant | BADHDUFLAG | Total packets | Discarded packets |
| A | 0 | 16867 | 3681 |
| B | 0 | 16871 | 3570 |
| C | 0 | 17031 | 3434 |
| D | 0 | 18657 | 4225 |
| Mode SS | |||
|---|---|---|---|
| Quadrant | BADHDUFLAG | Total packets | Discarded packets |
| A | 0 | 158 | 34 |
| B | 0 | 158 | 24 |
| C | 0 | 158 | 36 |
| D | 0 | 157 | 25 |
| Quadrant | Total seconds | Saturated seconds | Saturation percentage |
|---|---|---|---|
| A | 6199 | 264 | 4.258751% |
| B | 6246 | 325 | 5.203330% |
| C | 6316 | 288 | 4.559848% |
| D | 6179 | 306 | 4.952258% |
Noise dominated data is calculated using 1-second bins in cleaned event files. If a bin has >2000 counts, and if more than 50% of those come from <1% of pixels, then it is considered to be noise-dominated and hence unusable.
| Quadrant | # 1 sec bins | Bins with >0 counts | Bins with >2000 counts | High rate bins dominated by noise | Noise dominated (total time) | Noise dominated (detector-on time) | Marked lightcurve |
|---|---|---|---|---|---|---|---|
| A | 8267 | 7167 | 0 | 0 | 0.00% | 0.00% | 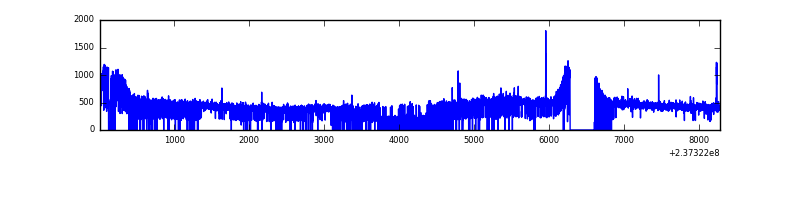 |
| B | 8268 | 7163 | 0 | 0 | 0.00% | 0.00% | 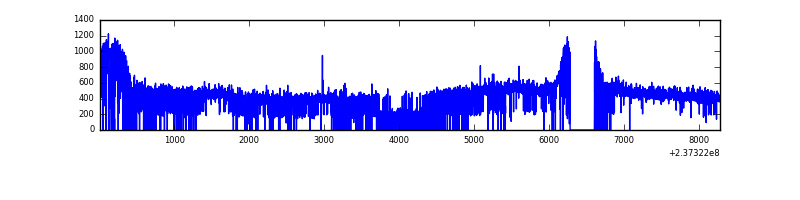 |
| C | 8268 | 7202 | 0 | 0 | 0.00% | 0.00% | 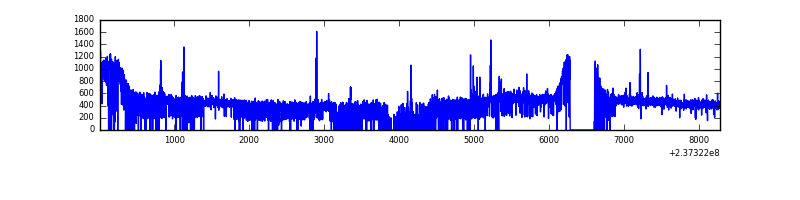 |
| D | 8268 | 7107 | 28 | 28 | 0.34% | 0.39% | 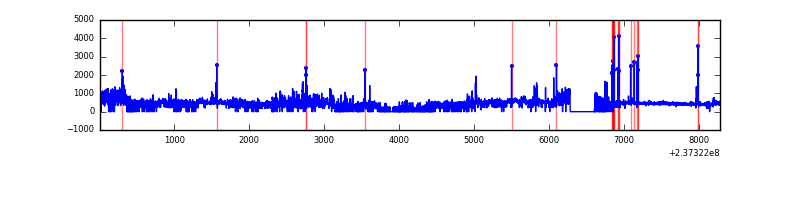 |
Top three noisy pixels from each quadrant. If the there are fewer than three noisy pixels in the level2.evt file, extra rows are filled as -1
| Pixel properties | Quadrant properties | ||||||
|---|---|---|---|---|---|---|---|
| Quadrant | DetID | PixID | Counts | Sigma | Mean | Median | Sigma |
| A | 14 | 111 | 15876 | 94.24 | 778 | 761 | 160.4 |
| A | 0 | 226 | 7035 | 39.12 | 778 | 761 | 160.4 |
| A | 12 | 194 | 6129 | 33.47 | 778 | 761 | 160.4 |
| B | 12 | 111 | 18295 | 113.77 | 785 | 762 | 154.1 |
| B | 0 | 229 | 15125 | 93.2 | 785 | 762 | 154.1 |
| B | 11 | 111 | 14937 | 91.98 | 785 | 762 | 154.1 |
| C | 4 | 254 | 28560 | 149.99 | 784 | 788 | 185.2 |
| C | 14 | 234 | 20441 | 106.14 | 784 | 788 | 185.2 |
| C | 8 | 128 | 11908 | 60.06 | 784 | 788 | 185.2 |
| D | 1 | 52 | 281209 | 1500.71 | 764 | 745 | 186.9 |
| D | 7 | 46 | 112786 | 599.51 | 764 | 745 | 186.9 |
| D | 8 | 195 | 110616 | 587.9 | 764 | 745 | 186.9 |
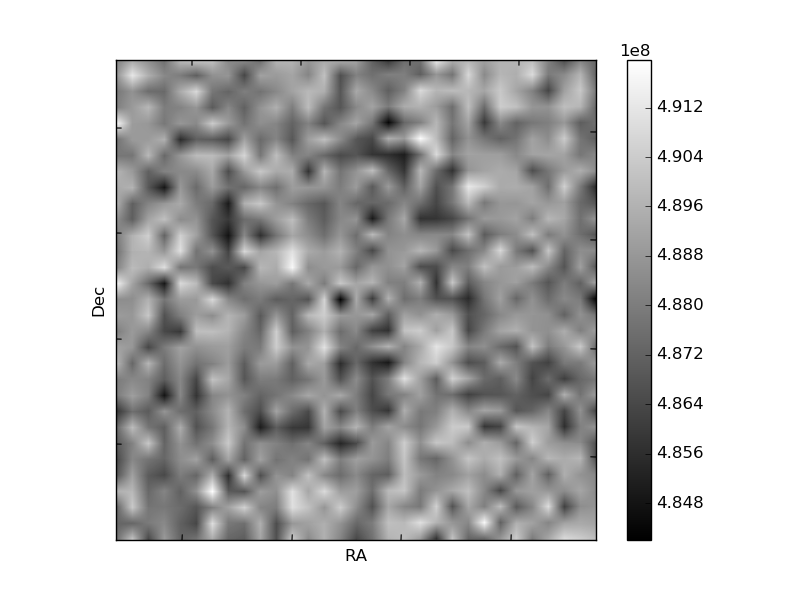
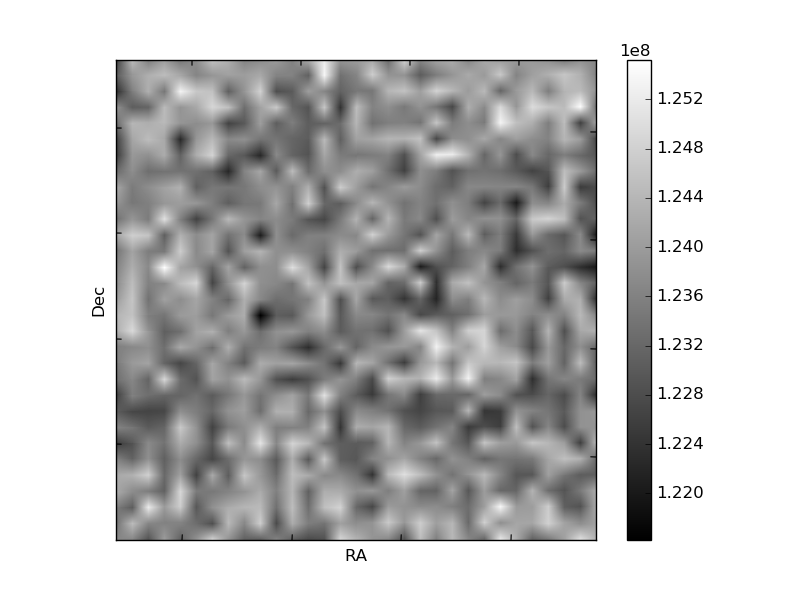
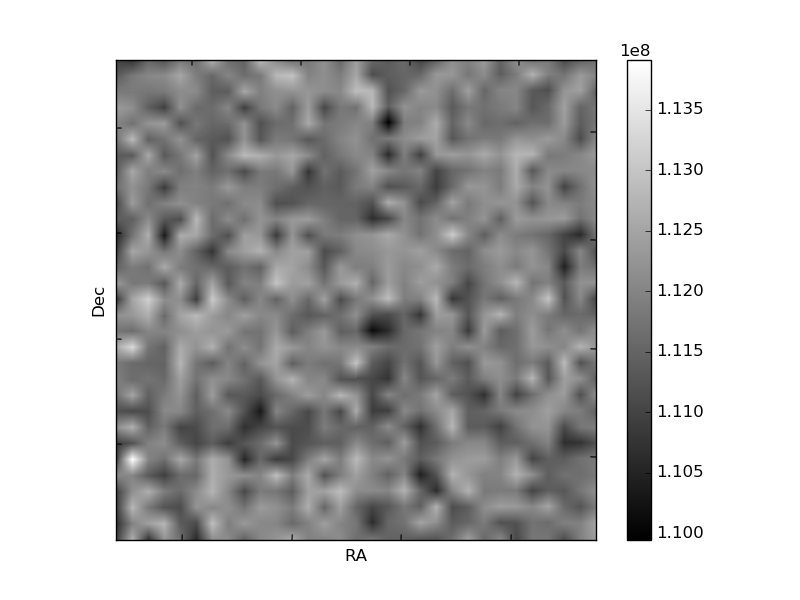
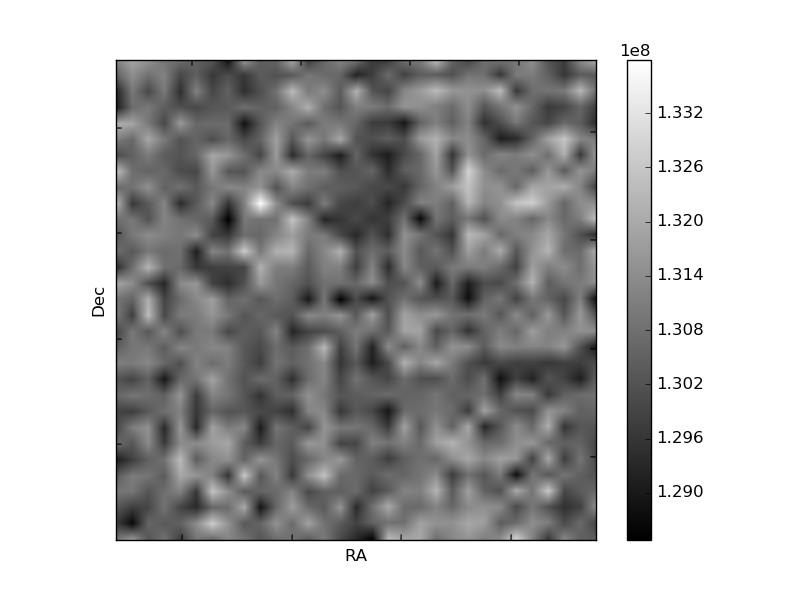
Histogram calculated using DETX and DETY for each event in the final _common_clean file
| Quadrant A | 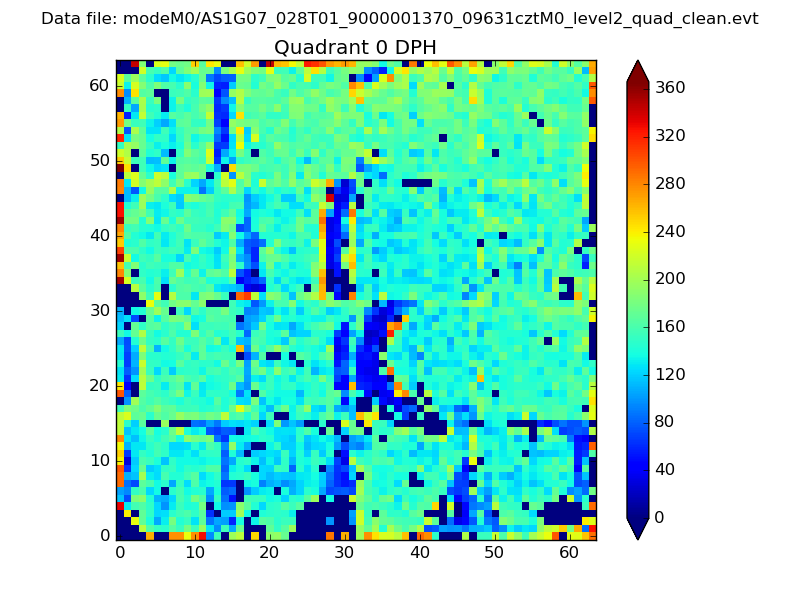 |
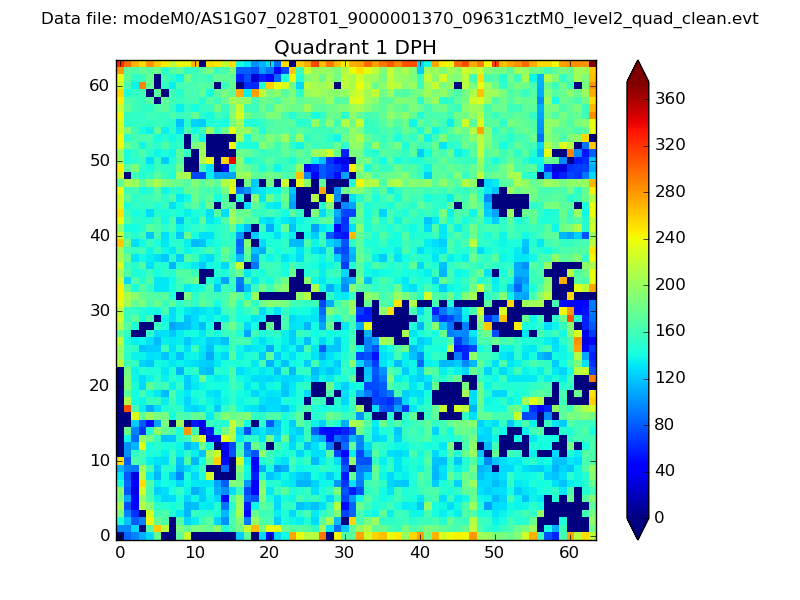 |
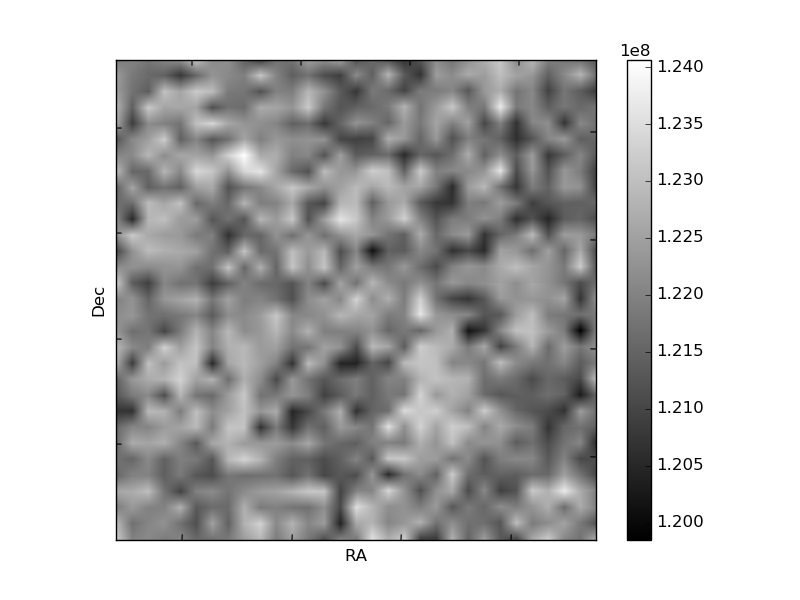
Quadrant B |
|---|---|---|---|
| Quadrant D | 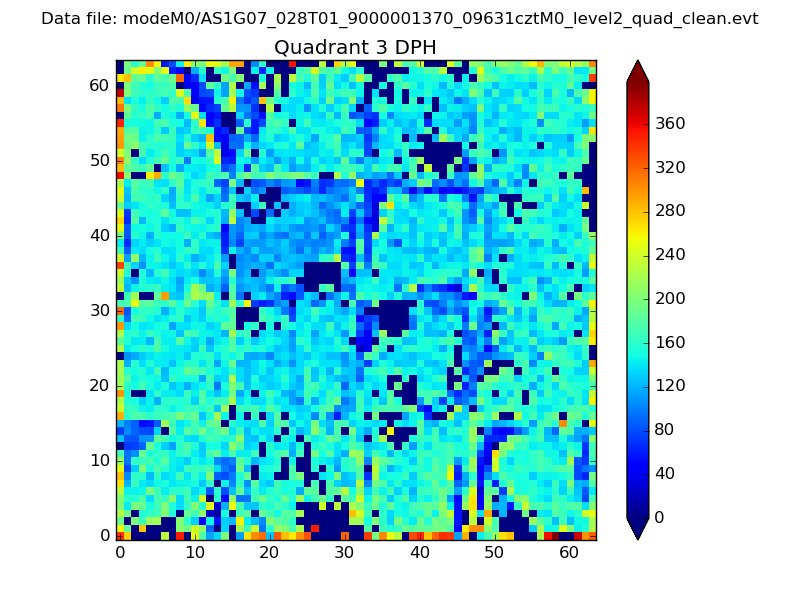 |
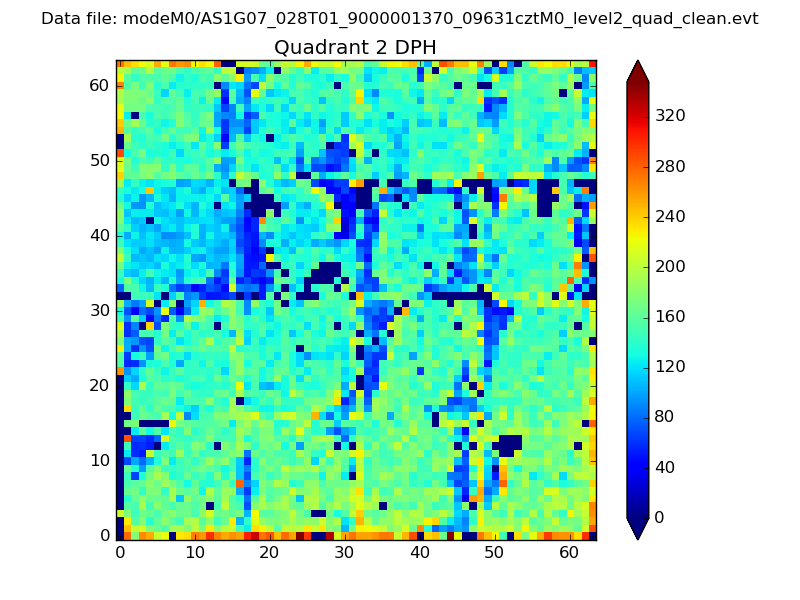 |
Quadrant C |
| Plot type | Count rate plots | Images |
|---|---|---|
| Comparison with Poisson distribution Blue bars denote a histogram of data divided into 1 sec bins. Red curve is a Poisson curve with rate = median count rate of data. |
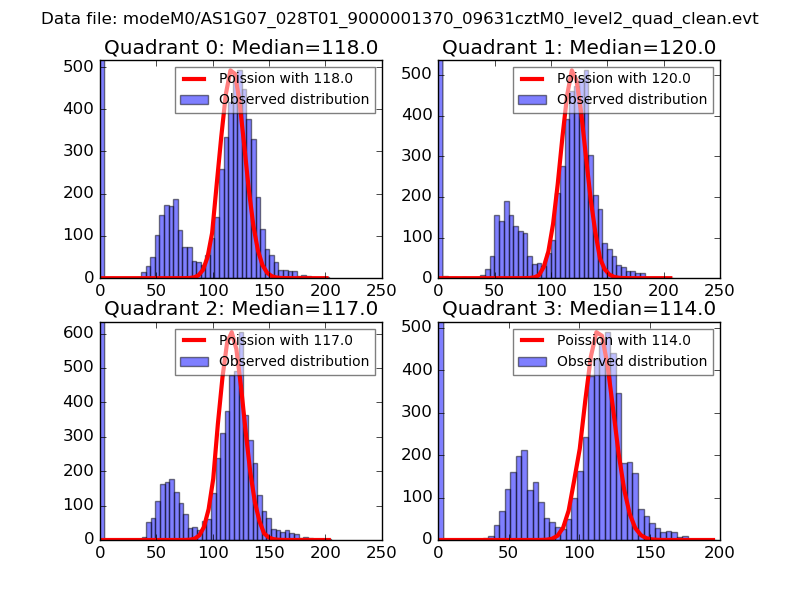 |
 |
| Quadrant-wise count rates Data is divided into 100 sec bins |
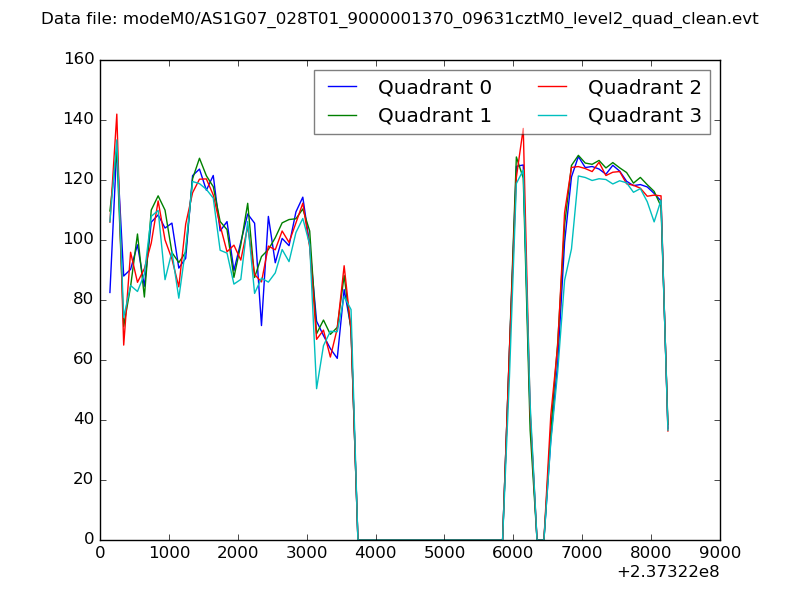 |
|
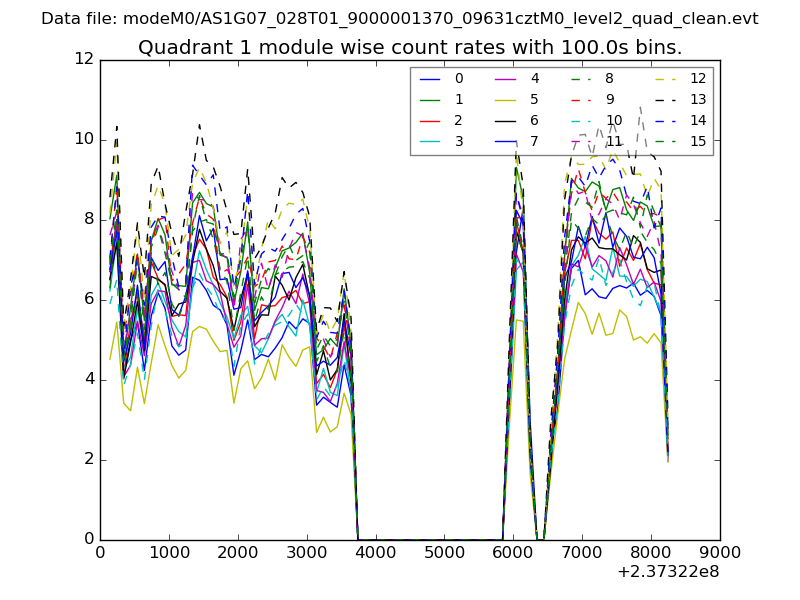
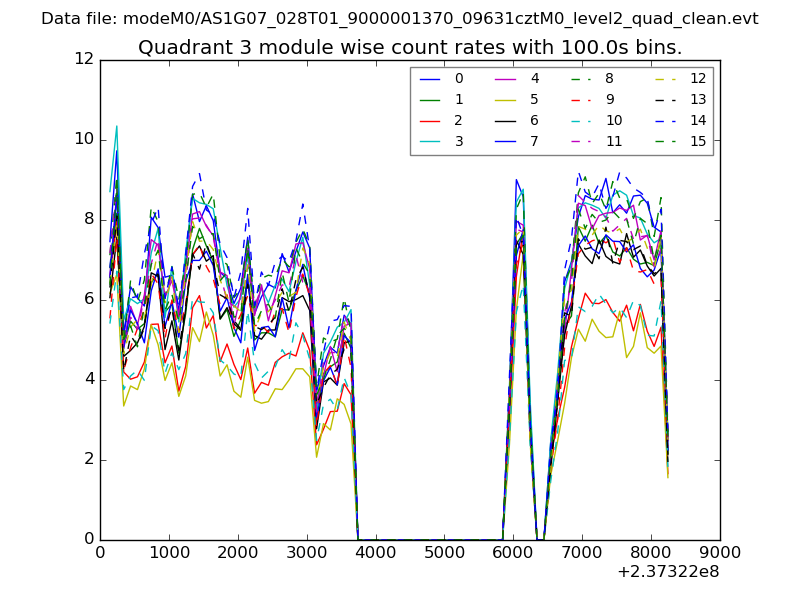
| Module-wise count rates for Quadrant A Data is divided into 100 sec bins |
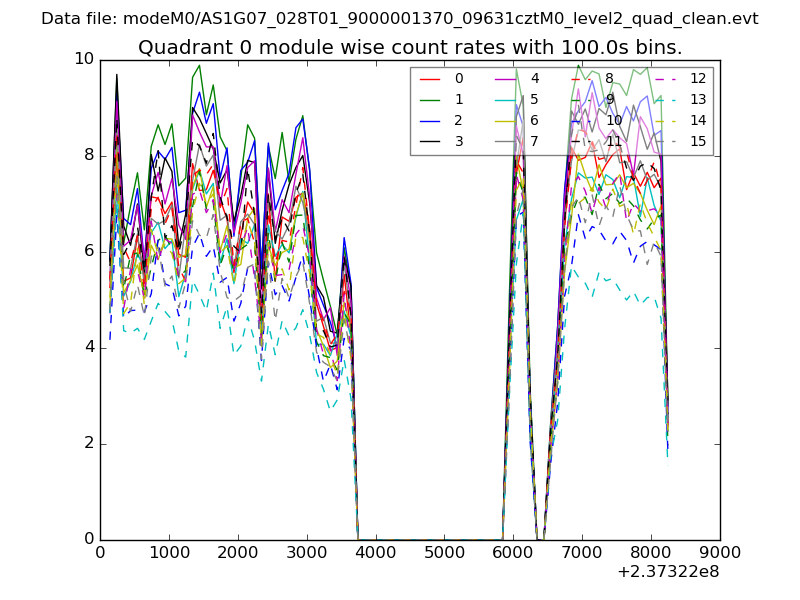 |
 |
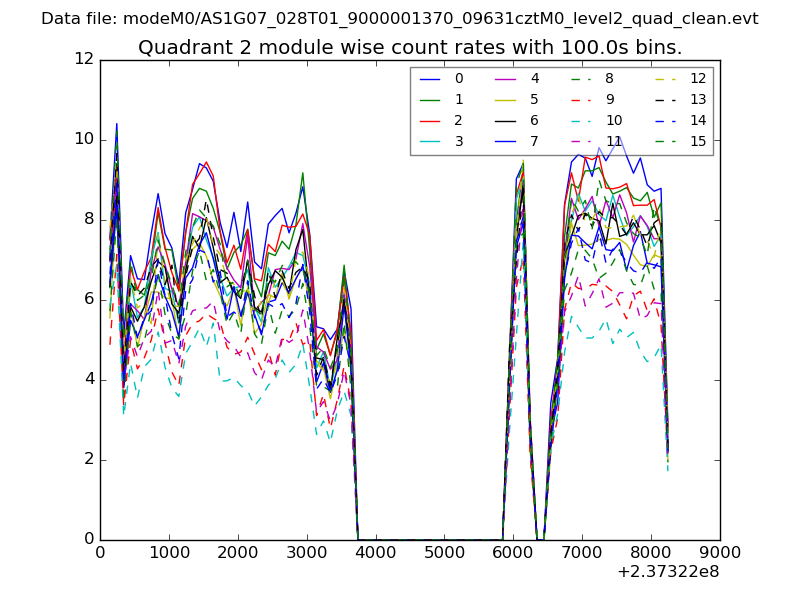
| Module-wise count rates for Quadrant B Data is divided into 100 sec bins |
 |
 |
| Module-wise count rates for Quadrant C Data is divided into 100 sec bins |
 |
 |
| Module-wise count rates for Quadrant D Data is divided into 100 sec bins |
 |
 |
| Parameter | Plot |
|---|---|
| CZT HV Monitor | 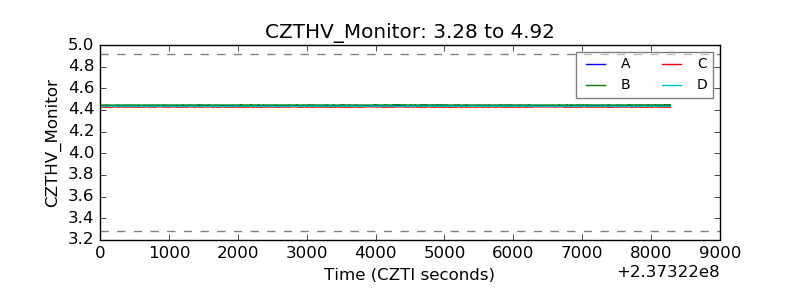 |
| D_VDD | 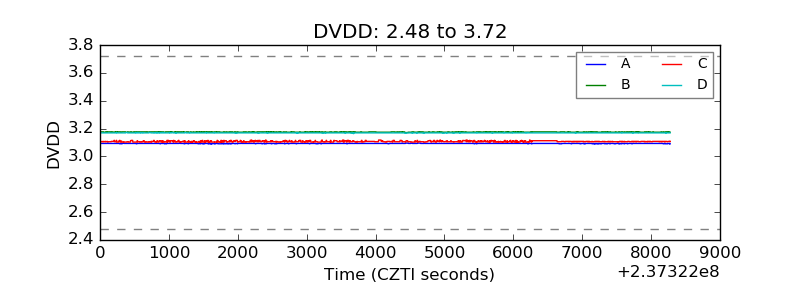 |
| Temperature 1 | 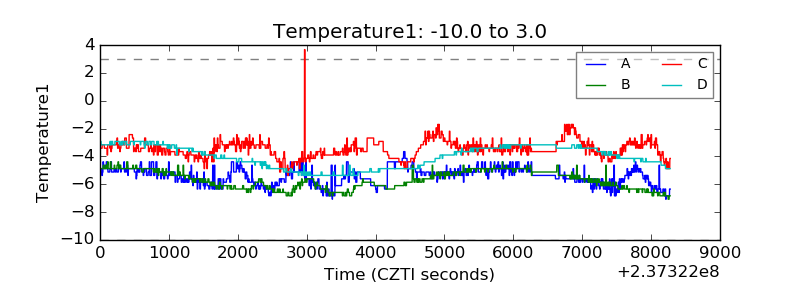 |
| Veto HV Monitor | 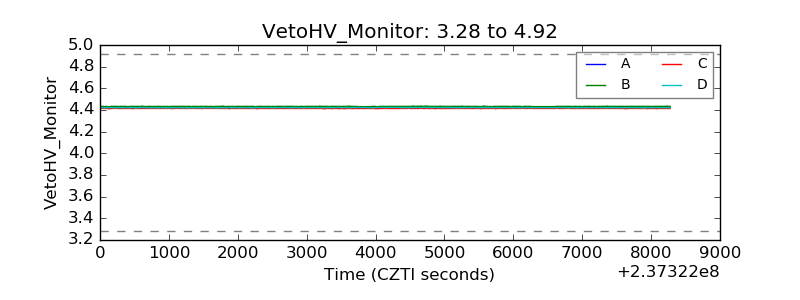 |
| Veto LLD | 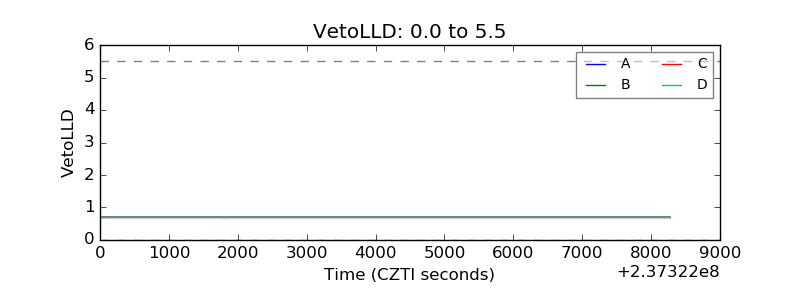 |
| Alpha Counter | 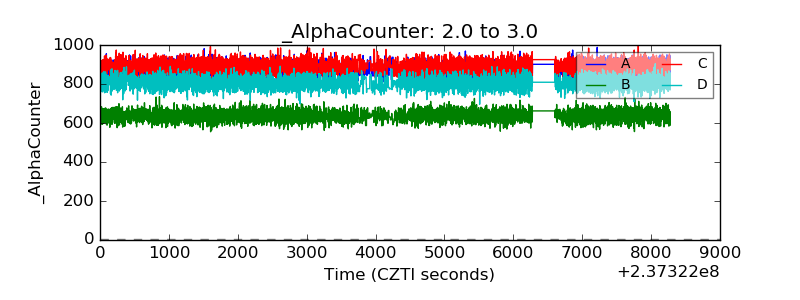 |
| _CPM_Rate | 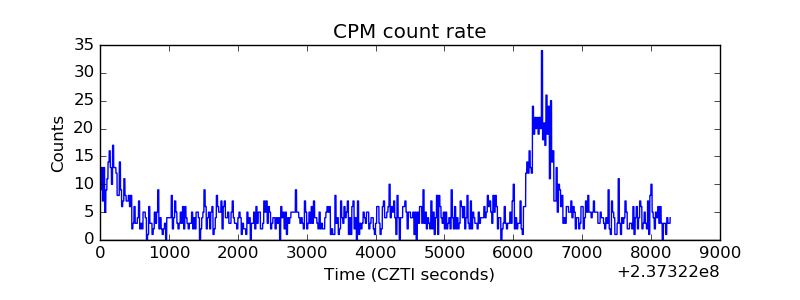 |
| CZT Counter | 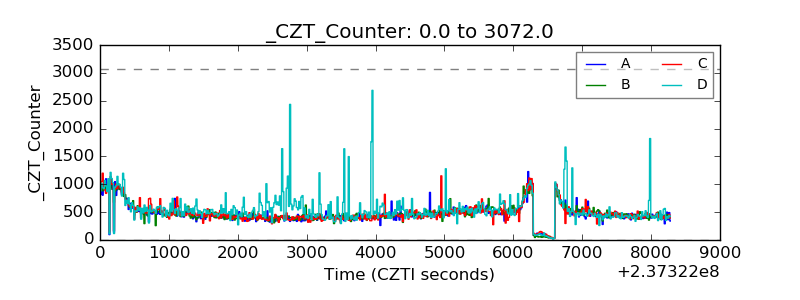 |
| +2.5 Volts monitor |  |
| +5 Volts monitor |  |
| _ROLL_ROT | 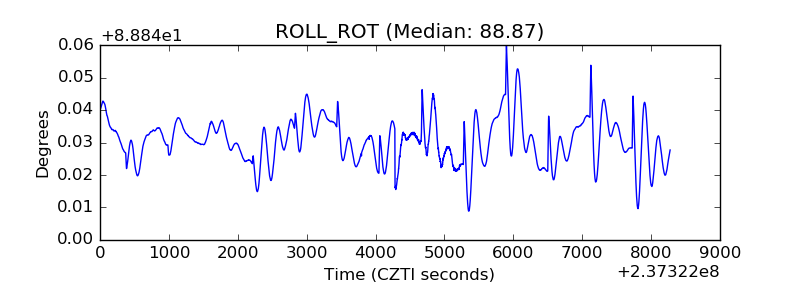 |
| _Roll_DEC | 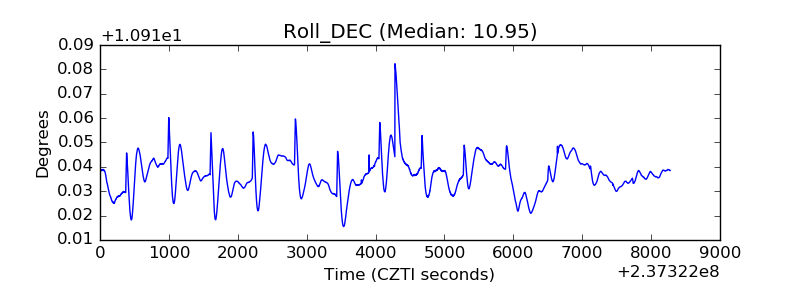 |
| _Roll_RA | 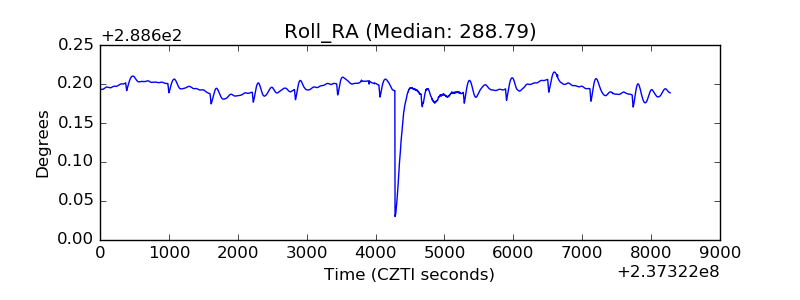 |
| Veto Counter | 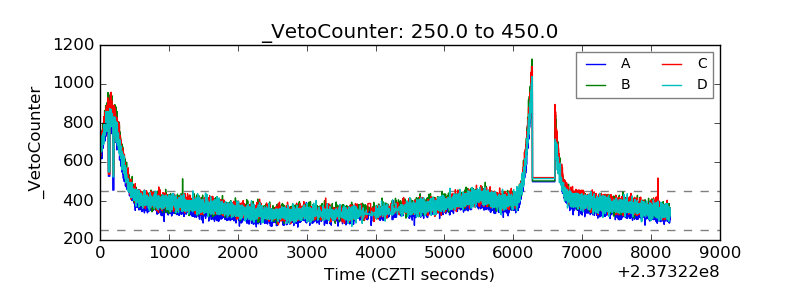 |