| Param | Original file | Final file |
|---|---|---|
| Filename | modeM0/AS1G07_046T01_9000001374_09667cztM0_level2.evt | modeM0/AS1G07_046T01_9000001374_09667cztM0_level2_quad_clean.evt |
| Size (bytes) | 1,299,718,080 | 229,429,440 |
| Size | 1.2 GB | 218.8 MB |
| Events in quadrant A | 9,786,236 | 1,405,497 |
| Events in quadrant B | 9,316,924 | 1,450,002 |
| Events in quadrant C | 8,982,101 | 1,397,507 |
| Events in quadrant D | 9,951,435 | 1,346,812 |
| Mode SS | |||
|---|---|---|---|
| Quadrant | BADHDUFLAG | Total packets | Discarded packets |
| A | 0 | 424 | 24 |
| B | 0 | 424 | 28 |
| C | 0 | 424 | 20 |
| D | 0 | 424 | 28 |
| Mode M9 | |||
|---|---|---|---|
| Quadrant | BADHDUFLAG | Total packets | Discarded packets |
| A | 0 | 43 | 1 |
| B | 0 | 42 | 1 |
| C | 0 | 42 | 1 |
| D | 0 | 43 | 1 |
| Mode M0 | |||
|---|---|---|---|
| Quadrant | BADHDUFLAG | Total packets | Discarded packets |
| A | 0 | 44637 | 3140 |
| B | 0 | 42918 | 2600 |
| C | 0 | 42593 | 2638 |
| D | 0 | 45556 | 2713 |
| Quadrant | Total seconds | Saturated seconds | Saturation percentage |
|---|---|---|---|
| A | 19506 | 154 | 0.789501% |
| B | 19626 | 197 | 1.003771% |
| C | 19598 | 106 | 0.540872% |
| D | 19573 | 104 | 0.531344% |
Noise dominated data is calculated using 1-second bins in cleaned event files. If a bin has >2000 counts, and if more than 50% of those come from <1% of pixels, then it is considered to be noise-dominated and hence unusable.
| Quadrant | # 1 sec bins | Bins with >0 counts | Bins with >2000 counts | High rate bins dominated by noise | Noise dominated (total time) | Noise dominated (detector-on time) | Marked lightcurve |
|---|---|---|---|---|---|---|---|
| A | 25205 | 20260 | 9 | 9 | 0.04% | 0.04% | 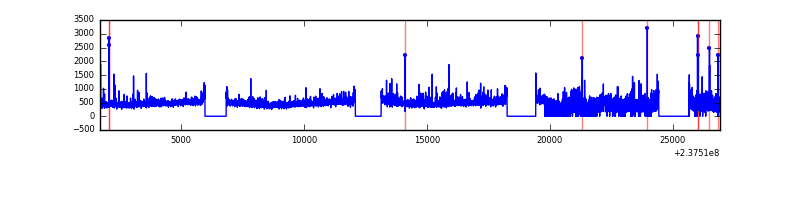 |
| B | 25205 | 20343 | 1 | 1 | 0.00% | 0.00% | 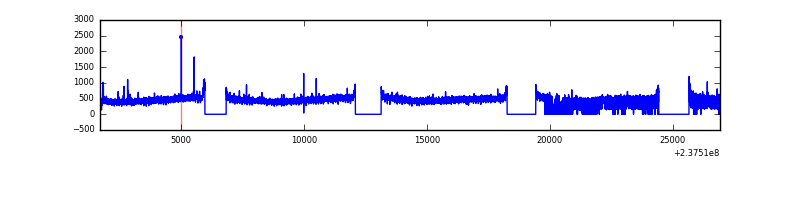 |
| C | 25205 | 20329 | 1 | 1 | 0.00% | 0.00% | 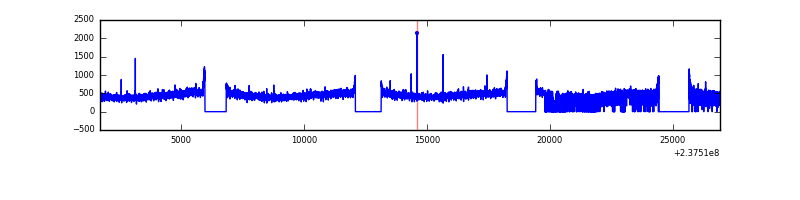 |
| D | 25205 | 20327 | 20 | 20 | 0.08% | 0.10% | 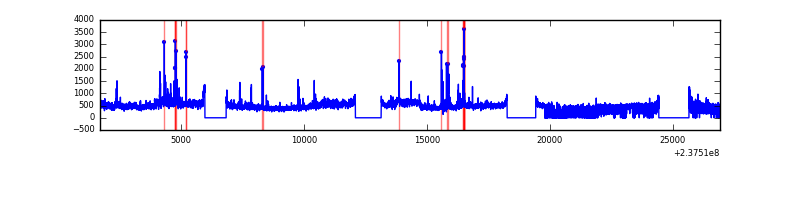 |
Top three noisy pixels from each quadrant. If the there are fewer than three noisy pixels in the level2.evt file, extra rows are filled as -1
| Pixel properties | Quadrant properties | ||||||
|---|---|---|---|---|---|---|---|
| Quadrant | DetID | PixID | Counts | Sigma | Mean | Median | Sigma |
| A | 1 | 162 | 266295 | 554.22 | 2369 | 2328 | 476.3 |
| A | 1 | 178 | 95711 | 196.06 | 2369 | 2328 | 476.3 |
| A | 1 | 161 | 94340 | 193.18 | 2369 | 2328 | 476.3 |
| B | 12 | 111 | 53426 | 112.54 | 2386 | 2329 | 454.0 |
| B | 11 | 111 | 44161 | 92.13 | 2386 | 2329 | 454.0 |
| B | 14 | 111 | 35437 | 72.92 | 2386 | 2329 | 454.0 |
| C | 13 | 61 | 16991 | 27.47 | 2299 | 2312 | 534.4 |
| C | 8 | 222 | 7490 | 9.69 | 2299 | 2312 | 534.4 |
| C | 10 | 22 | 6480 | 7.8 | 2299 | 2312 | 534.4 |
| D | 8 | 195 | 1022186 | 1742.1 | 2271 | 2224 | 585.5 |
| D | 2 | 152 | 117330 | 196.6 | 2271 | 2224 | 585.5 |
| D | 1 | 52 | 63364 | 104.43 | 2271 | 2224 | 585.5 |
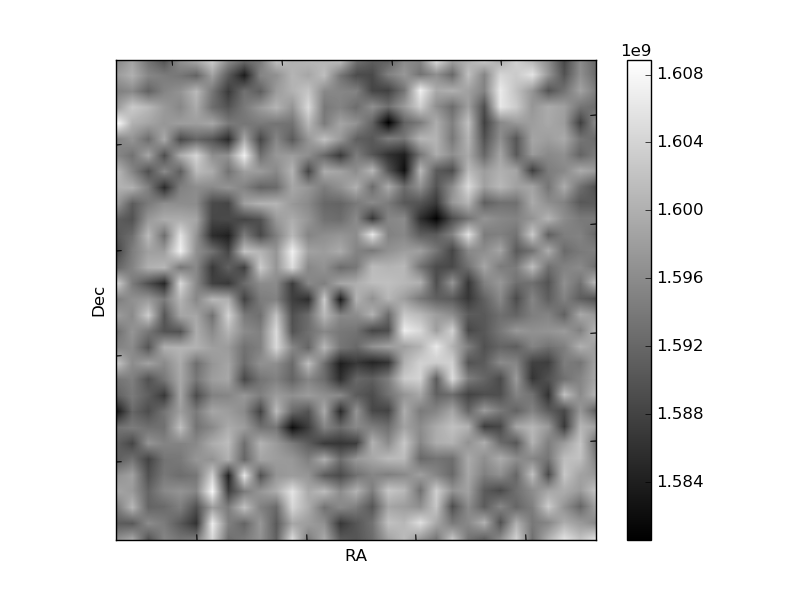
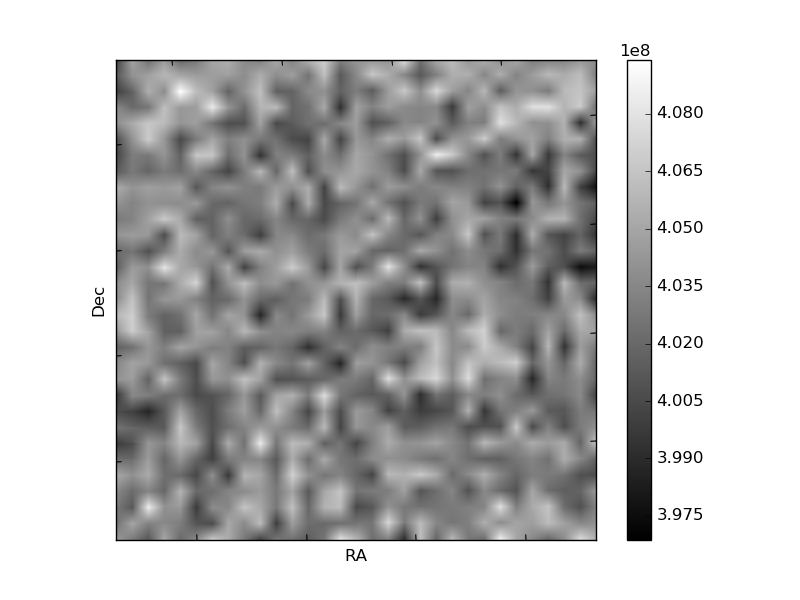
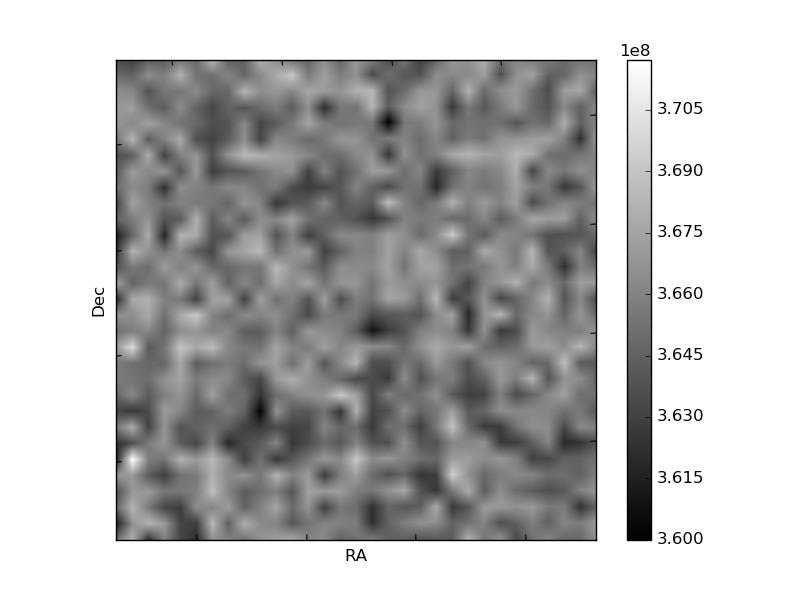
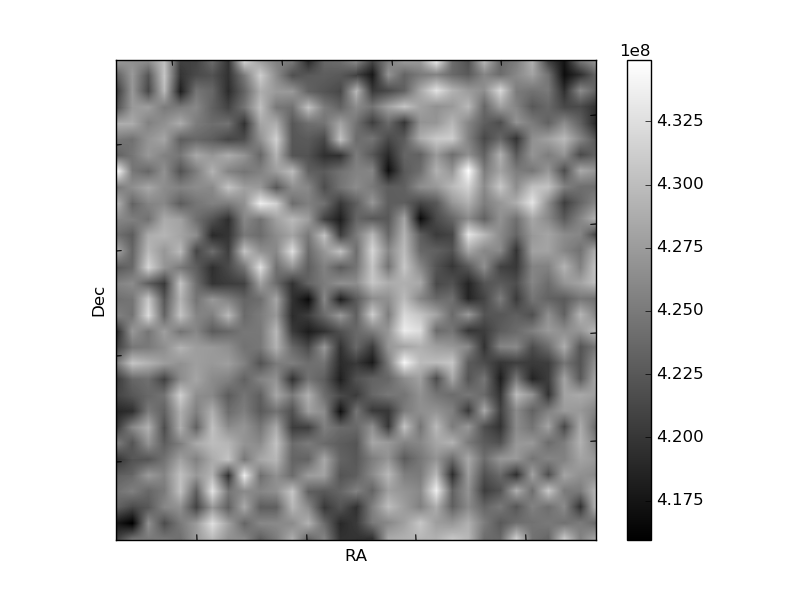
Histogram calculated using DETX and DETY for each event in the final _common_clean file
| Quadrant A | 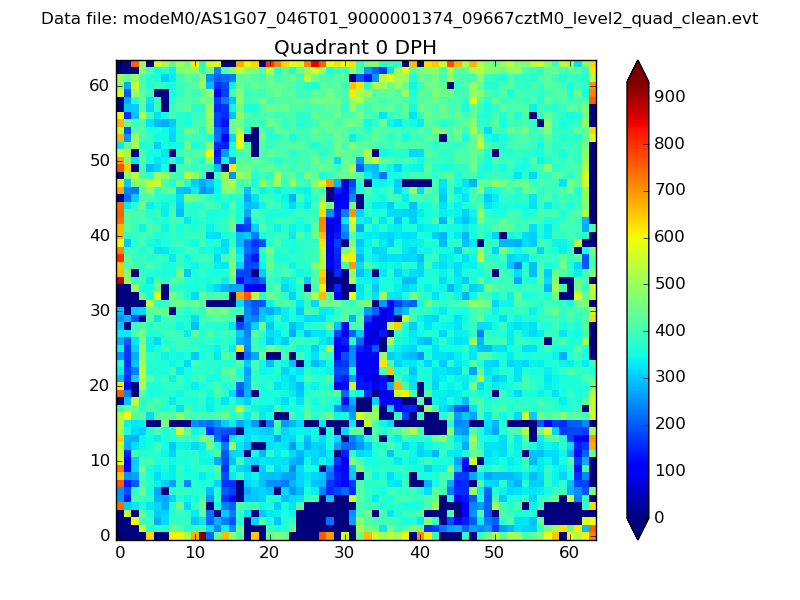 |
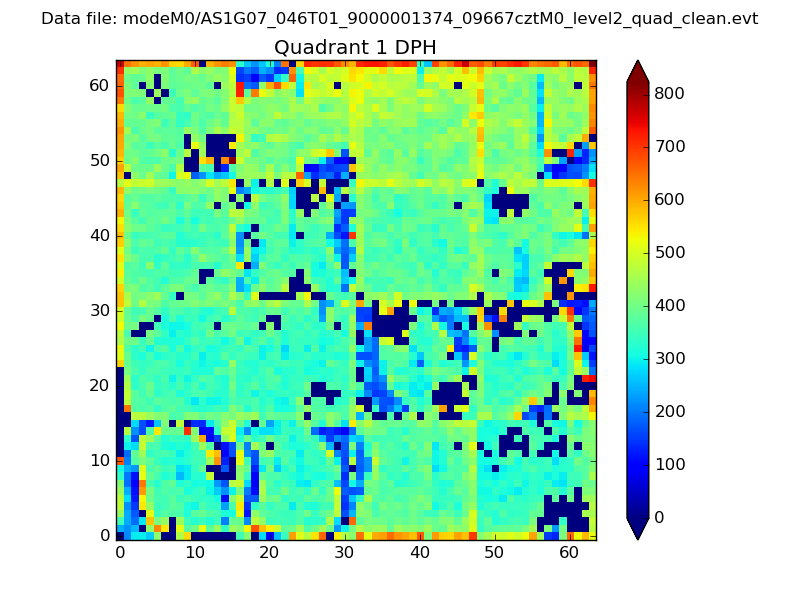 |
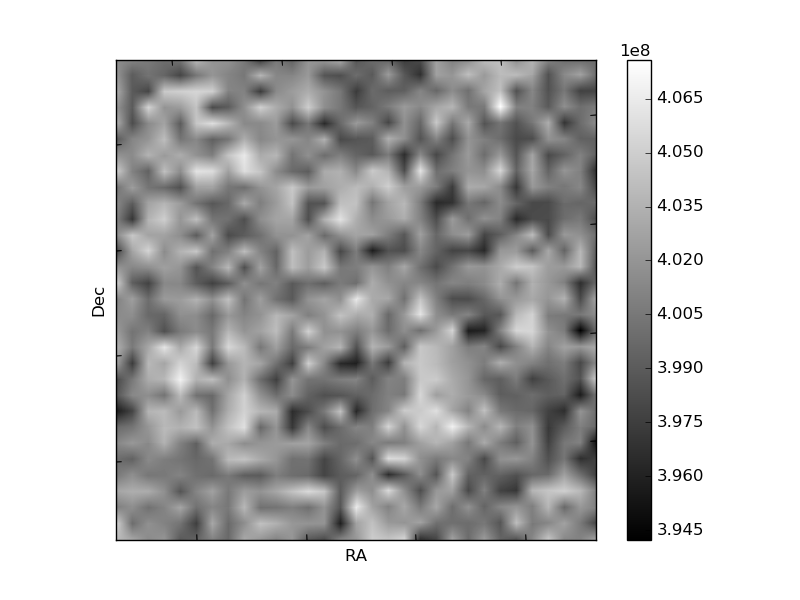
Quadrant B |
|---|---|---|---|
| Quadrant D | 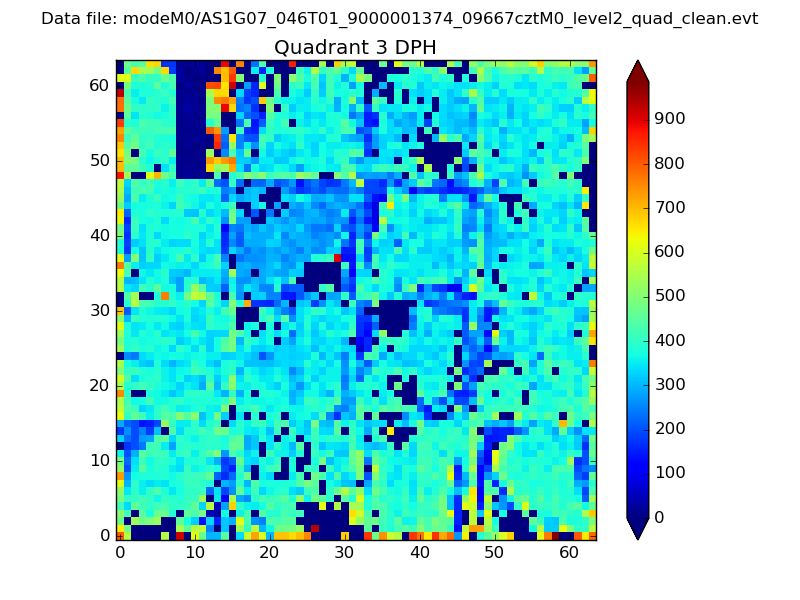 |
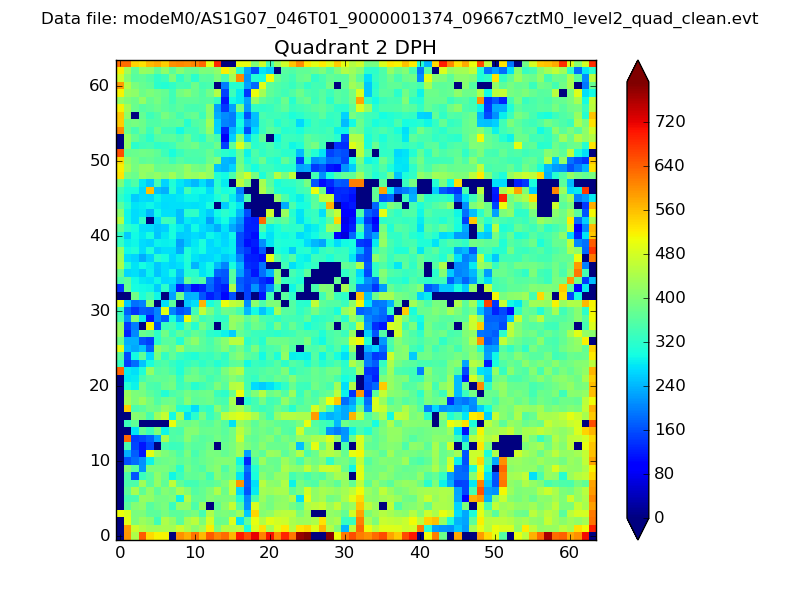 |
Quadrant C |
| Plot type | Count rate plots | Images |
|---|---|---|
| Comparison with Poisson distribution Blue bars denote a histogram of data divided into 1 sec bins. Red curve is a Poisson curve with rate = median count rate of data. |
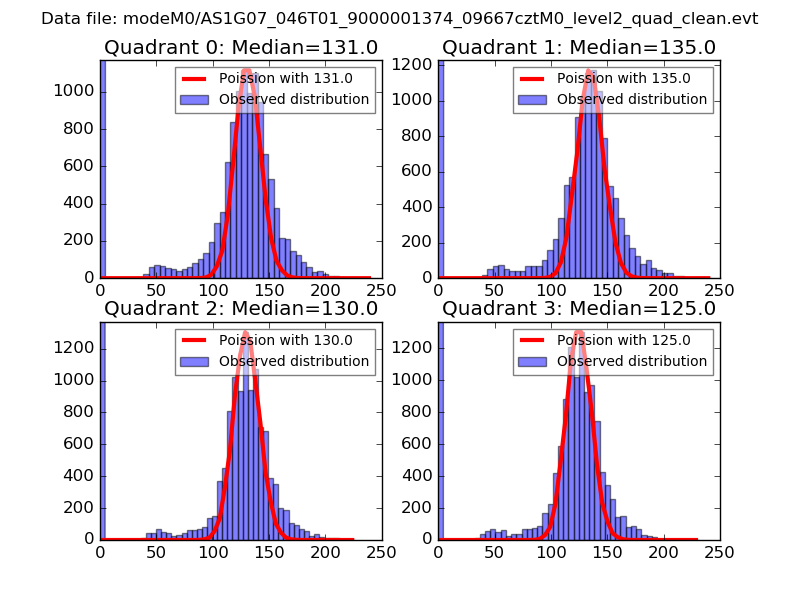 |
 |
| Quadrant-wise count rates Data is divided into 100 sec bins |
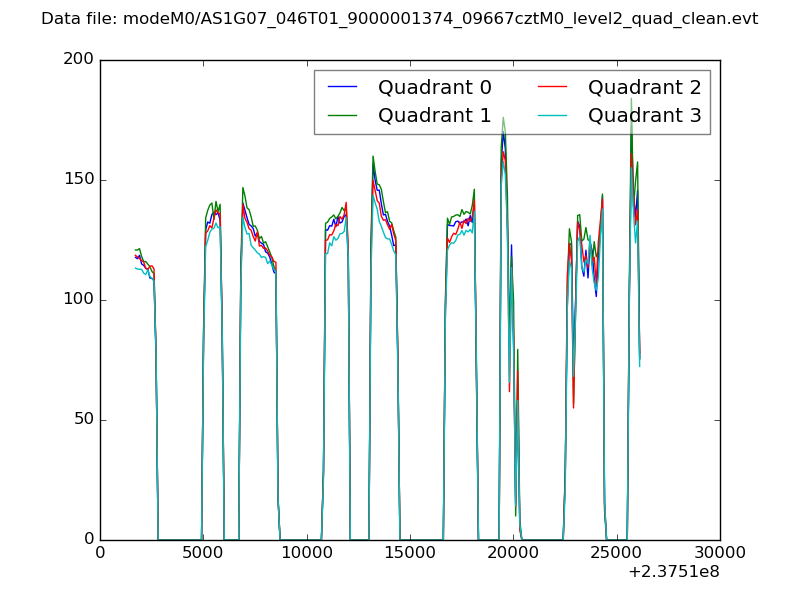 |
|
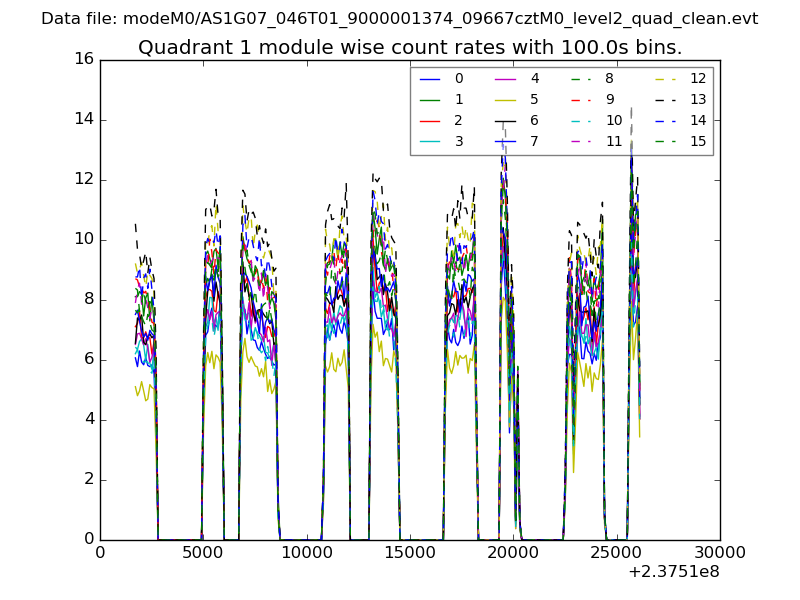
| Module-wise count rates for Quadrant A Data is divided into 100 sec bins |
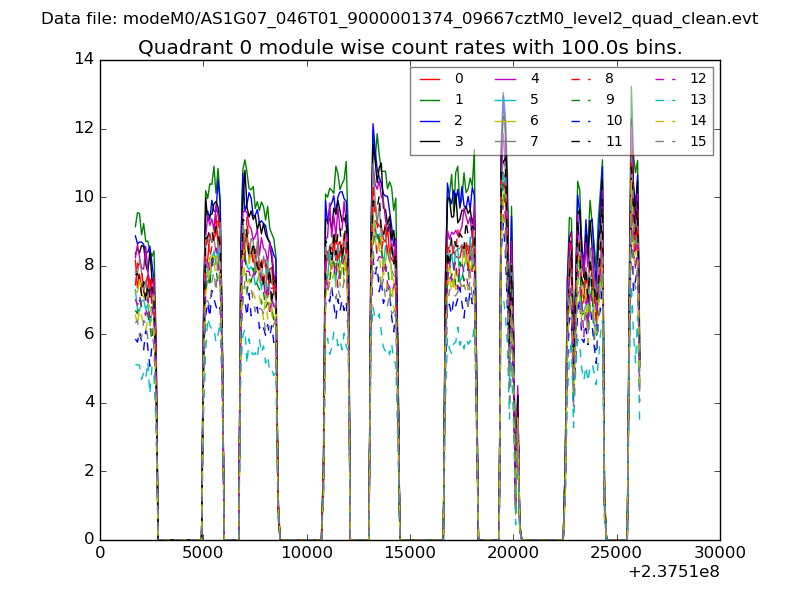 |
 |
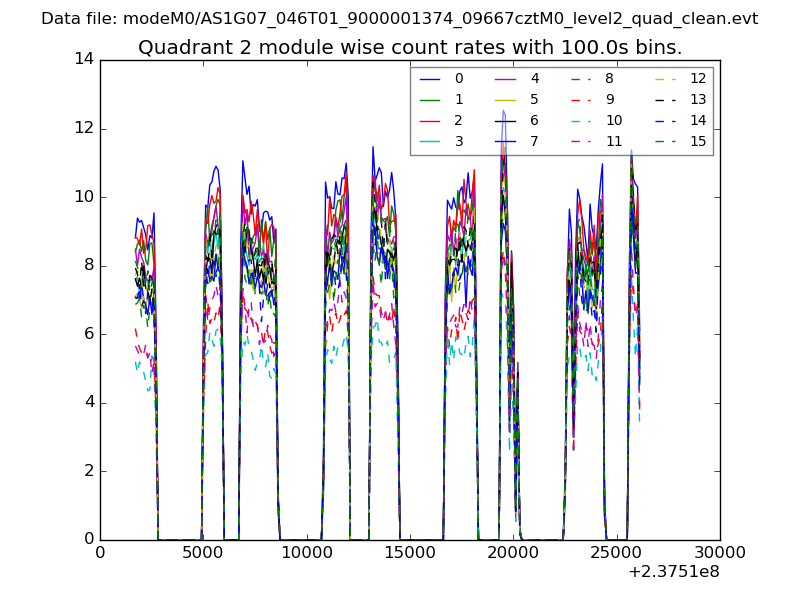
| Module-wise count rates for Quadrant B Data is divided into 100 sec bins |
 |
 |
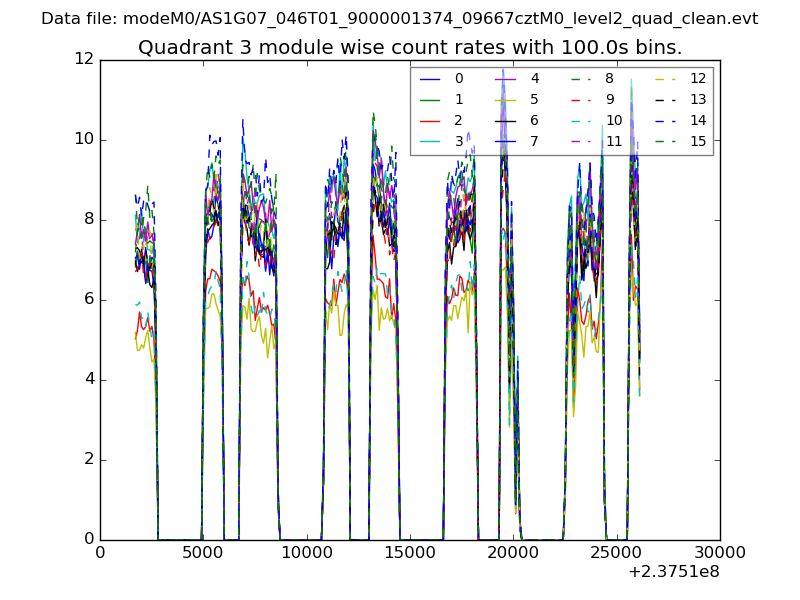
| Module-wise count rates for Quadrant C Data is divided into 100 sec bins |
 |
 |
| Module-wise count rates for Quadrant D Data is divided into 100 sec bins |
 |
 |
| Parameter | Plot |
|---|---|
| CZT HV Monitor | 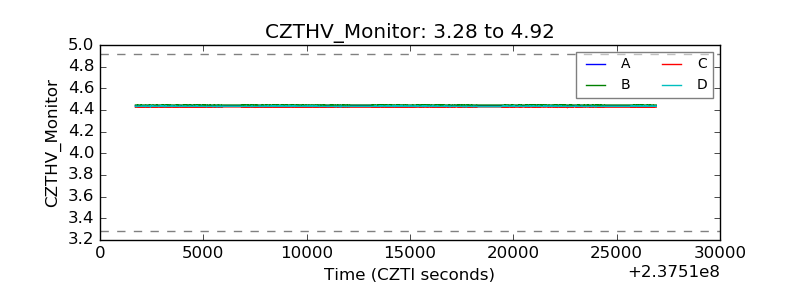 |
| D_VDD | 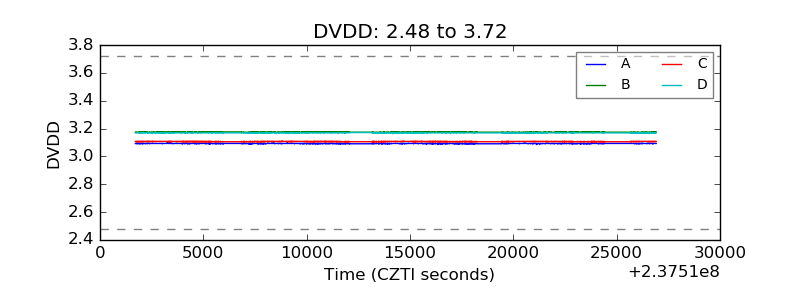 |
| Temperature 1 | 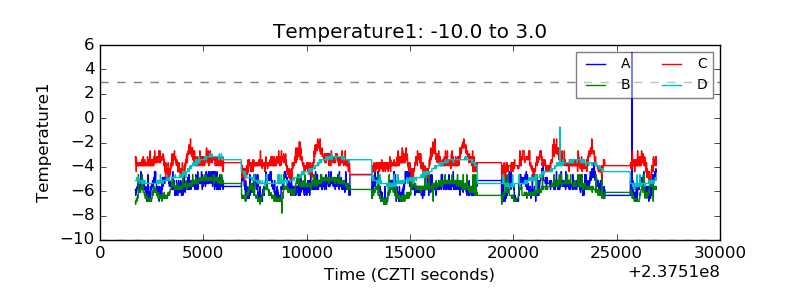 |
| Veto HV Monitor | 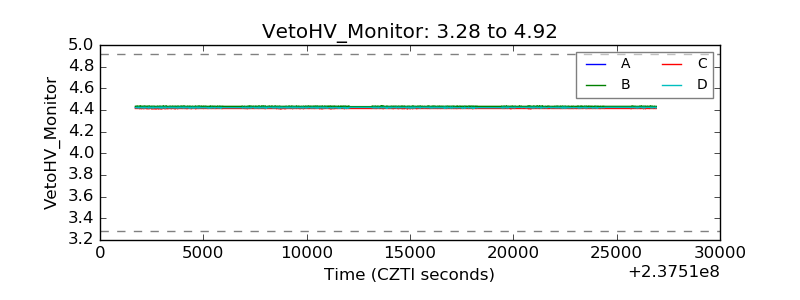 |
| Veto LLD | 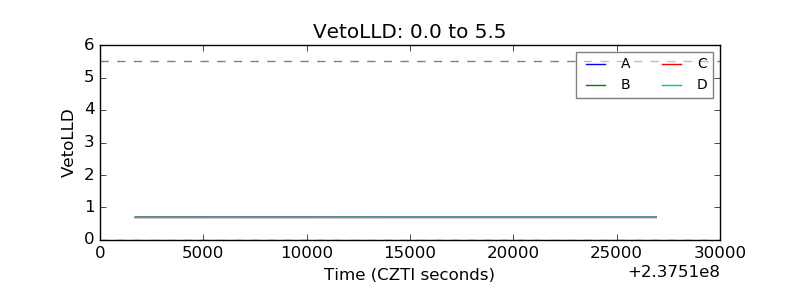 |
| Alpha Counter |  |
| _CPM_Rate | 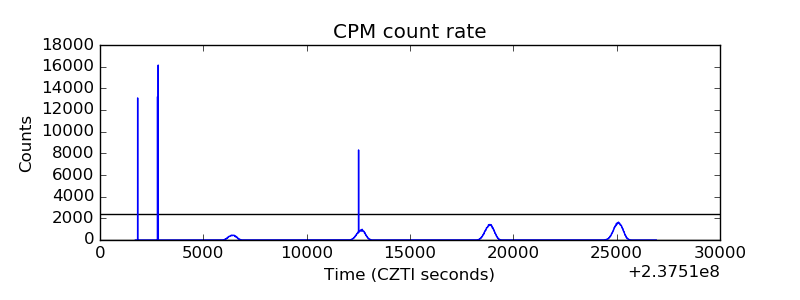 |
| CZT Counter |  |
| +2.5 Volts monitor |  |
| +5 Volts monitor |  |
| _ROLL_ROT | 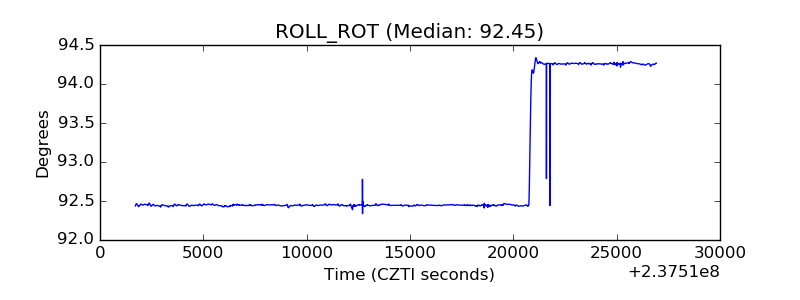 |
| _Roll_DEC | 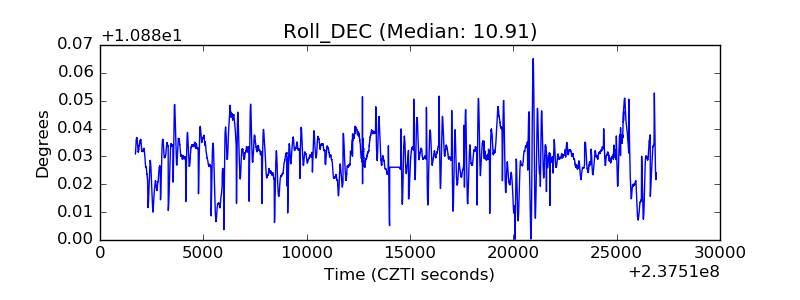 |
| _Roll_RA | 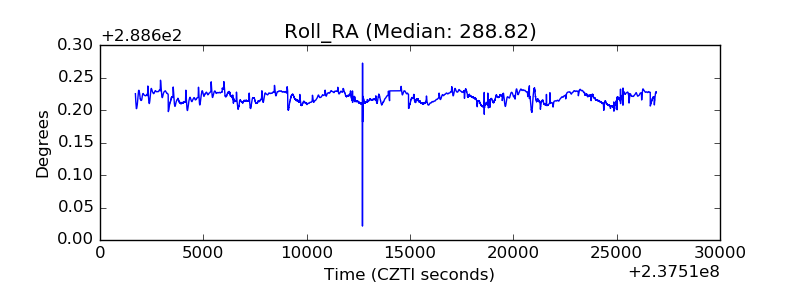 |
| Veto Counter | 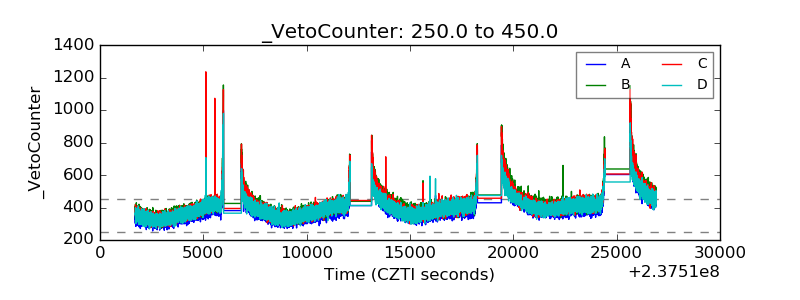 |