| Param | Original file | Final file |
|---|---|---|
| Filename | modeM0/AS1G07_046T01_9000001374_09668cztM0_level2.evt | modeM0/AS1G07_046T01_9000001374_09668cztM0_level2_quad_clean.evt |
| Size (bytes) | 385,355,520 | 58,636,800 |
| Size | 367.5 MB | 55.9 MB |
| Events in quadrant A | 2,927,817 | 349,652 |
| Events in quadrant B | 2,849,778 | 360,208 |
| Events in quadrant C | 2,697,701 | 345,429 |
| Events in quadrant D | 2,817,596 | 332,425 |
| Mode SS | |||
|---|---|---|---|
| Quadrant | BADHDUFLAG | Total packets | Discarded packets |
| A | 0 | 122 | 8 |
| B | 0 | 122 | 6 |
| C | 0 | 122 | 14 |
| D | 0 | 122 | 8 |
| Mode M9 | |||
|---|---|---|---|
| Quadrant | BADHDUFLAG | Total packets | Discarded packets |
| A | 0 | 14 | 0 |
| B | 0 | 14 | 0 |
| C | 0 | 14 | 0 |
| D | 0 | 14 | 0 |
| Mode M0 | |||
|---|---|---|---|
| Quadrant | BADHDUFLAG | Total packets | Discarded packets |
| A | 0 | 12813 | 942 |
| B | 0 | 12422 | 809 |
| C | 0 | 12185 | 872 |
| D | 0 | 12707 | 877 |
| Quadrant | Total seconds | Saturated seconds | Saturation percentage |
|---|---|---|---|
| A | 5529 | 36 | 0.651112% |
| B | 5565 | 38 | 0.682839% |
| C | 5525 | 17 | 0.307692% |
| D | 5545 | 21 | 0.378720% |
Noise dominated data is calculated using 1-second bins in cleaned event files. If a bin has >2000 counts, and if more than 50% of those come from <1% of pixels, then it is considered to be noise-dominated and hence unusable.
| Quadrant | # 1 sec bins | Bins with >0 counts | Bins with >2000 counts | High rate bins dominated by noise | Noise dominated (total time) | Noise dominated (detector-on time) | Marked lightcurve |
|---|---|---|---|---|---|---|---|
| A | 7302 | 5880 | 5 | 5 | 0.07% | 0.09% | 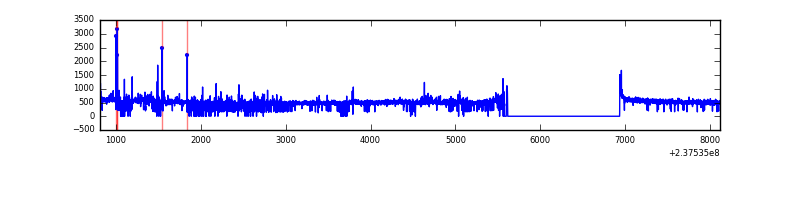 |
| B | 7302 | 5892 | 1 | 1 | 0.01% | 0.02% | 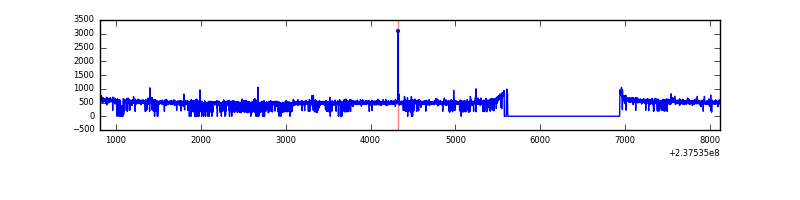 |
| C | 7302 | 5859 | 1 | 1 | 0.01% | 0.02% | 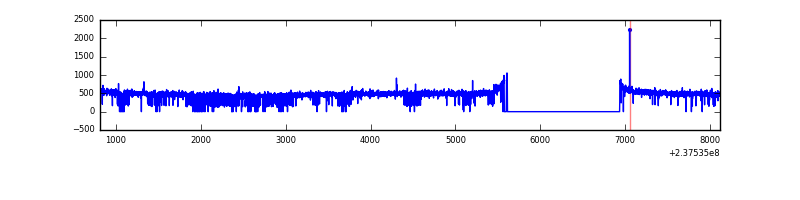 |
| D | 7302 | 5885 | 4 | 4 | 0.05% | 0.07% | 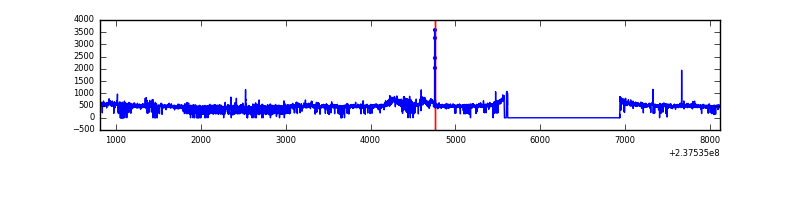 |
Top three noisy pixels from each quadrant. If the there are fewer than three noisy pixels in the level2.evt file, extra rows are filled as -1
| Pixel properties | Quadrant properties | ||||||
|---|---|---|---|---|---|---|---|
| Quadrant | DetID | PixID | Counts | Sigma | Mean | Median | Sigma |
| A | 1 | 162 | 55151 | 376.22 | 722 | 710 | 144.7 |
| A | 14 | 111 | 19560 | 130.27 | 722 | 710 | 144.7 |
| A | 8 | 15 | 19313 | 128.56 | 722 | 710 | 144.7 |
| B | 10 | 252 | 20829 | 146.69 | 724 | 708 | 137.2 |
| B | 12 | 111 | 15879 | 110.6 | 724 | 708 | 137.2 |
| B | 11 | 111 | 13039 | 89.9 | 724 | 708 | 137.2 |
| C | 13 | 61 | 5076 | 27.52 | 689 | 696 | 159.2 |
| C | 14 | 67 | 4052 | 21.09 | 689 | 696 | 159.2 |
| C | 8 | 222 | 3969 | 20.57 | 689 | 696 | 159.2 |
| D | 8 | 195 | 165420 | 932.83 | 685 | 671 | 176.6 |
| D | 2 | 152 | 20821 | 114.09 | 685 | 671 | 176.6 |
| D | 1 | 52 | 16583 | 90.1 | 685 | 671 | 176.6 |
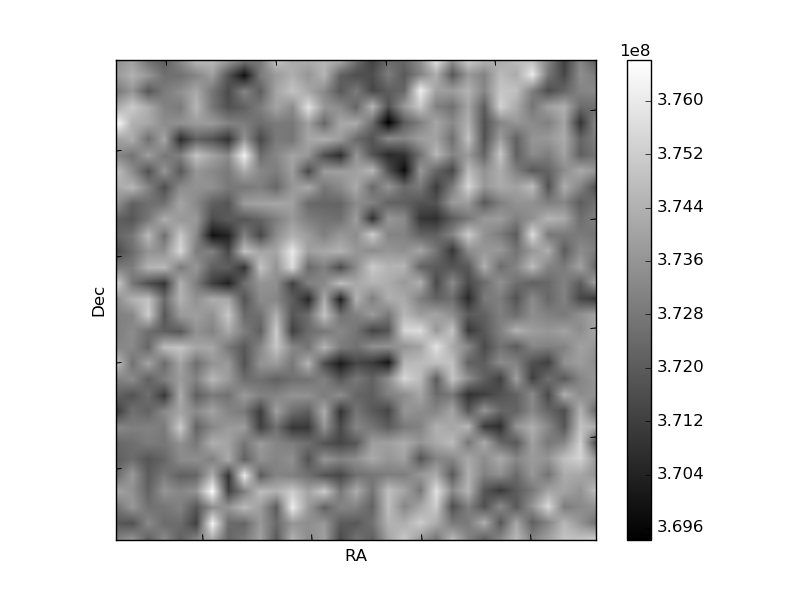
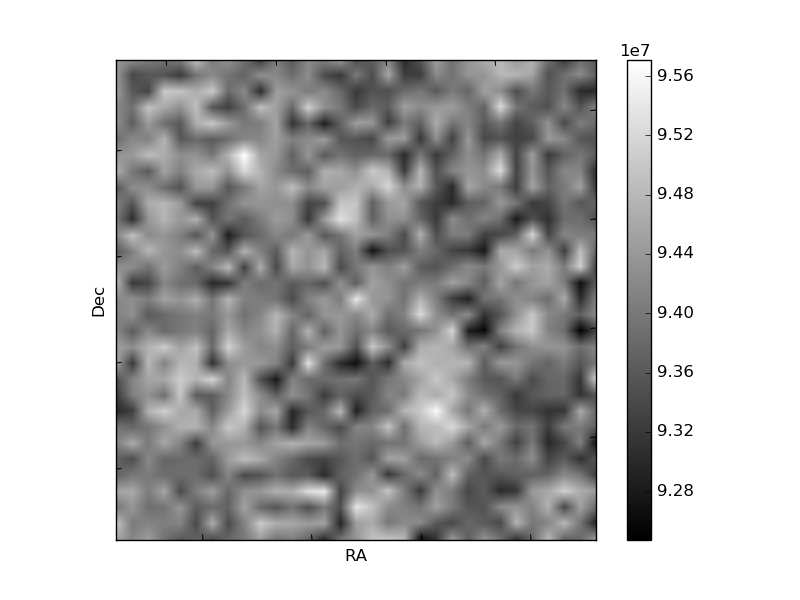
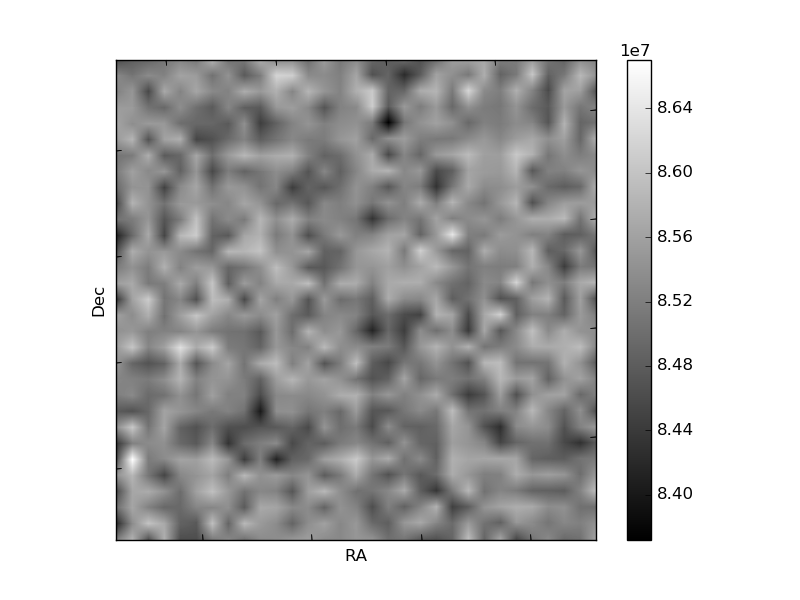
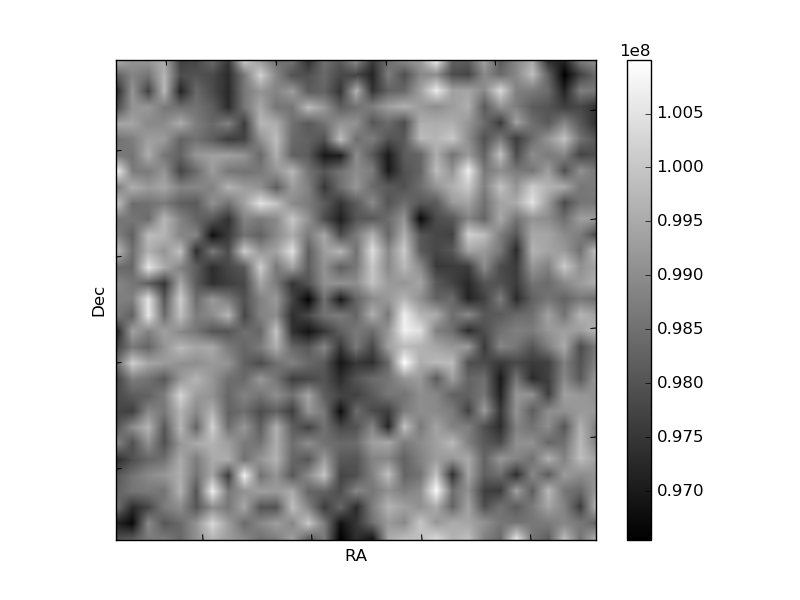
Histogram calculated using DETX and DETY for each event in the final _common_clean file
| Quadrant A | 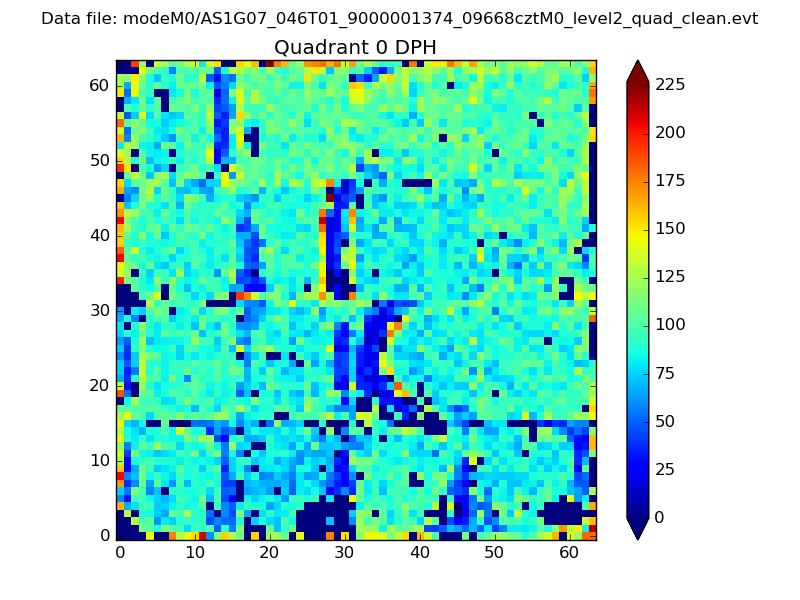 |
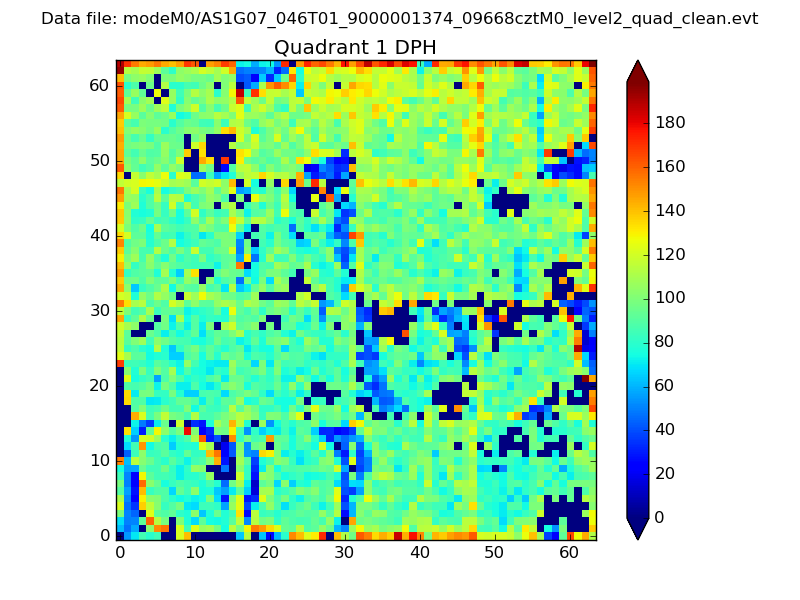 |
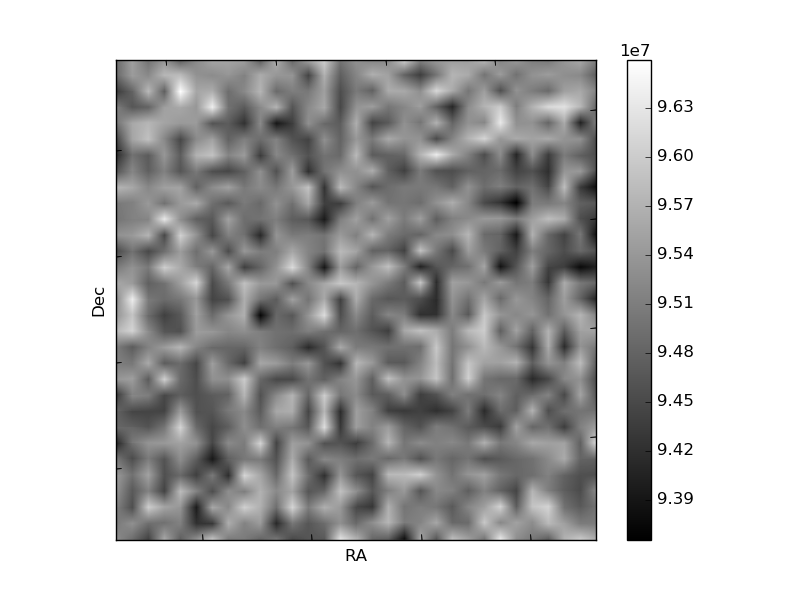
Quadrant B |
|---|---|---|---|
| Quadrant D |  |
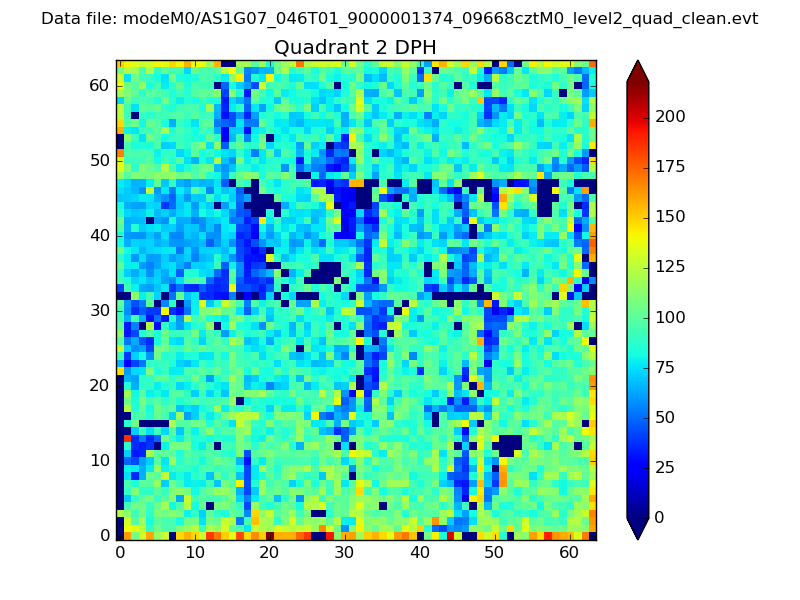 |
Quadrant C |
| Plot type | Count rate plots | Images |
|---|---|---|
| Comparison with Poisson distribution Blue bars denote a histogram of data divided into 1 sec bins. Red curve is a Poisson curve with rate = median count rate of data. |
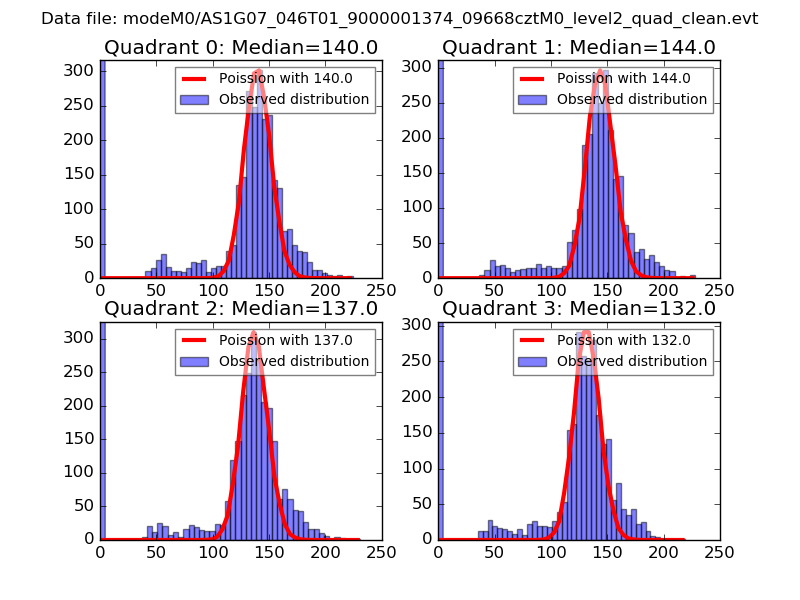 |
 |
| Quadrant-wise count rates Data is divided into 100 sec bins |
 |
|
| Module-wise count rates for Quadrant A Data is divided into 100 sec bins |
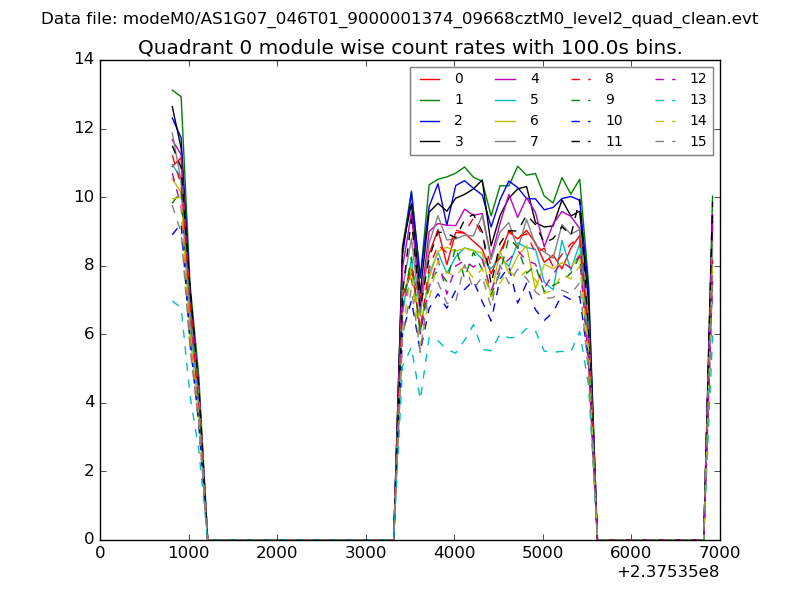 |
 |
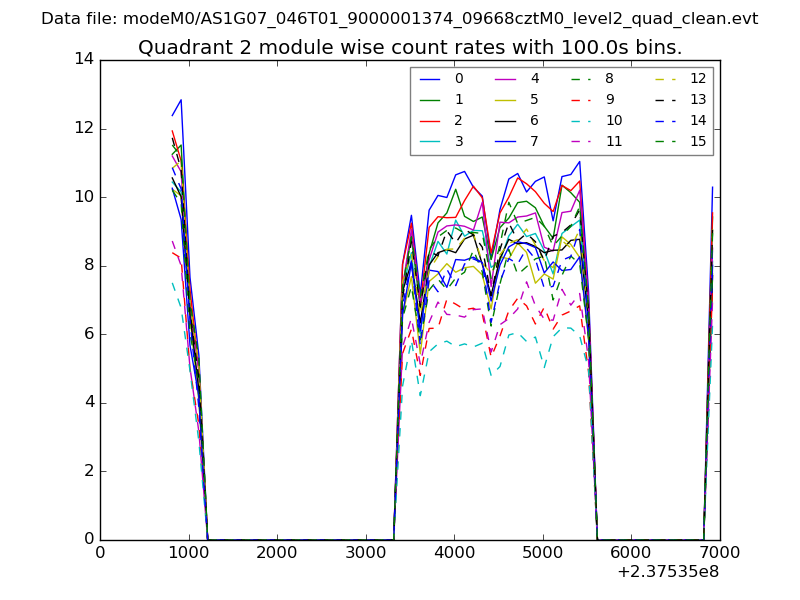
| Module-wise count rates for Quadrant B Data is divided into 100 sec bins |
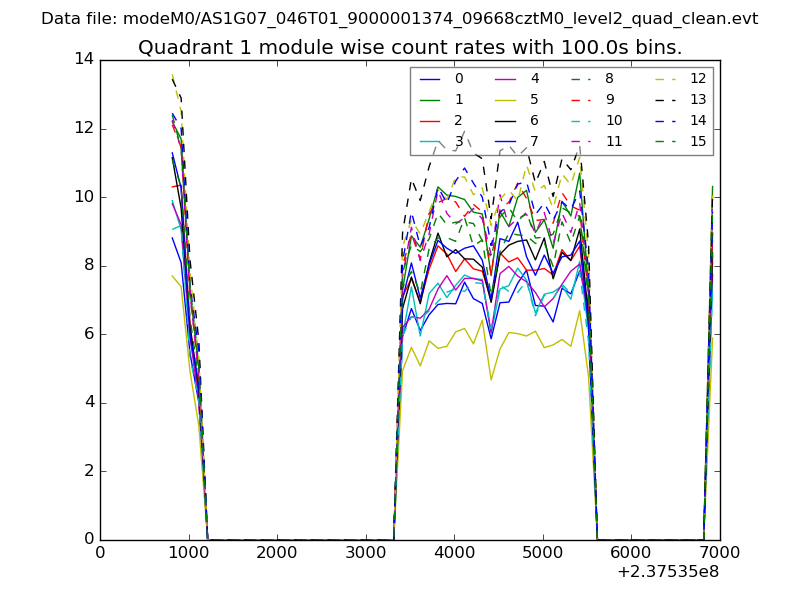 |
 |
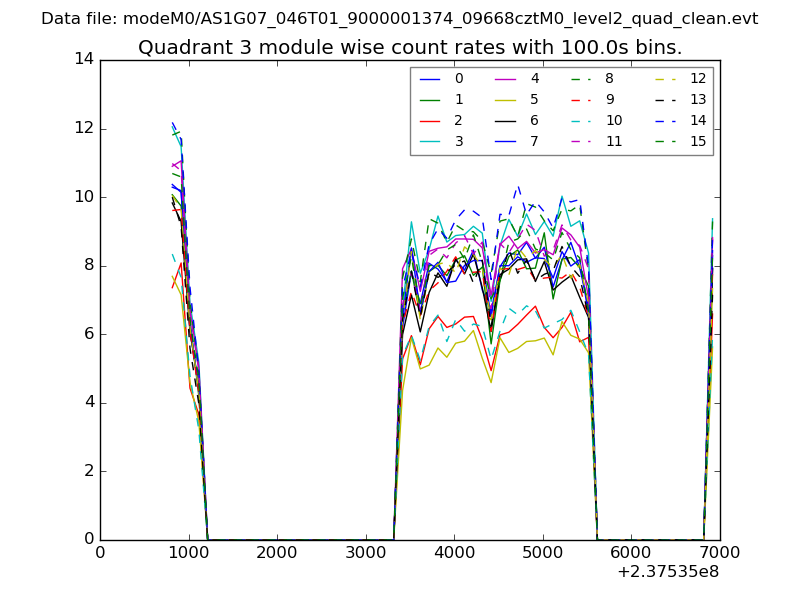
| Module-wise count rates for Quadrant C Data is divided into 100 sec bins |
 |
 |
| Module-wise count rates for Quadrant D Data is divided into 100 sec bins |
 |
 |
| Parameter | Plot |
|---|---|
| CZT HV Monitor | 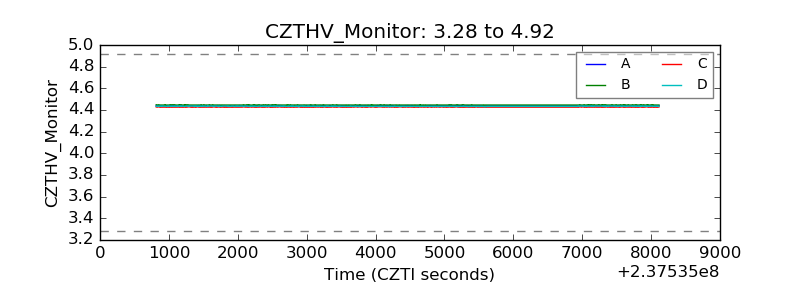 |
| D_VDD | 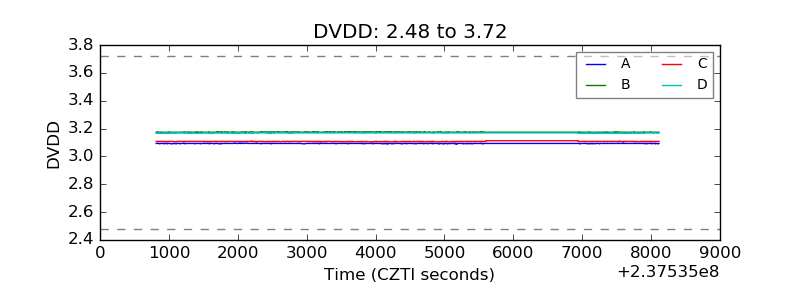 |
| Temperature 1 | 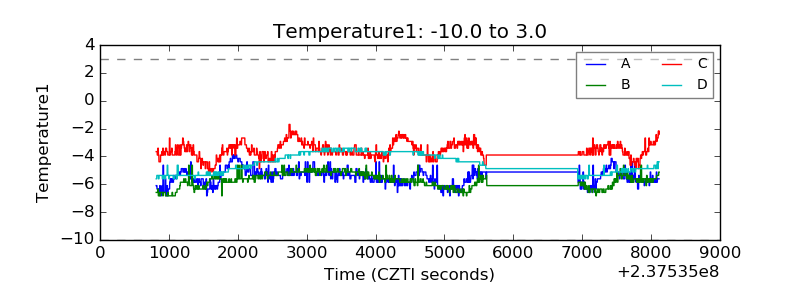 |
| Veto HV Monitor | 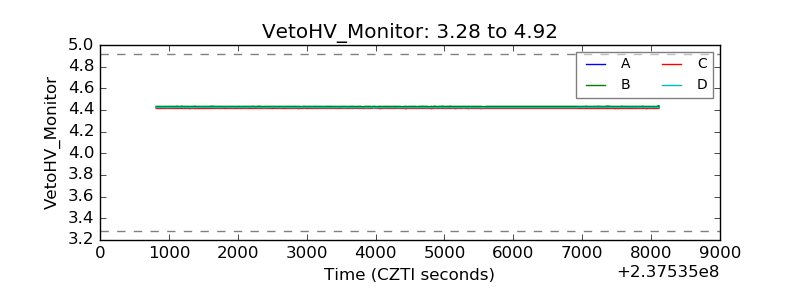 |
| Veto LLD | 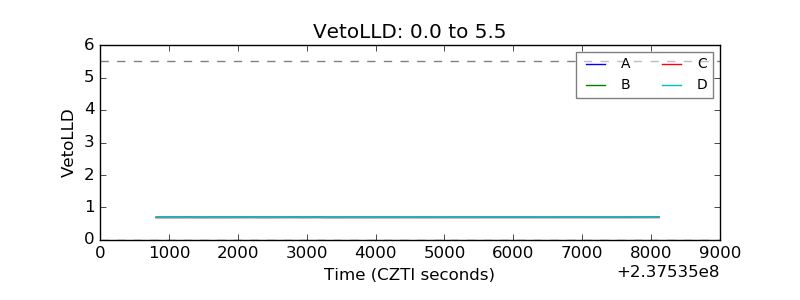 |
| Alpha Counter |  |
| _CPM_Rate | 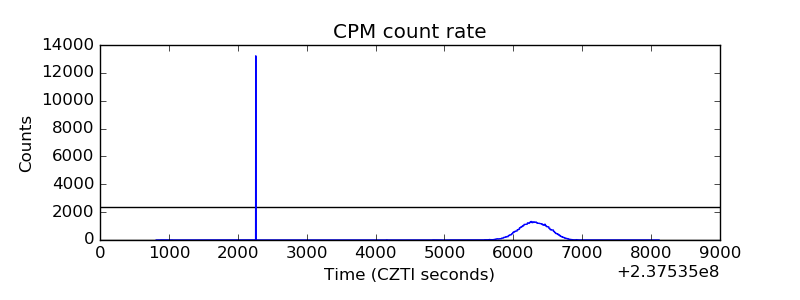 |
| CZT Counter |  |
| +2.5 Volts monitor |  |
| +5 Volts monitor |  |
| _ROLL_ROT | 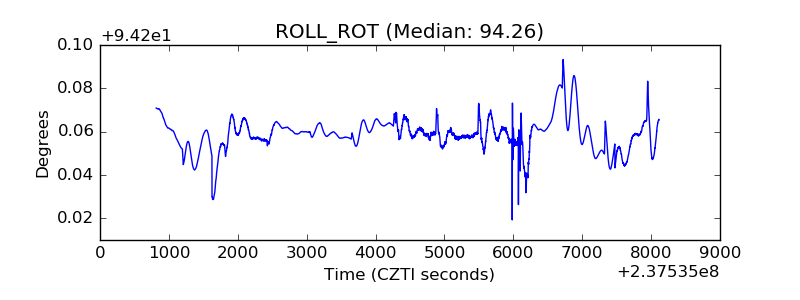 |
| _Roll_DEC | 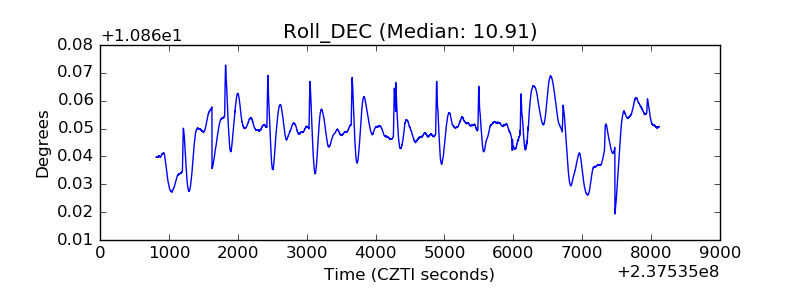 |
| _Roll_RA |  |
| Veto Counter | 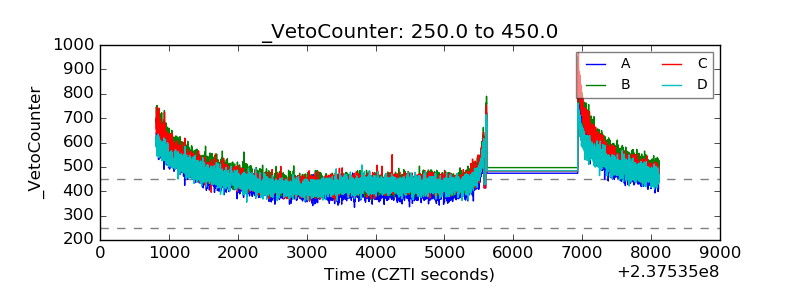 |