| Param | Original file | Final file |
|---|---|---|
| Filename | modeM0/AS1G07_046T01_9000001374_09671cztM0_level2.evt | modeM0/AS1G07_046T01_9000001374_09671cztM0_level2_quad_clean.evt |
| Size (bytes) | 203,895,360 | 31,325,760 |
| Size | 194.4 MB | 29.9 MB |
| Events in quadrant A | 1,503,974 | 188,375 |
| Events in quadrant B | 1,486,658 | 187,589 |
| Events in quadrant C | 1,468,232 | 184,022 |
| Events in quadrant D | 1,514,905 | 179,597 |
| Mode SS | |||
|---|---|---|---|
| Quadrant | BADHDUFLAG | Total packets | Discarded packets |
| A | 0 | 64 | 4 |
| B | 0 | 64 | 0 |
| C | 0 | 64 | 6 |
| D | 0 | 64 | 4 |
| Mode M9 | |||
|---|---|---|---|
| Quadrant | BADHDUFLAG | Total packets | Discarded packets |
| A | 0 | 11 | 1 |
| B | 0 | 11 | 0 |
| C | 0 | 11 | 0 |
| D | 0 | 11 | 1 |
| Mode M0 | |||
|---|---|---|---|
| Quadrant | BADHDUFLAG | Total packets | Discarded packets |
| A | 0 | 6651 | 435 |
| B | 0 | 6667 | 535 |
| C | 0 | 6647 | 416 |
| D | 0 | 6854 | 462 |
| Quadrant | Total seconds | Saturated seconds | Saturation percentage |
|---|---|---|---|
| A | 2927 | 94 | 3.211479% |
| B | 2885 | 100 | 3.466205% |
| C | 2937 | 82 | 2.791965% |
| D | 2927 | 68 | 2.323198% |
Noise dominated data is calculated using 1-second bins in cleaned event files. If a bin has >2000 counts, and if more than 50% of those come from <1% of pixels, then it is considered to be noise-dominated and hence unusable.
| Quadrant | # 1 sec bins | Bins with >0 counts | Bins with >2000 counts | High rate bins dominated by noise | Noise dominated (total time) | Noise dominated (detector-on time) | Marked lightcurve |
|---|---|---|---|---|---|---|---|
| A | 4203 | 3073 | 0 | 0 | 0.00% | 0.00% | 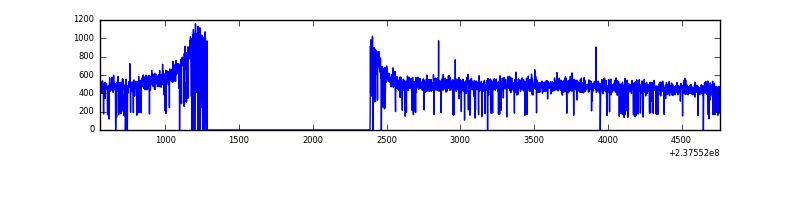 |
| B | 4202 | 3058 | 0 | 0 | 0.00% | 0.00% | 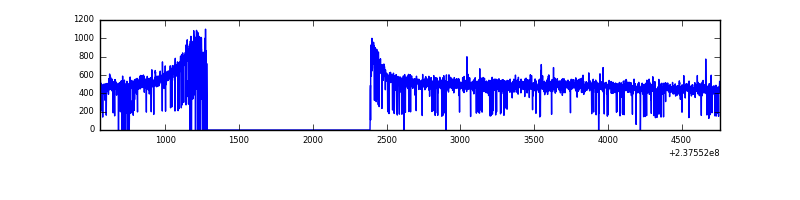 |
| C | 4203 | 3076 | 0 | 0 | 0.00% | 0.00% | 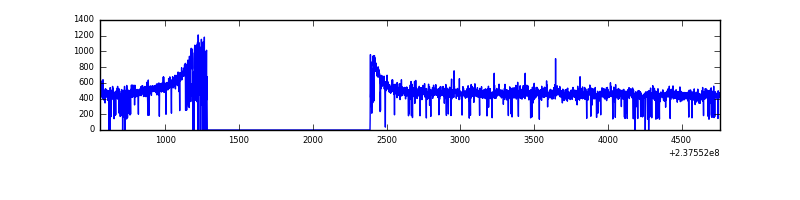 |
| D | 4203 | 3063 | 6 | 6 | 0.14% | 0.20% | 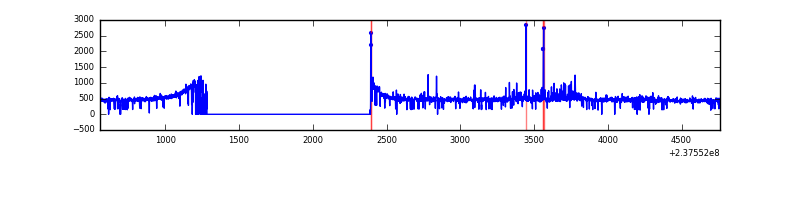 |
Top three noisy pixels from each quadrant. If the there are fewer than three noisy pixels in the level2.evt file, extra rows are filled as -1
| Pixel properties | Quadrant properties | ||||||
|---|---|---|---|---|---|---|---|
| Quadrant | DetID | PixID | Counts | Sigma | Mean | Median | Sigma |
| A | 0 | 226 | 3520 | 39.17 | 390 | 383 | 80.1 |
| A | 12 | 194 | 3014 | 32.85 | 390 | 383 | 80.1 |
| A | 13 | 253 | 2049 | 20.8 | 390 | 383 | 80.1 |
| B | 12 | 111 | 9050 | 113.81 | 382 | 372 | 76.2 |
| B | 11 | 111 | 7249 | 90.19 | 382 | 372 | 76.2 |
| B | 14 | 111 | 5854 | 71.9 | 382 | 372 | 76.2 |
| C | 13 | 61 | 2679 | 25.84 | 376 | 378 | 89.1 |
| C | 7 | 159 | 946 | 6.38 | 376 | 378 | 89.1 |
| C | 3 | 202 | 878 | 5.61 | 376 | 378 | 89.1 |
| D | 2 | 152 | 79667 | 799.33 | 371 | 363 | 99.2 |
| D | 1 | 52 | 12150 | 118.81 | 371 | 363 | 99.2 |
| D | 2 | 234 | 9511 | 92.21 | 371 | 363 | 99.2 |
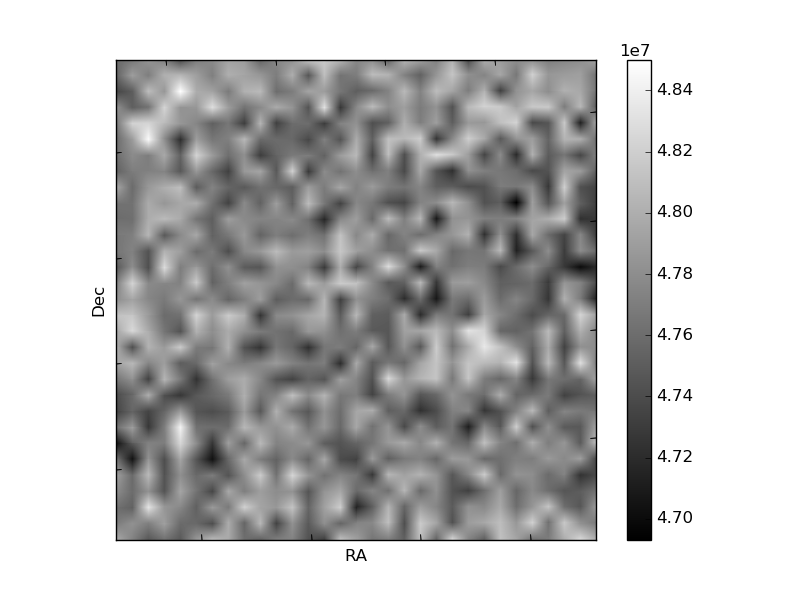
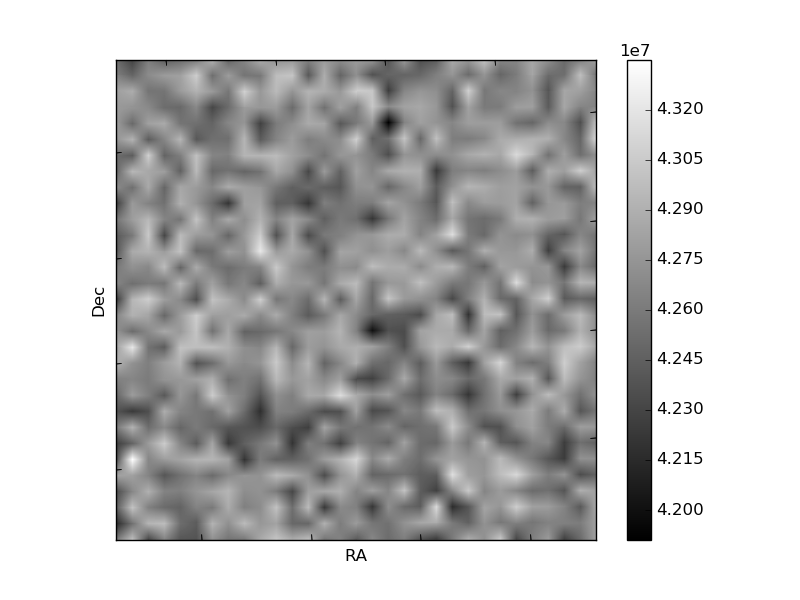
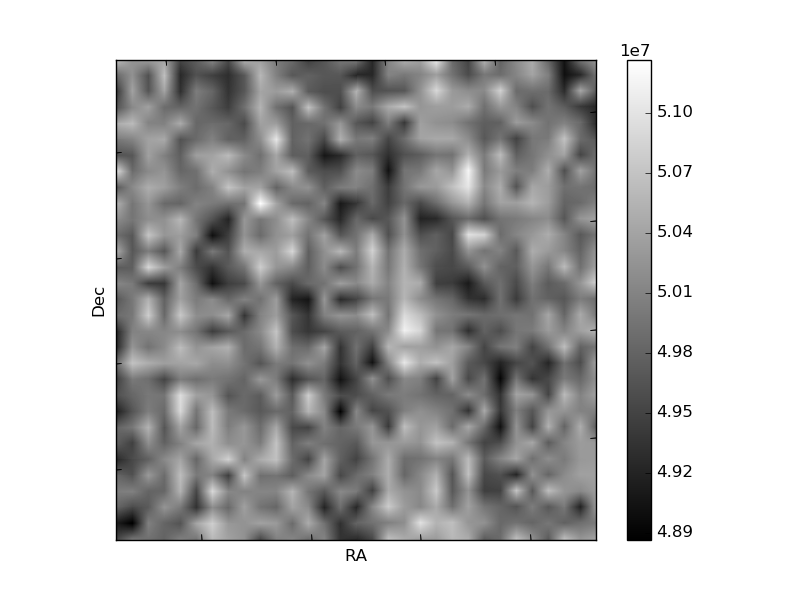
Histogram calculated using DETX and DETY for each event in the final _common_clean file
| Quadrant A | 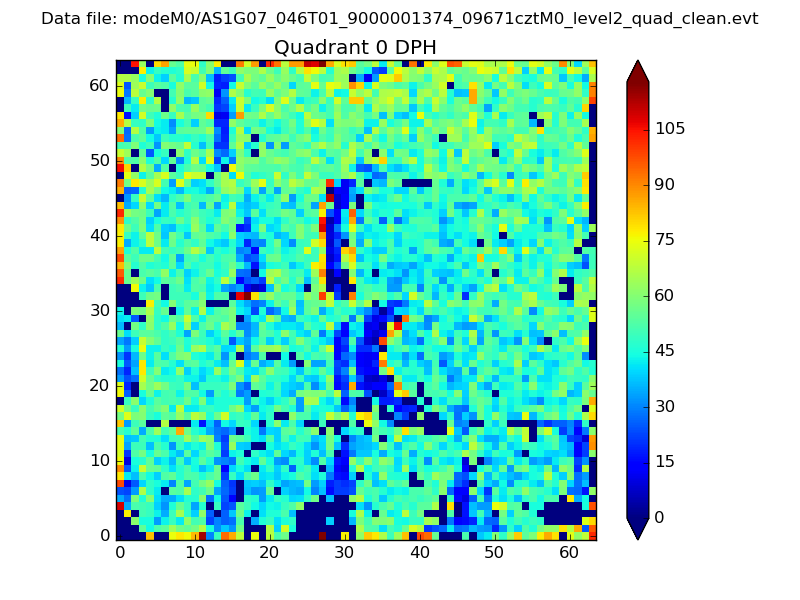 |
 |
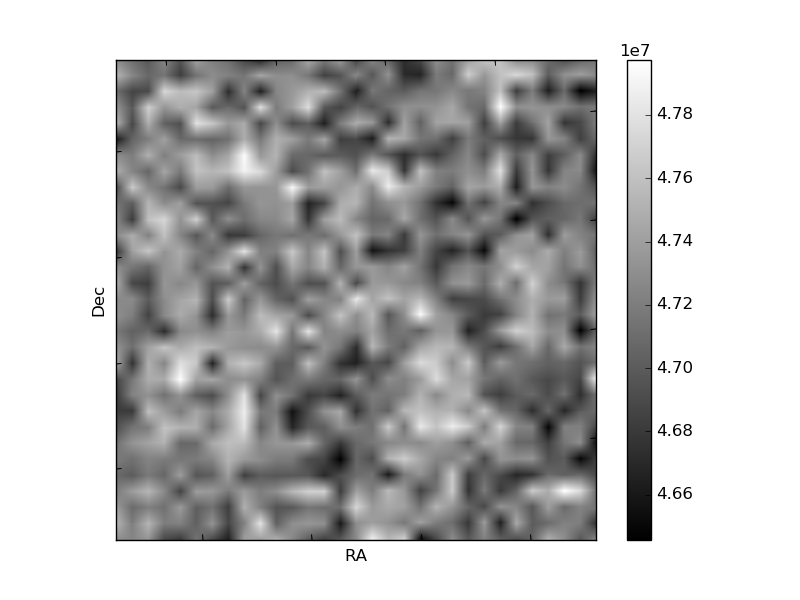
Quadrant B |
|---|---|---|---|
| Quadrant D | 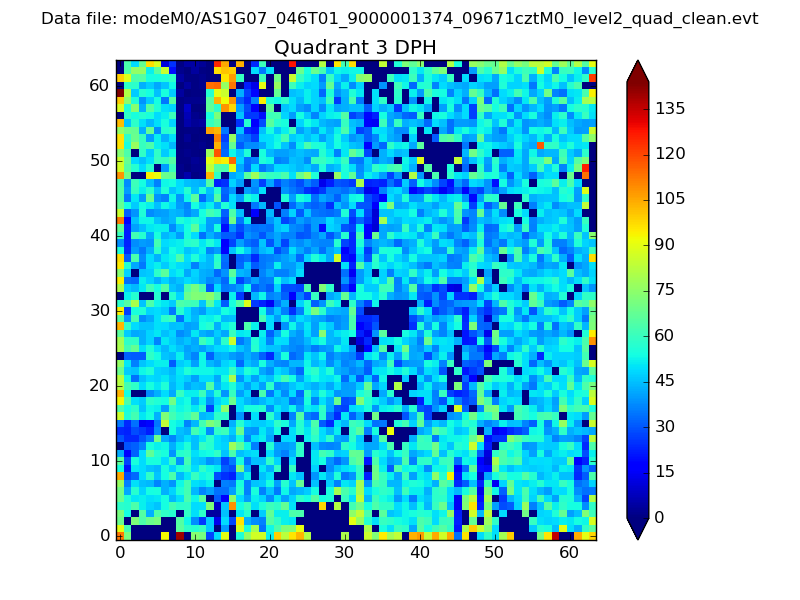 |
 |
Quadrant C |
| Plot type | Count rate plots | Images |
|---|---|---|
| Comparison with Poisson distribution Blue bars denote a histogram of data divided into 1 sec bins. Red curve is a Poisson curve with rate = median count rate of data. |
 |
 |
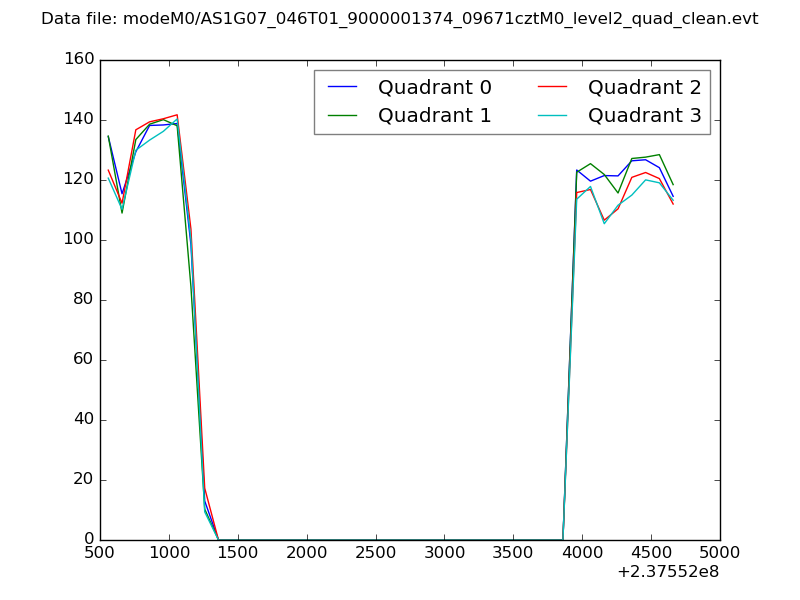
| Quadrant-wise count rates Data is divided into 100 sec bins |
 |
|
| Module-wise count rates for Quadrant A Data is divided into 100 sec bins |
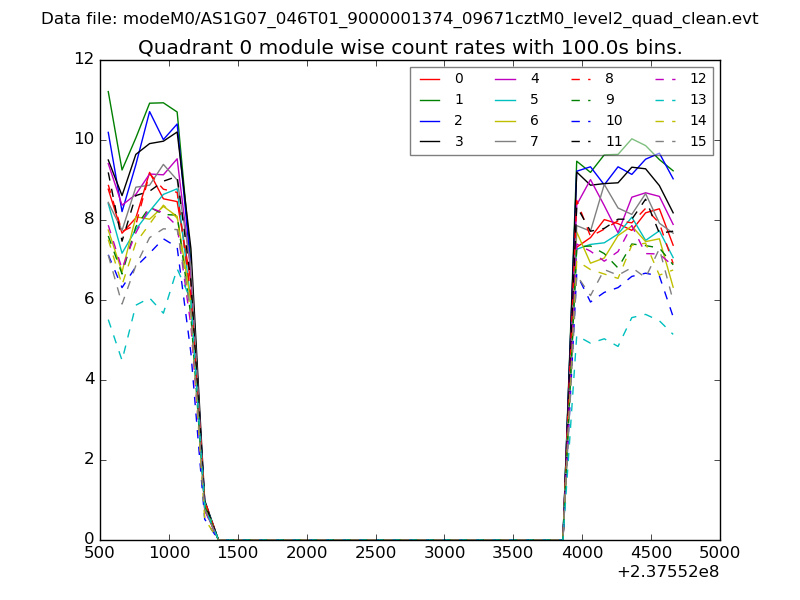 |
 |
| Module-wise count rates for Quadrant B Data is divided into 100 sec bins |
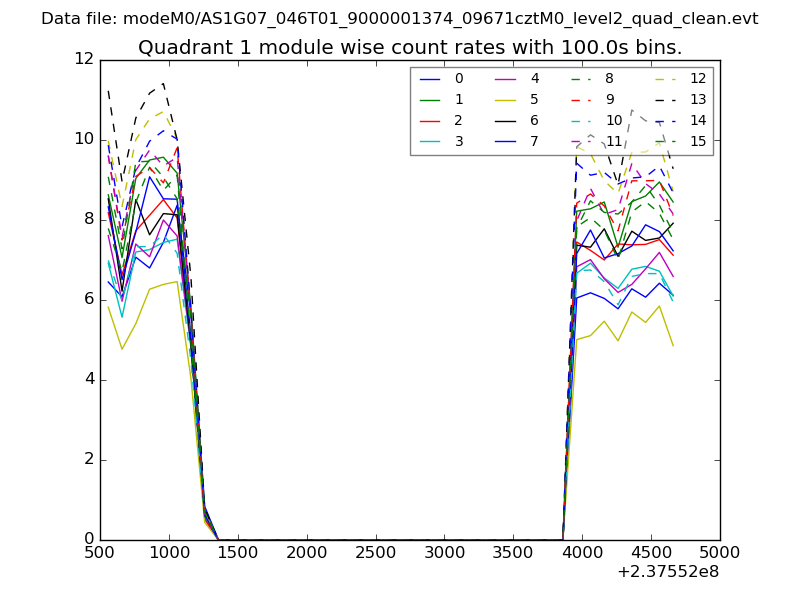 |
 |
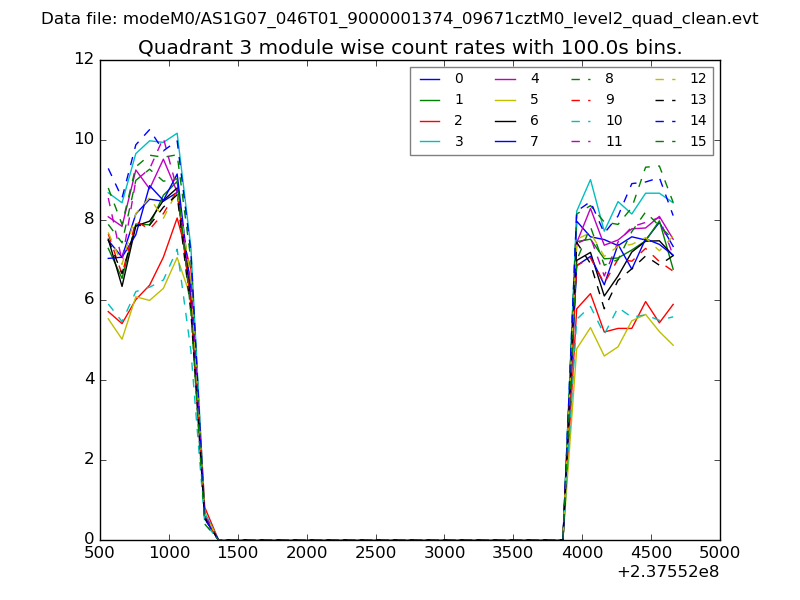
| Module-wise count rates for Quadrant C Data is divided into 100 sec bins |
 |
 |
| Module-wise count rates for Quadrant D Data is divided into 100 sec bins |
 |
 |
| Parameter | Plot |
|---|---|
| CZT HV Monitor |  |
| D_VDD | 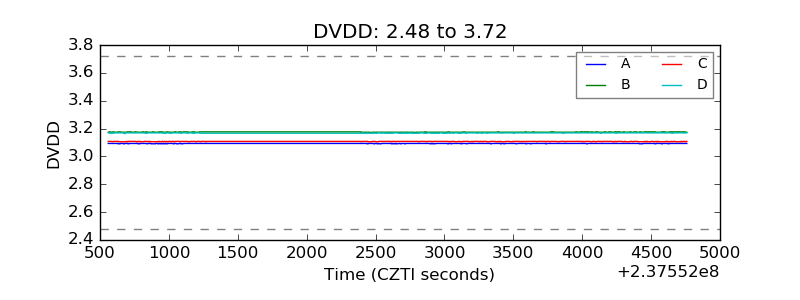 |
| Temperature 1 | 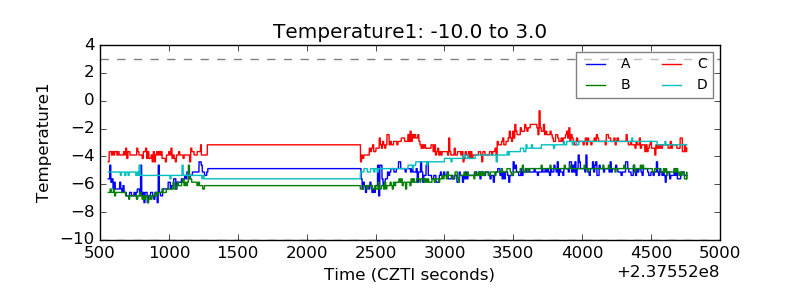 |
| Veto HV Monitor | 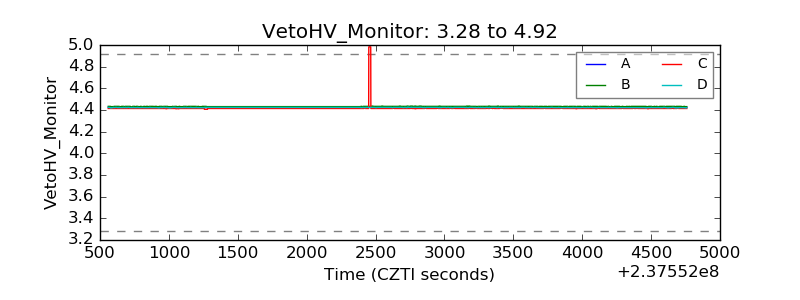 |
| Veto LLD | 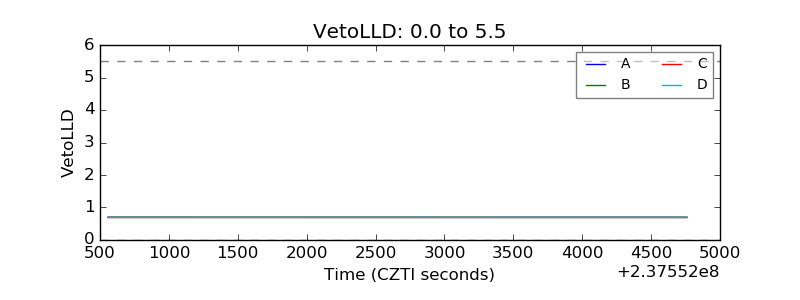 |
| Alpha Counter | 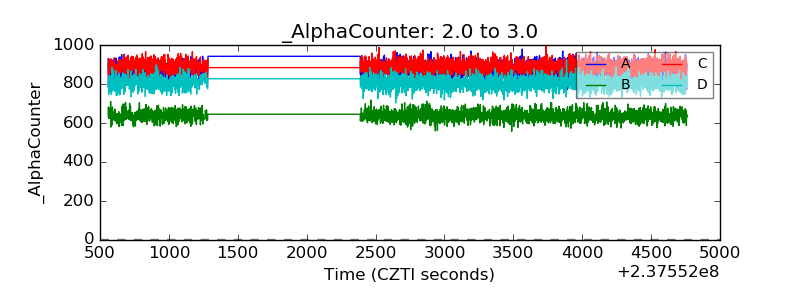 |
| _CPM_Rate | 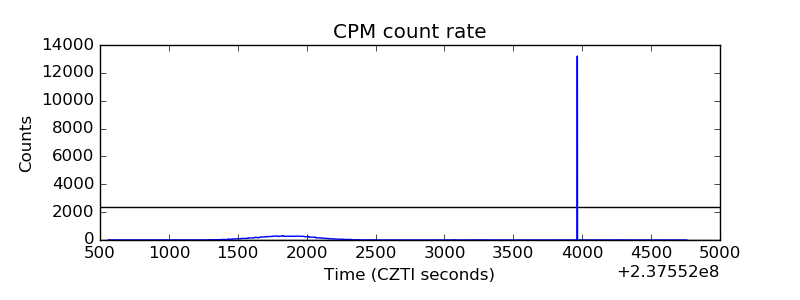 |
| CZT Counter | 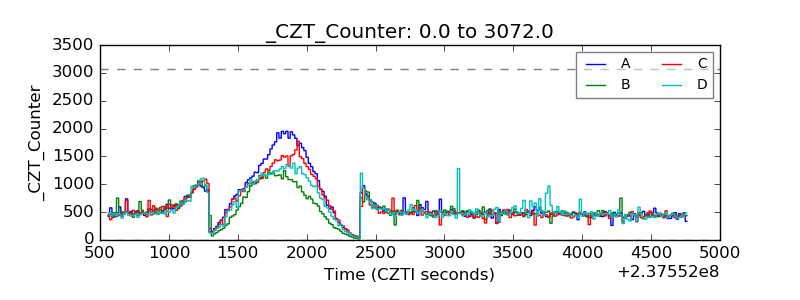 |
| +2.5 Volts monitor |  |
| +5 Volts monitor | 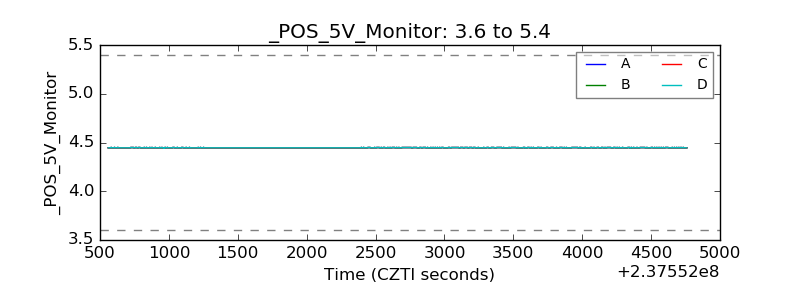 |
| _ROLL_ROT | 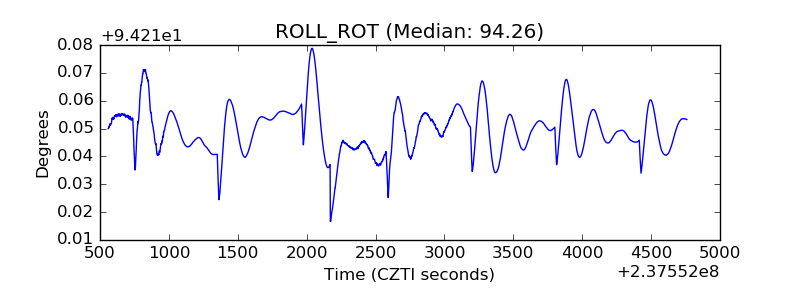 |
| _Roll_DEC | 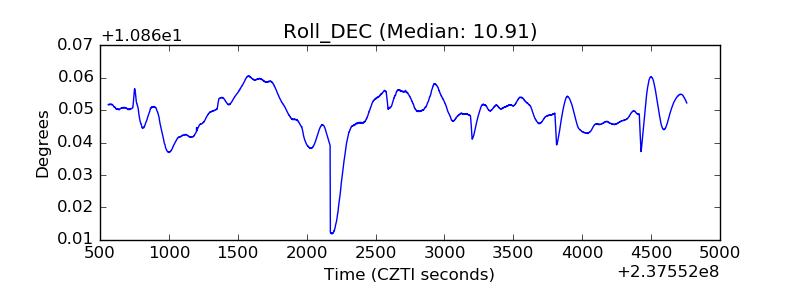 |
| _Roll_RA | 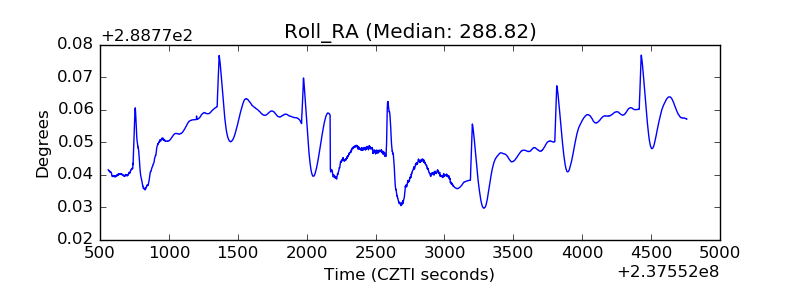 |
| Veto Counter | 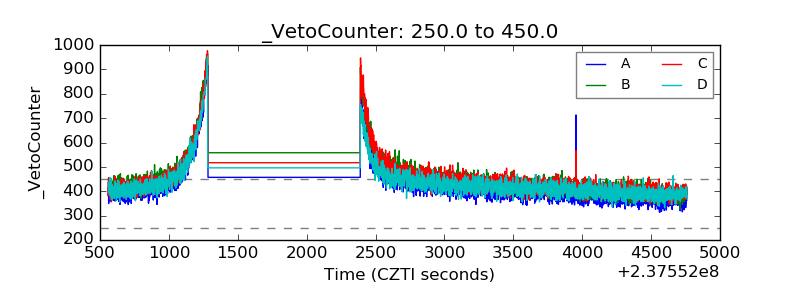 |