| Param | Original file | Final file |
|---|---|---|
| Filename | modeM0/AS1A02_198T01_9000001376cztM0_level2.fits | modeM0/AS1A02_198T01_9000001376cztM0_level2_quad_clean.evt |
| Size (bytes) | 703,082,880 | 736,041,600 |
| Size | 670.5 MB | 701.9 MB |
| Events in quadrant A | 4,255,948 | 4,487,115 |
| Events in quadrant B | 4,096,838 | 4,443,758 |
| Events in quadrant C | 4,210,496 | 4,330,605 |
| Events in quadrant D | 3,632,254 | 3,934,283 |
| Mode M9 | |||
|---|---|---|---|
| Quadrant | BADHDUFLAG | Total packets | Discarded packets |
| A | 0 | 121 | 0 |
| B | 0 | 120 | 0 |
| C | 0 | 120 | 0 |
| D | 0 | 121 | 0 |
| Mode SS | |||
|---|---|---|---|
| Quadrant | BADHDUFLAG | Total packets | Discarded packets |
| A | 0 | 1512 | 0 |
| B | 0 | 1520 | 0 |
| C | 0 | 1512 | 0 |
| D | 0 | 1512 | 0 |
| Mode M0 | |||
|---|---|---|---|
| Quadrant | BADHDUFLAG | Total packets | Discarded packets |
| A | 0 | 158047 | 0 |
| B | 0 | 156969 | 0 |
| C | 0 | 152573 | 0 |
| D | 0 | 183813 | 0 |
| Quadrant | Total seconds | Saturated seconds | Saturation percentage |
|---|---|---|---|
| A | 74347 | 981 | 1.319488% |
| B | 74331 | 913 | 1.228290% |
| C | 74313 | 557 | 0.749532% |
| D | 74292 | 2497 | 3.361062% |
Noise dominated data is calculated using 1-second bins in cleaned event files. If a bin has >2000 counts, and if more than 50% of those come from <1% of pixels, then it is considered to be noise-dominated and hence unusable.
| Quadrant | # 1 sec bins | Bins with >0 counts | Bins with >2000 counts | High rate bins dominated by noise | Noise dominated (total time) | Noise dominated (detector-on time) | Marked lightcurve |
|---|---|---|---|---|---|---|---|
| A | 86973 | 74761 | 0 | 0 | 0.00% | 0.00% | 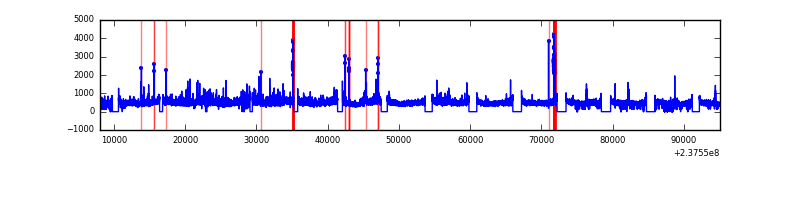 |
| B | 86973 | 74772 | 0 | 0 | 0.00% | 0.00% | 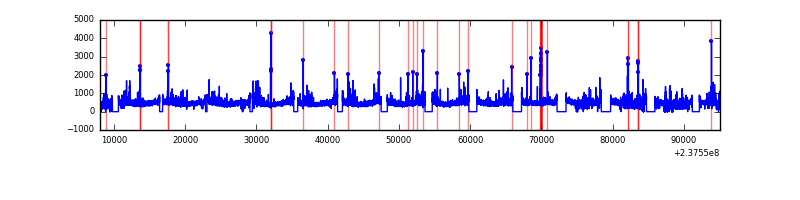 |
| C | 86973 | 74759 | 0 | 0 | 0.00% | 0.00% | 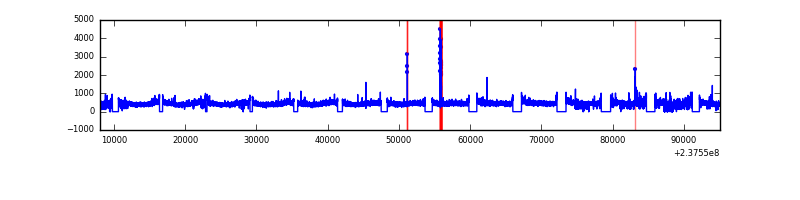 |
| D | 86973 | 74755 | 0 | 0 | 0.00% | 0.00% | 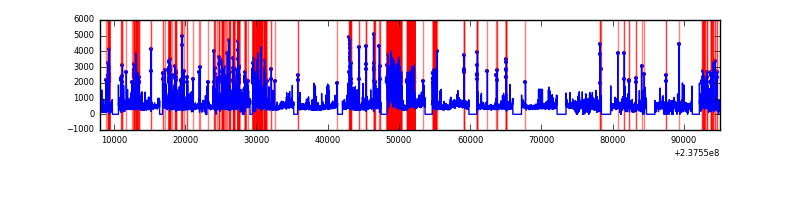 |
Top three noisy pixels from each quadrant. If the there are fewer than three noisy pixels in the level2.evt file, extra rows are filled as -1
| Pixel properties | Quadrant properties | ||||||
|---|---|---|---|---|---|---|---|
| Quadrant | DetID | PixID | Counts | Sigma | Mean | Median | Sigma |
| A | 0 | 29 | 4055 | 10.93 | 1105 | 1034 | 276.3 |
| A | 7 | 110 | 3511 | 8.96 | 1105 | 1034 | 276.3 |
| A | 9 | 19 | 3186 | 7.79 | 1105 | 1034 | 276.3 |
| B | 2 | 9 | 3572 | 11.95 | 1082 | 1034 | 212.3 |
| B | 3 | 17 | 2747 | 8.07 | 1082 | 1034 | 212.3 |
| B | 12 | 226 | 2741 | 8.04 | 1082 | 1034 | 212.3 |
| C | 1 | 80 | 3096 | 7.14 | 1111 | 1032 | 289.2 |
| C | 1 | 81 | 3082 | 7.09 | 1111 | 1032 | 289.2 |
| C | 12 | 241 | 2960 | 6.67 | 1111 | 1032 | 289.2 |
| D | 3 | 14 | 2673 | 6.25 | 1034 | 941 | 277.2 |
| D | 6 | 231 | 2656 | 6.19 | 1034 | 941 | 277.2 |
| D | 10 | 189 | 2567 | 5.87 | 1034 | 941 | 277.2 |
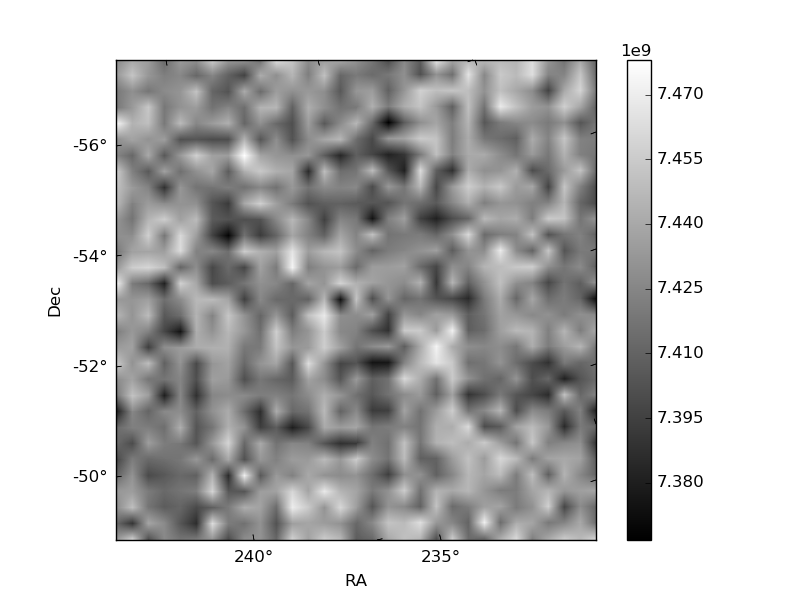
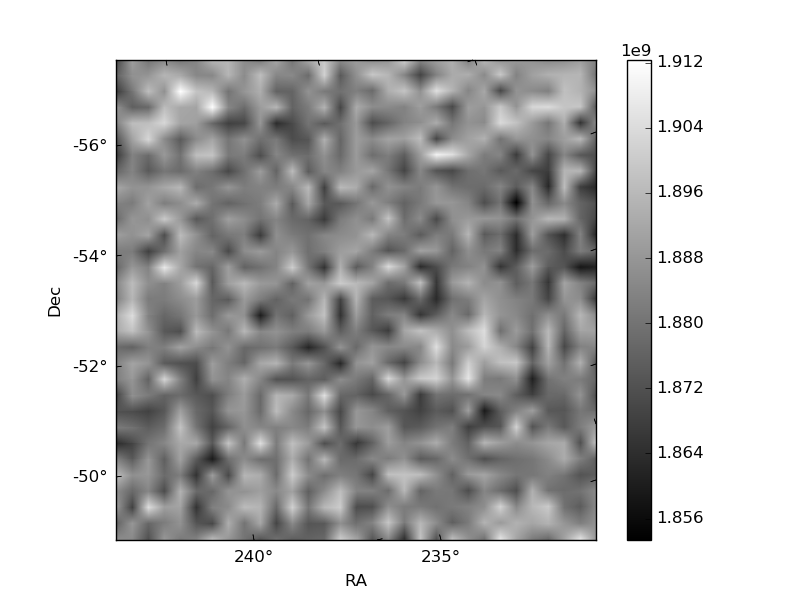
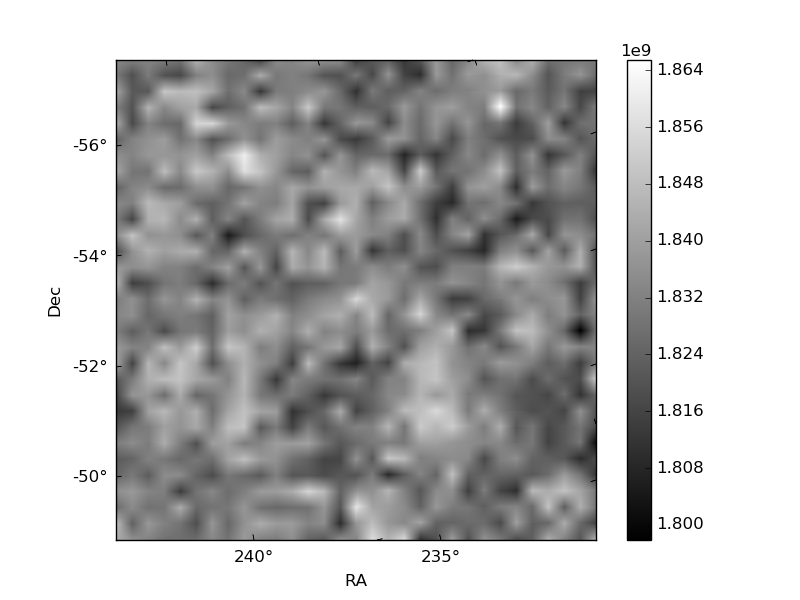
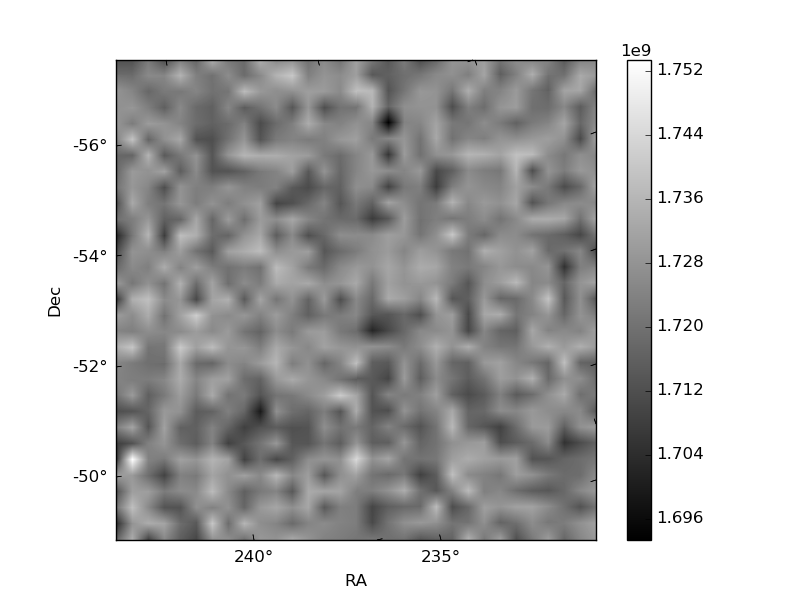
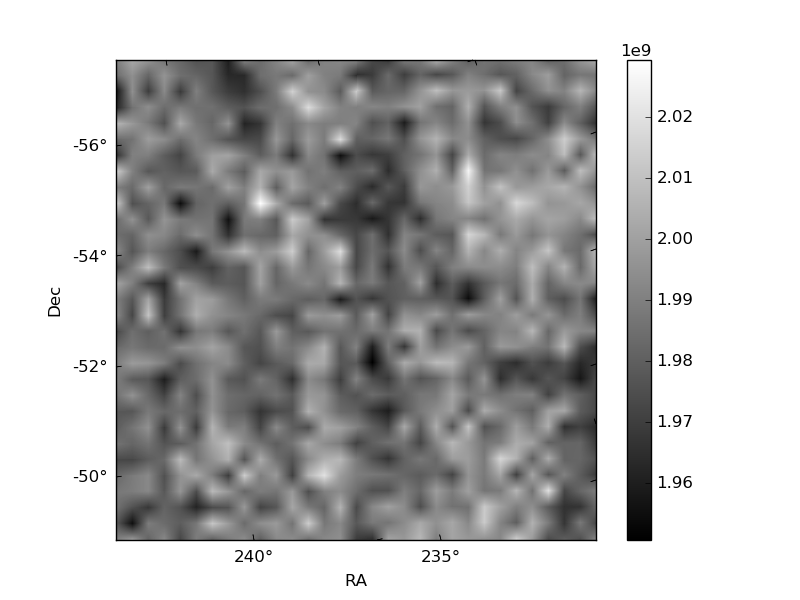
Histogram calculated using DETX and DETY for each event in the final _common_clean file
| Quadrant A | 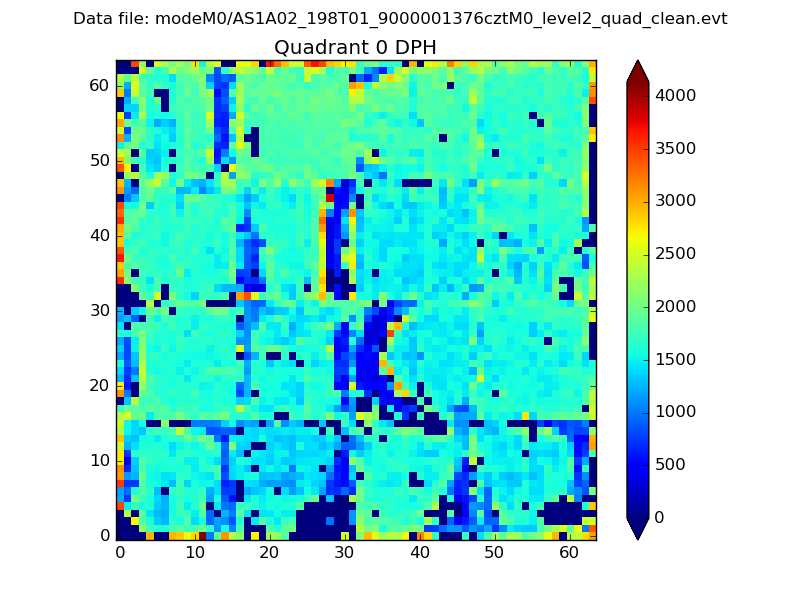 |
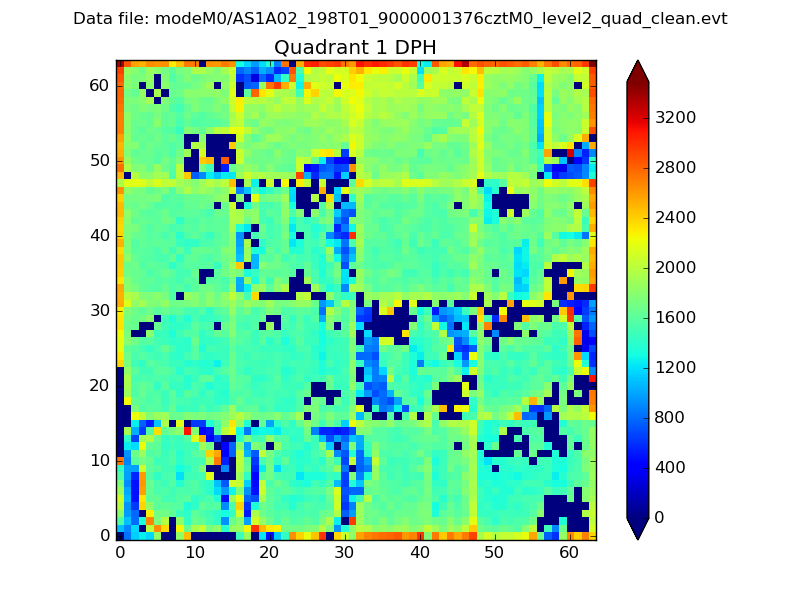 |
Quadrant B |
|---|---|---|---|
| Quadrant D | 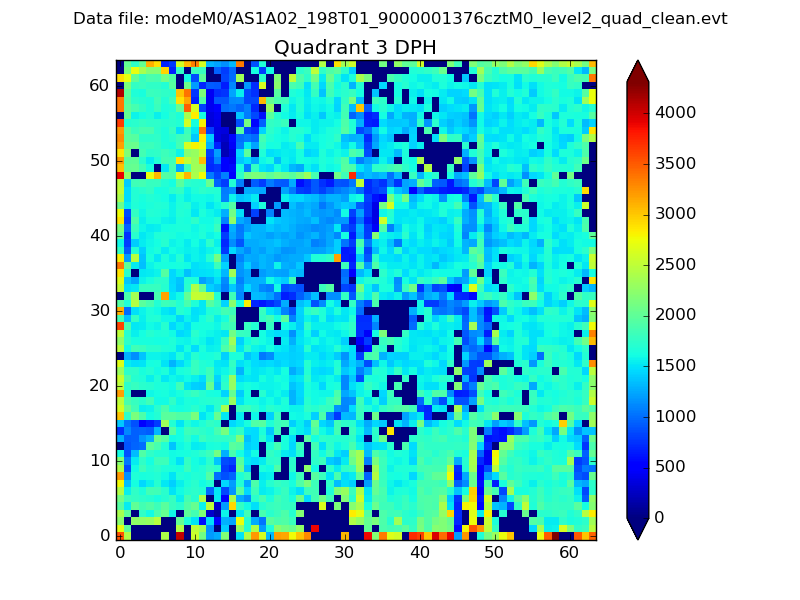 |
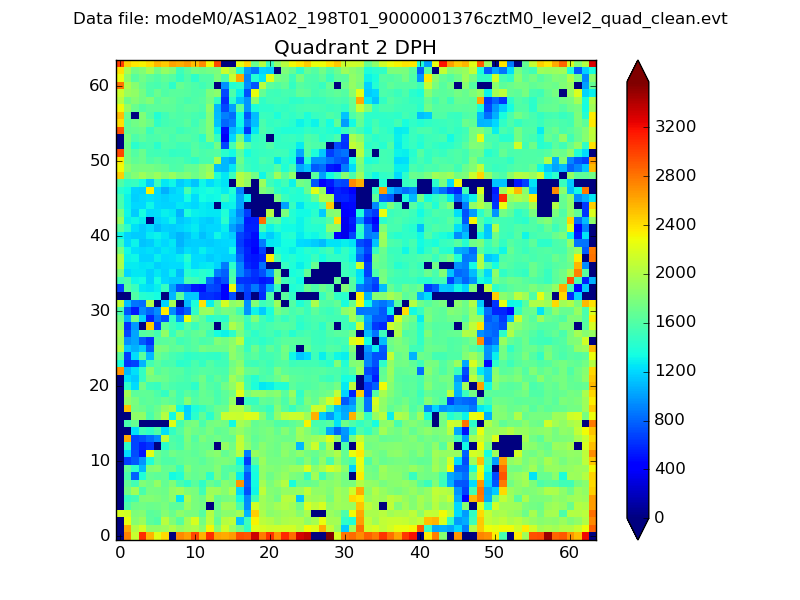 |
Quadrant C |
| Plot type | Count rate plots | Images |
|---|---|---|
| Comparison with Poisson distribution Blue bars denote a histogram of data divided into 1 sec bins. Red curve is a Poisson curve with rate = median count rate of data. |
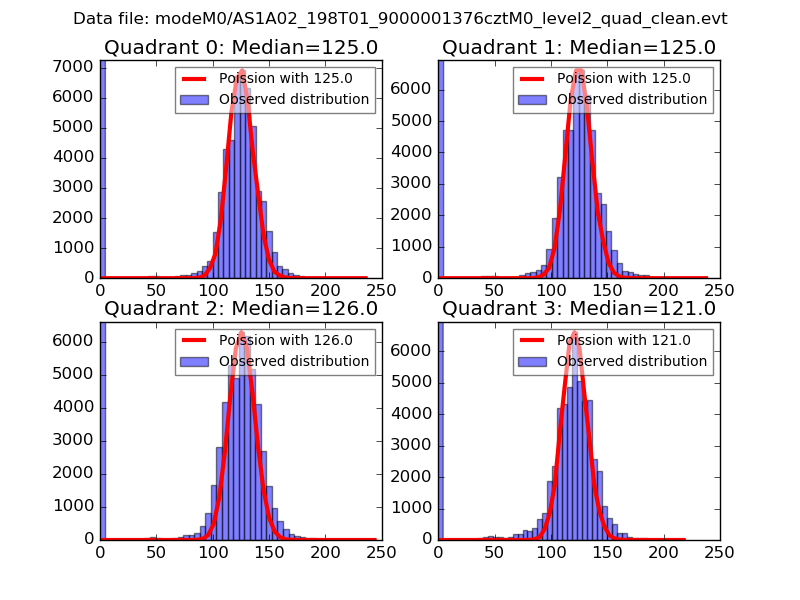 |
 |
| Quadrant-wise count rates Data is divided into 100 sec bins |
 |
|
| Module-wise count rates for Quadrant A Data is divided into 100 sec bins |
 |
 |
| Module-wise count rates for Quadrant B Data is divided into 100 sec bins |
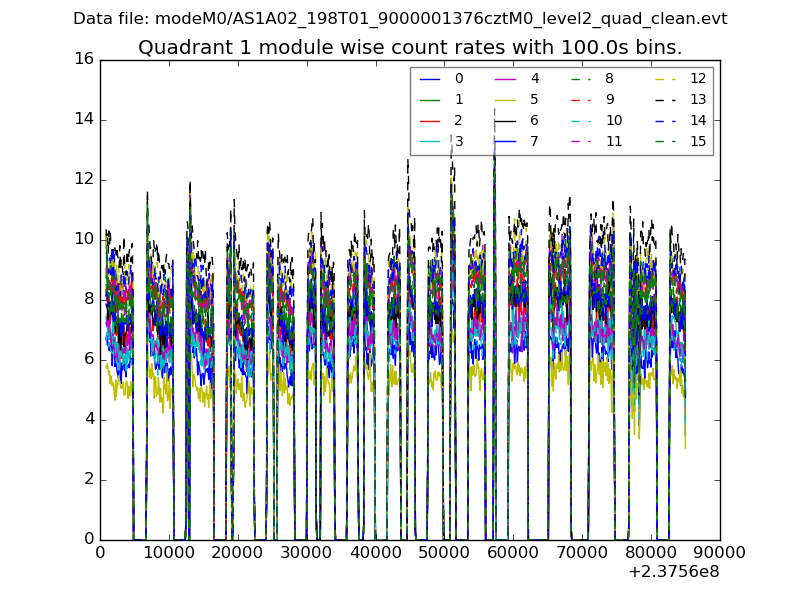 |
 |
| Module-wise count rates for Quadrant C Data is divided into 100 sec bins |
 |
 |
| Module-wise count rates for Quadrant D Data is divided into 100 sec bins |
 |
 |
| Parameter | Plot |
|---|---|
| CZT HV Monitor | 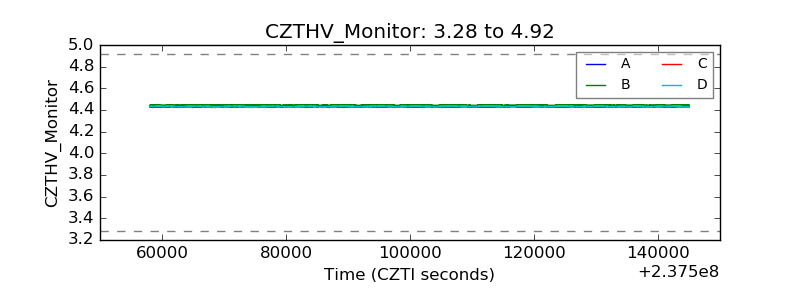 |
| D_VDD | 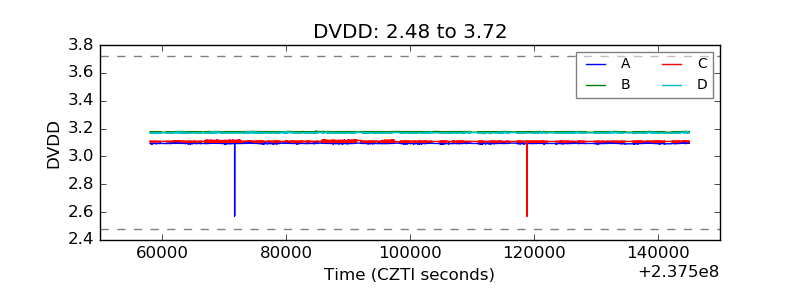 |
| Temperature 1 | 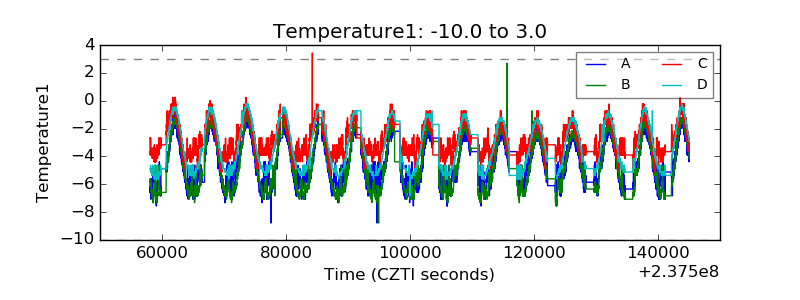 |
| Veto HV Monitor |  |
| Veto LLD | 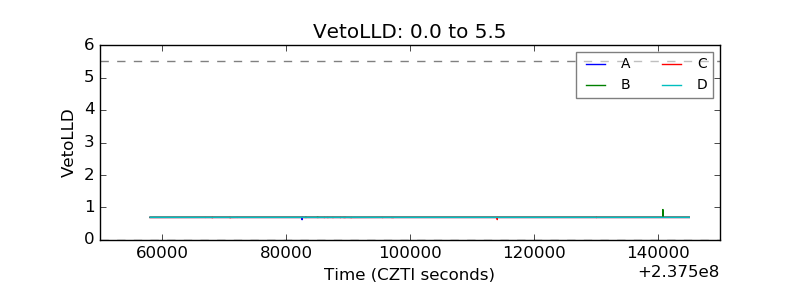 |
| Alpha Counter | 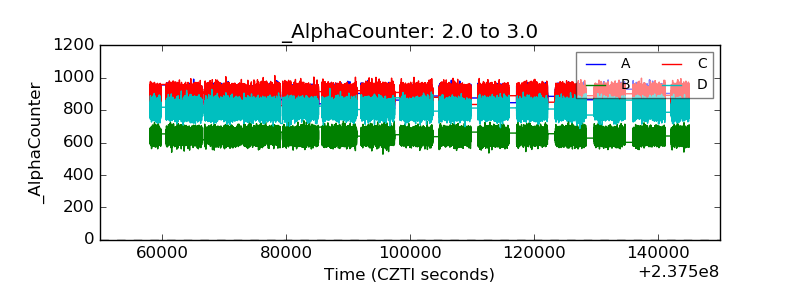 |
| _CPM_Rate | 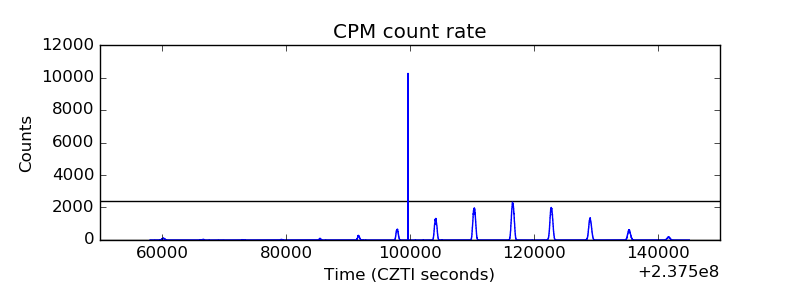 |
| CZT Counter | 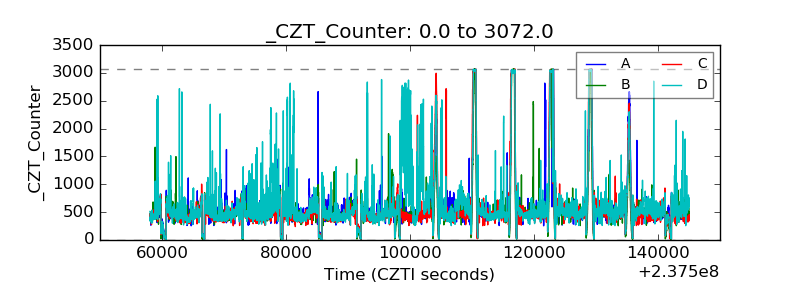 |
| +2.5 Volts monitor | 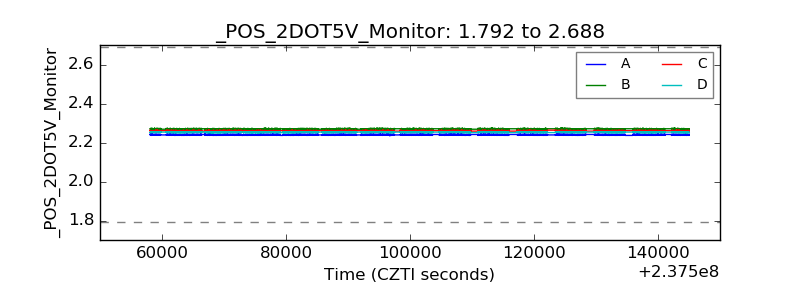 |
| +5 Volts monitor |  |
| _ROLL_ROT | 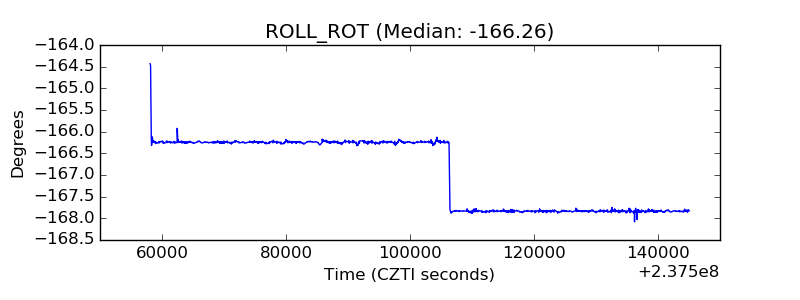 |
| _Roll_DEC |  |
| _Roll_RA | 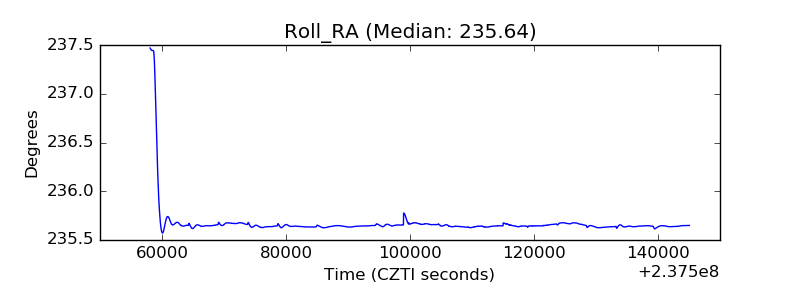 |
| Veto Counter |  |