| Param | Original file | Final file |
|---|---|---|
| Filename | modeM0/AS1A02_198T01_9000001376_09671cztM0_level2.evt | modeM0/AS1A02_198T01_9000001376_09671cztM0_level2_quad_clean.evt |
| Size (bytes) | 204,667,200 | 38,378,880 |
| Size | 195.2 MB | 36.6 MB |
| Events in quadrant A | 1,456,775 | 238,756 |
| Events in quadrant B | 1,527,836 | 241,873 |
| Events in quadrant C | 1,422,749 | 237,857 |
| Events in quadrant D | 1,585,161 | 230,187 |
| Mode M9 | |||
|---|---|---|---|
| Quadrant | BADHDUFLAG | Total packets | Discarded packets |
| A | 0 | 8 | 0 |
| B | 0 | 8 | 0 |
| C | 0 | 8 | 1 |
| D | 0 | 8 | 0 |
| Mode SS | |||
|---|---|---|---|
| Quadrant | BADHDUFLAG | Total packets | Discarded packets |
| A | 0 | 64 | 2 |
| B | 0 | 64 | 0 |
| C | 0 | 64 | 0 |
| D | 0 | 64 | 4 |
| Mode M0 | |||
|---|---|---|---|
| Quadrant | BADHDUFLAG | Total packets | Discarded packets |
| A | 0 | 6400 | 157 |
| B | 0 | 6593 | 159 |
| C | 0 | 6360 | 158 |
| D | 0 | 6911 | 172 |
| Quadrant | Total seconds | Saturated seconds | Saturation percentage |
|---|---|---|---|
| A | 2988 | 97 | 3.246319% |
| B | 2987 | 93 | 3.113492% |
| C | 2986 | 78 | 2.612190% |
| D | 2986 | 126 | 4.219692% |
Noise dominated data is calculated using 1-second bins in cleaned event files. If a bin has >2000 counts, and if more than 50% of those come from <1% of pixels, then it is considered to be noise-dominated and hence unusable.
| Quadrant | # 1 sec bins | Bins with >0 counts | Bins with >2000 counts | High rate bins dominated by noise | Noise dominated (total time) | Noise dominated (detector-on time) | Marked lightcurve |
|---|---|---|---|---|---|---|---|
| A | 3918 | 3060 | 0 | 0 | 0.00% | 0.00% | 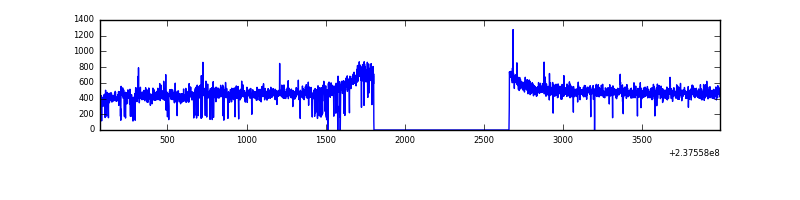 |
| B | 3918 | 3057 | 1 | 1 | 0.03% | 0.03% | 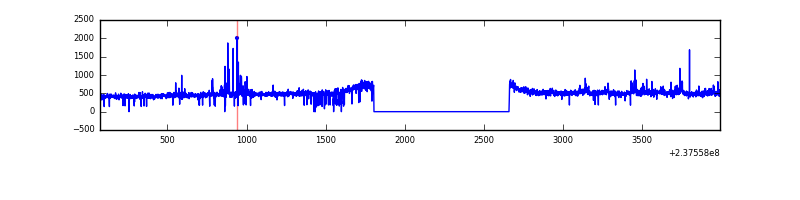 |
| C | 3918 | 3061 | 0 | 0 | 0.00% | 0.00% | 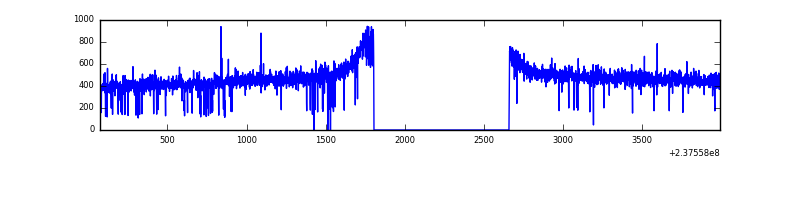 |
| D | 3918 | 3061 | 30 | 30 | 0.77% | 0.98% | 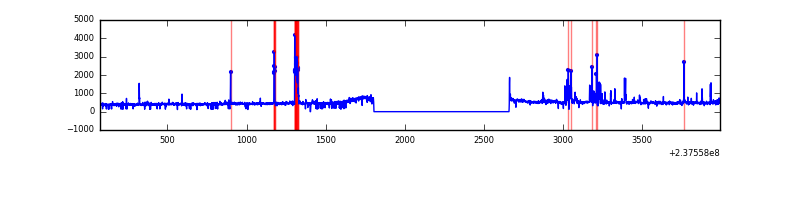 |
Top three noisy pixels from each quadrant. If the there are fewer than three noisy pixels in the level2.evt file, extra rows are filled as -1
| Pixel properties | Quadrant properties | ||||||
|---|---|---|---|---|---|---|---|
| Quadrant | DetID | PixID | Counts | Sigma | Mean | Median | Sigma |
| A | 1 | 162 | 15175 | 190.92 | 370 | 362 | 77.6 |
| A | 1 | 178 | 5402 | 64.96 | 370 | 362 | 77.6 |
| A | 1 | 161 | 4986 | 59.6 | 370 | 362 | 77.6 |
| B | 10 | 252 | 44492 | 607.7 | 371 | 362 | 72.6 |
| B | 0 | 219 | 11676 | 155.8 | 371 | 362 | 72.6 |
| B | 15 | 85 | 10642 | 141.56 | 371 | 362 | 72.6 |
| C | 13 | 61 | 2807 | 28.7 | 364 | 365 | 85.1 |
| C | 14 | 234 | 959 | 6.98 | 364 | 365 | 85.1 |
| C | 3 | 202 | 915 | 6.46 | 364 | 365 | 85.1 |
| D | 12 | 233 | 94057 | 998.5 | 359 | 350 | 93.8 |
| D | 2 | 152 | 81398 | 863.61 | 359 | 350 | 93.8 |
| D | 8 | 195 | 17767 | 185.59 | 359 | 350 | 93.8 |
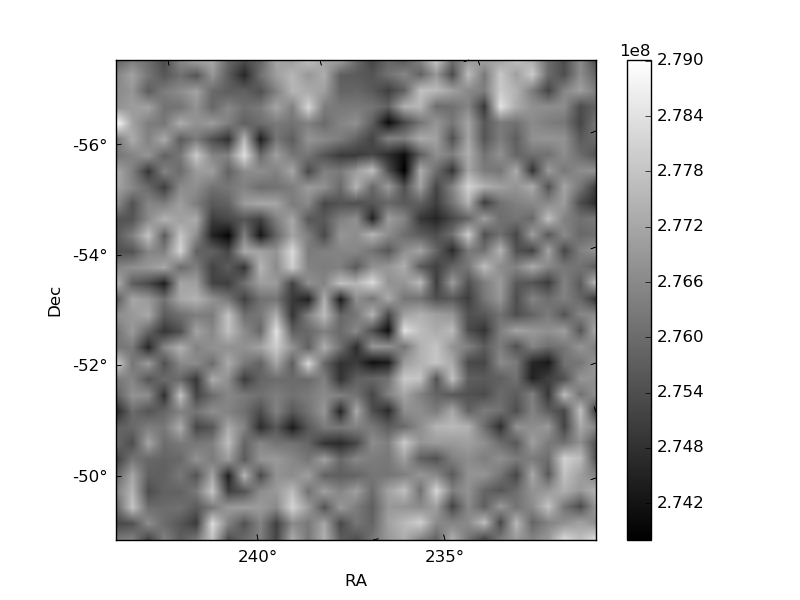
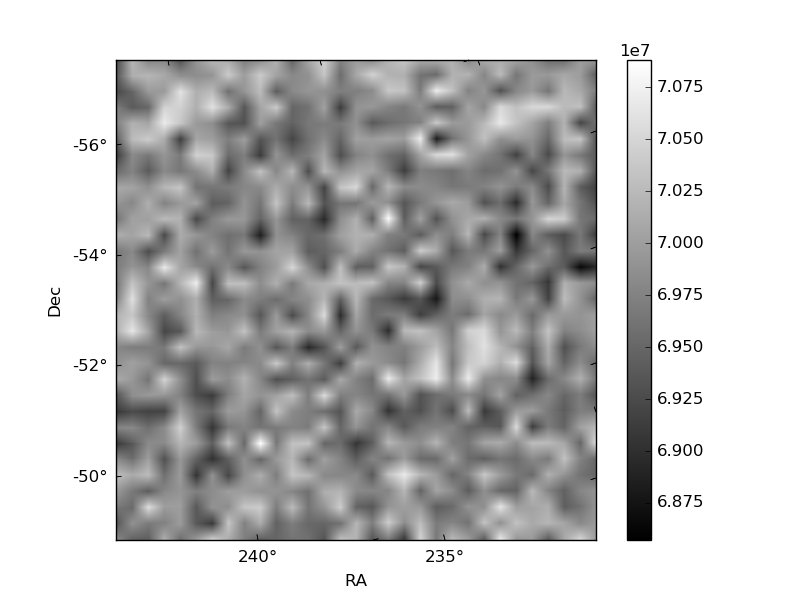
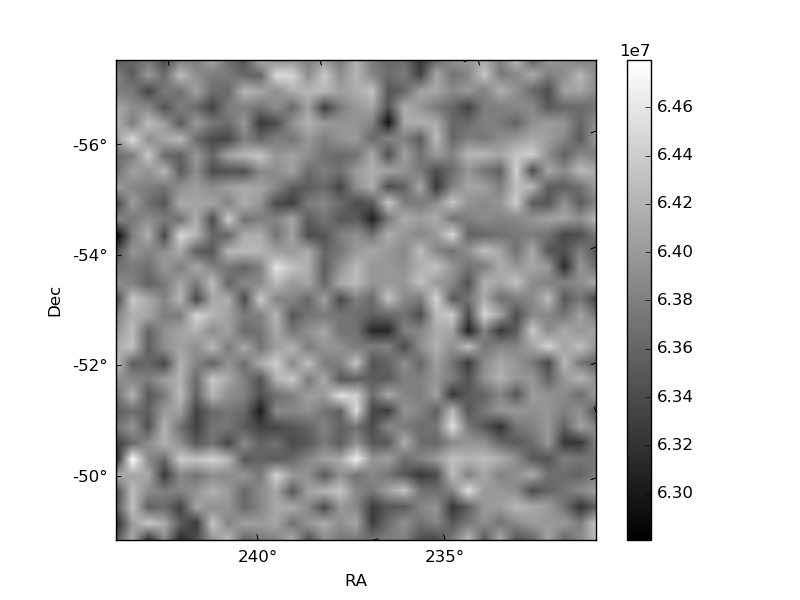
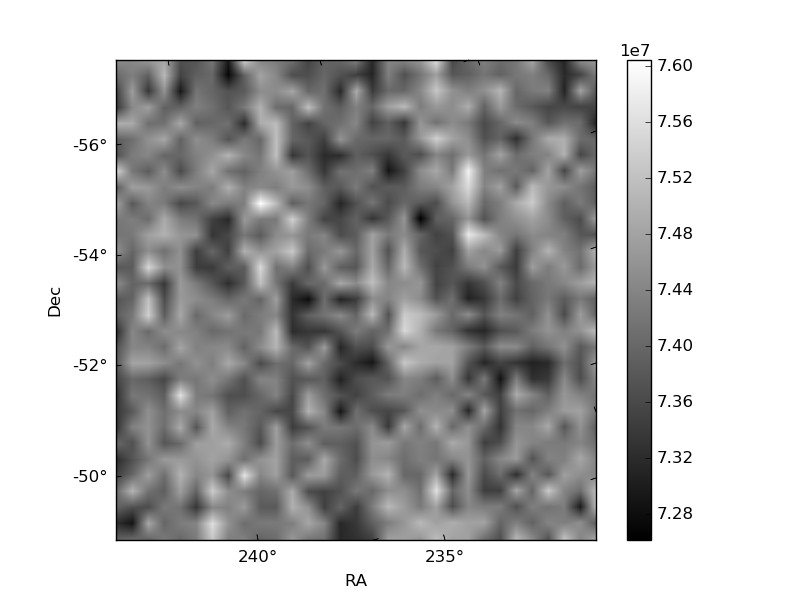
Histogram calculated using DETX and DETY for each event in the final _common_clean file
| Quadrant A | 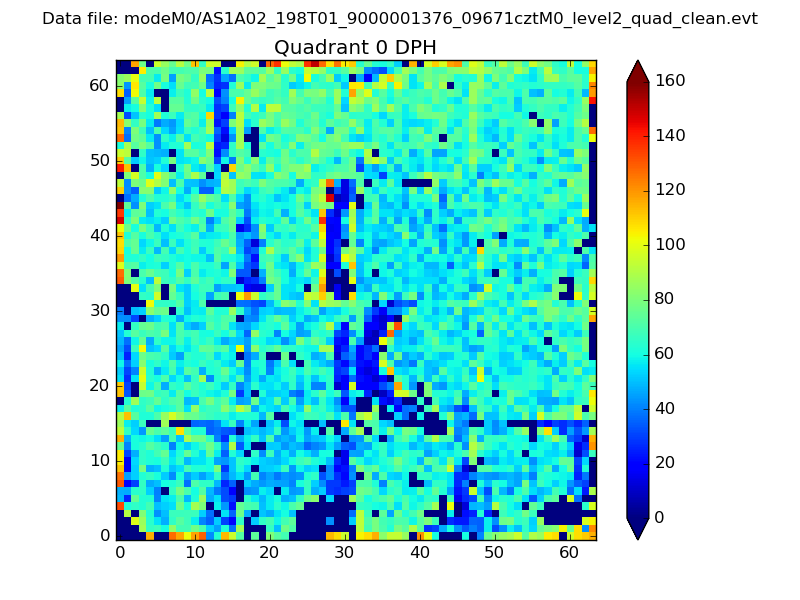 |
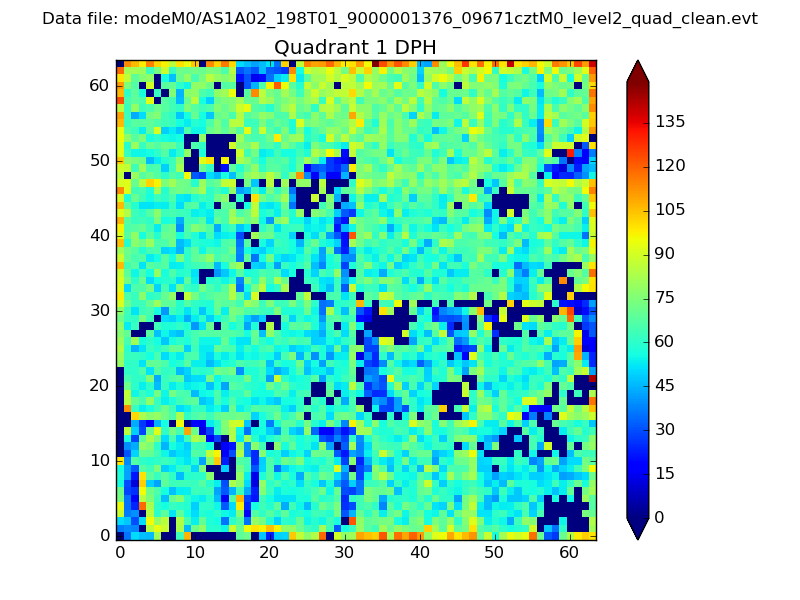 |
Quadrant B |
|---|---|---|---|
| Quadrant D | 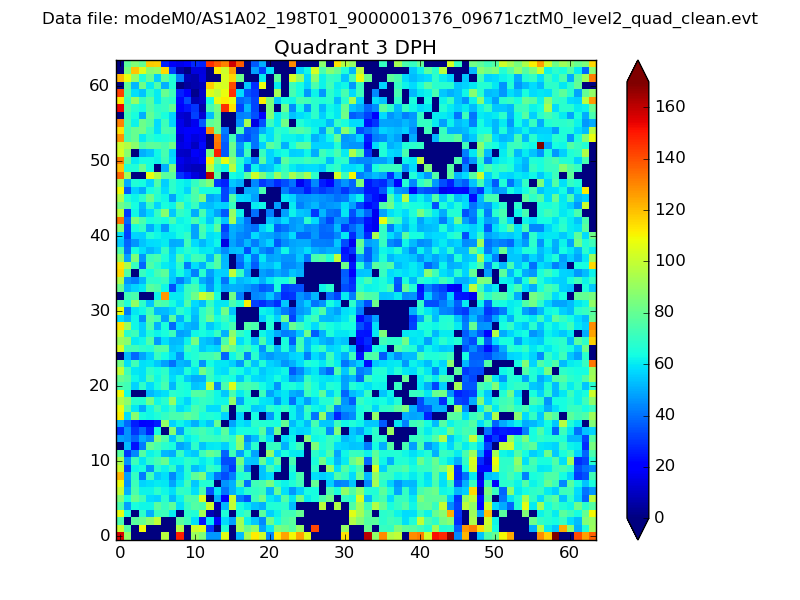 |
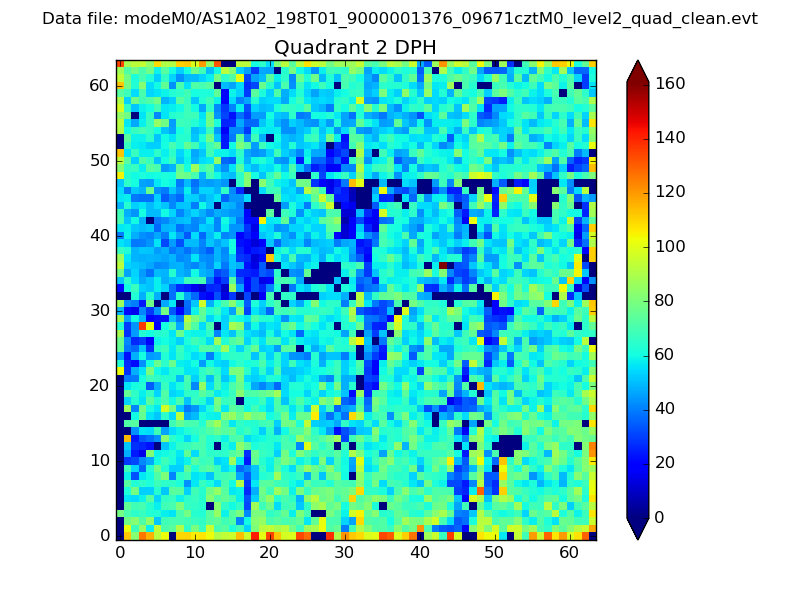 |
Quadrant C |
| Plot type | Count rate plots | Images |
|---|---|---|
| Comparison with Poisson distribution Blue bars denote a histogram of data divided into 1 sec bins. Red curve is a Poisson curve with rate = median count rate of data. |
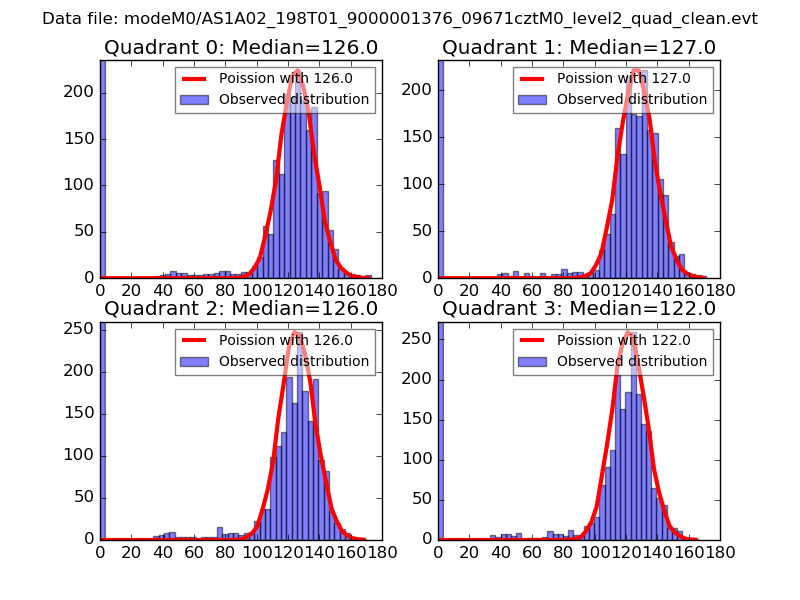 |
 |
| Quadrant-wise count rates Data is divided into 100 sec bins |
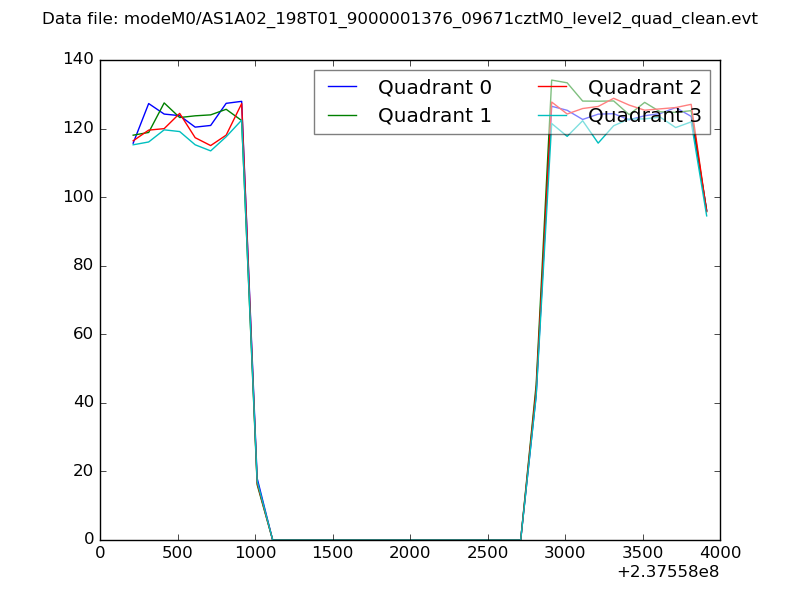 |
|
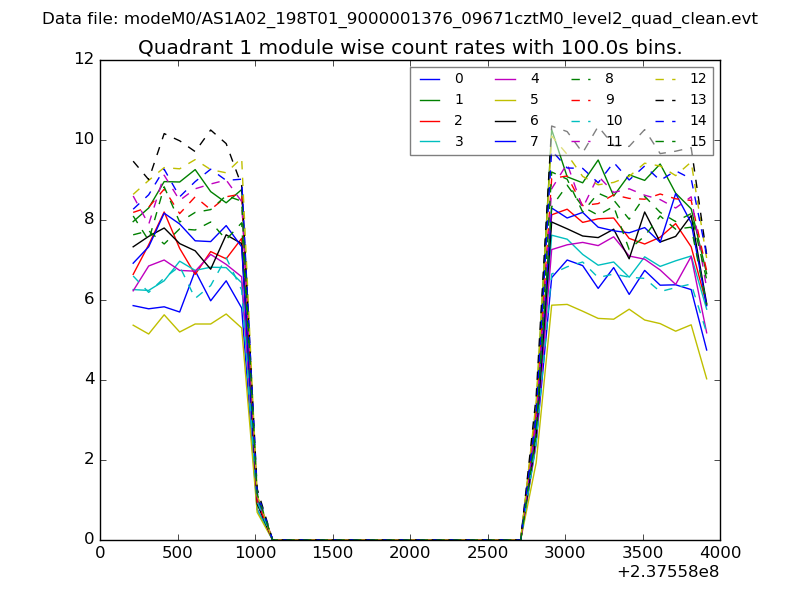
| Module-wise count rates for Quadrant A Data is divided into 100 sec bins |
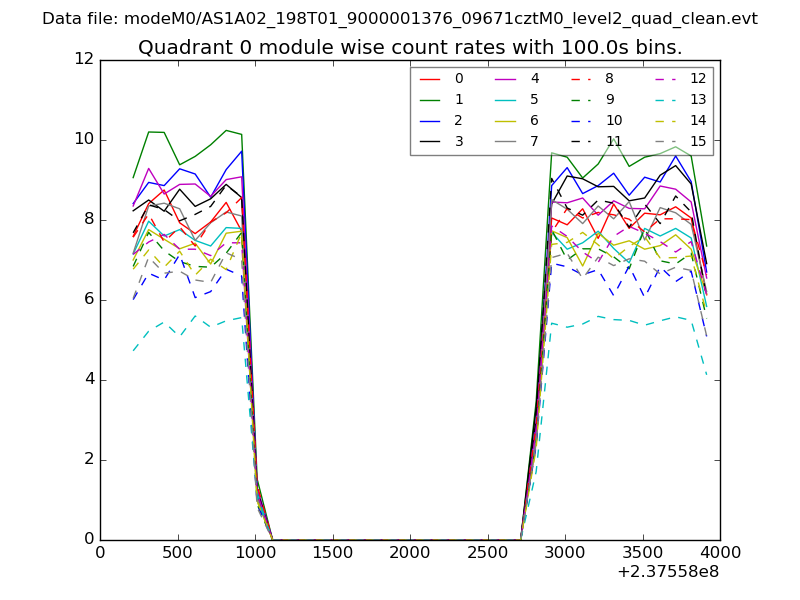 |
 |
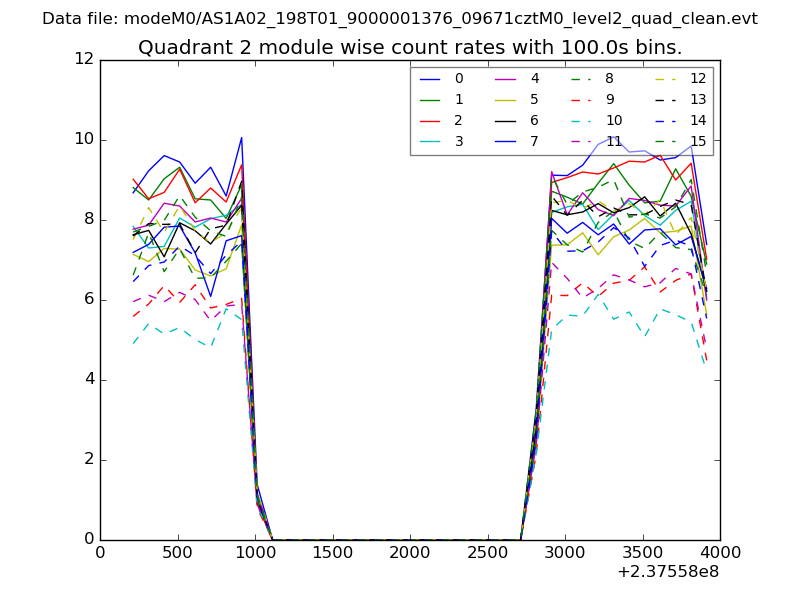
| Module-wise count rates for Quadrant B Data is divided into 100 sec bins |
 |
 |
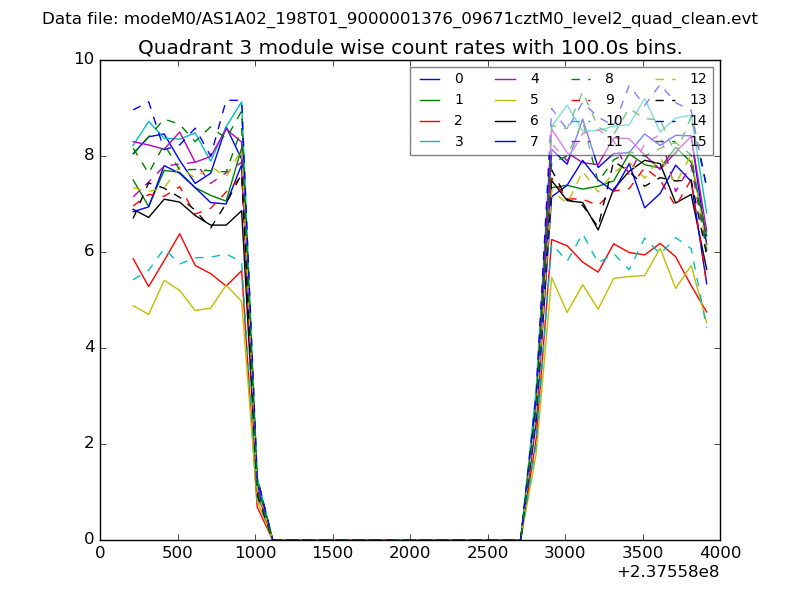
| Module-wise count rates for Quadrant C Data is divided into 100 sec bins |
 |
 |
| Module-wise count rates for Quadrant D Data is divided into 100 sec bins |
 |
 |
| Parameter | Plot |
|---|---|
| CZT HV Monitor | 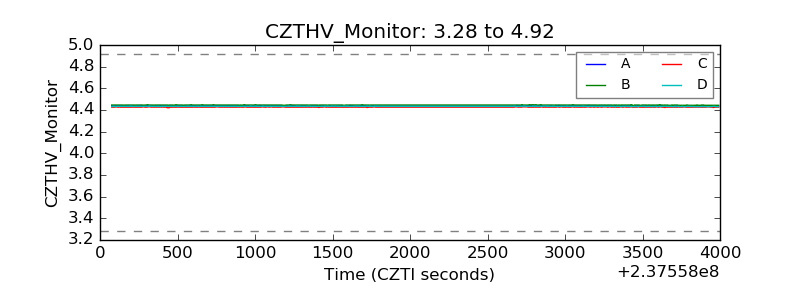 |
| D_VDD | 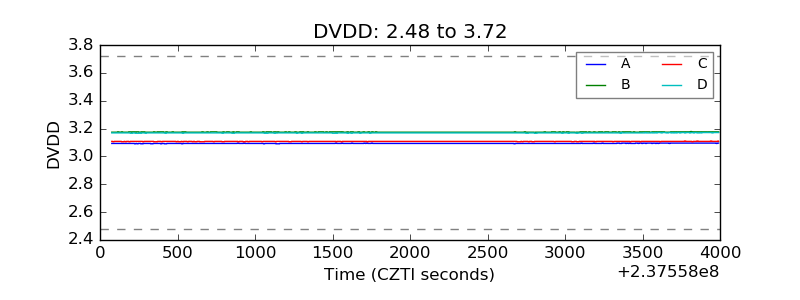 |
| Temperature 1 | 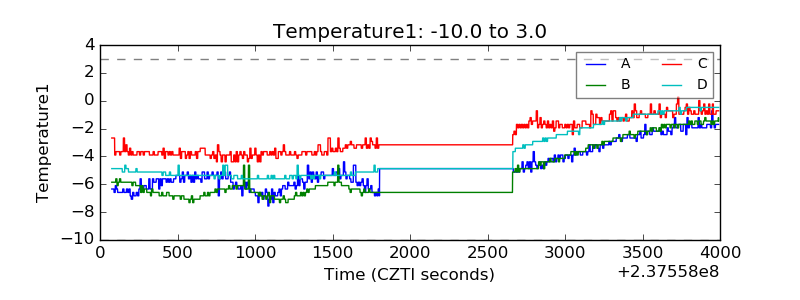 |
| Veto HV Monitor | 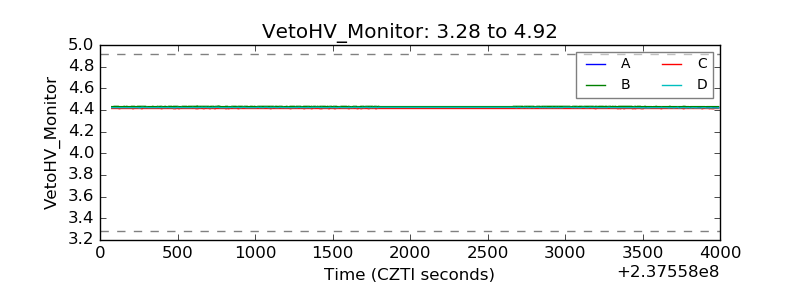 |
| Veto LLD | 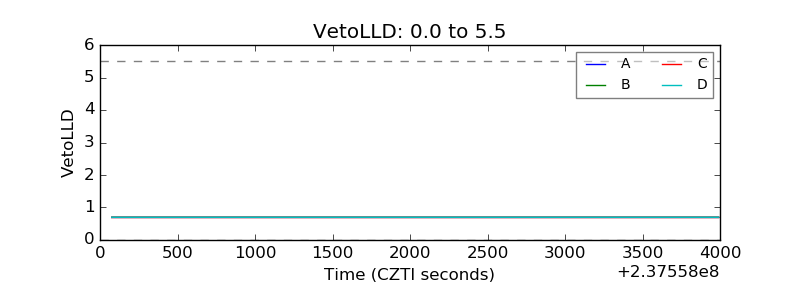 |
| Alpha Counter | 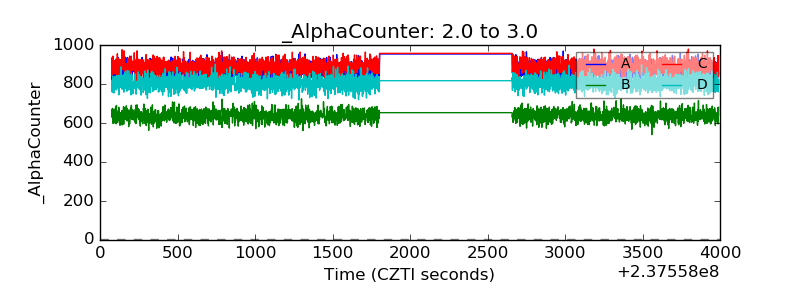 |
| _CPM_Rate |  |
| CZT Counter | 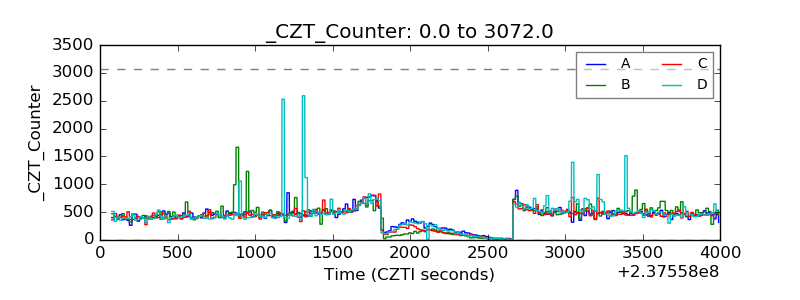 |
| +2.5 Volts monitor |  |
| +5 Volts monitor |  |
| _ROLL_ROT | 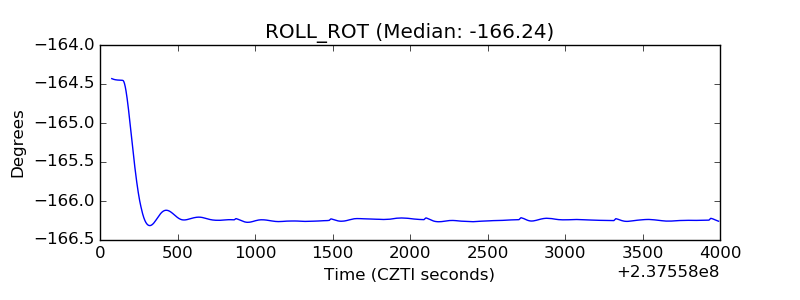 |
| _Roll_DEC | 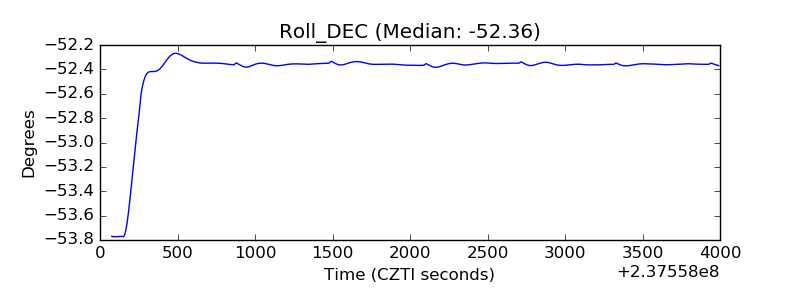 |
| _Roll_RA | 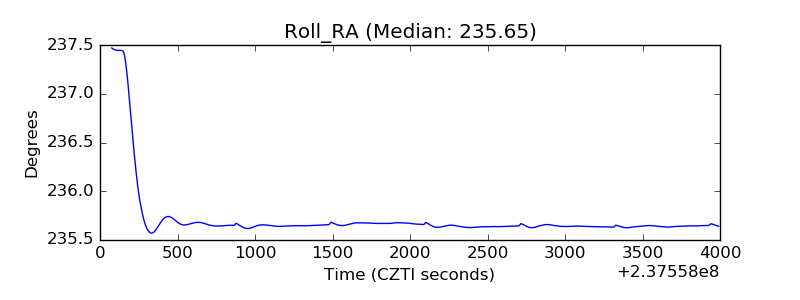 |
| Veto Counter | 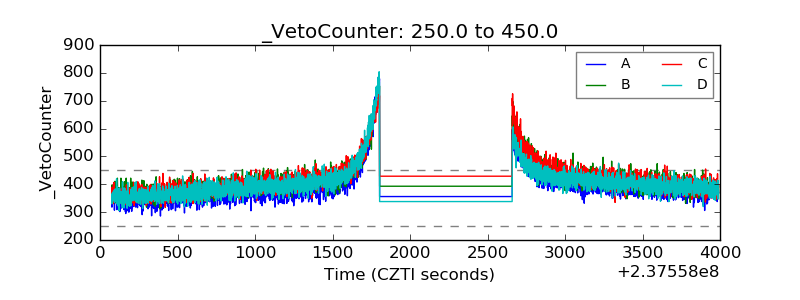 |