| Param | Original file | Final file |
|---|---|---|
| Filename | modeM0/AS1A02_198T01_9000001376_09674cztM0_level2.evt | modeM0/AS1A02_198T01_9000001376_09674cztM0_level2_quad_clean.evt |
| Size (bytes) | 518,166,720 | 101,802,240 |
| Size | 494.2 MB | 97.1 MB |
| Events in quadrant A | 3,574,341 | 655,543 |
| Events in quadrant B | 3,515,985 | 653,638 |
| Events in quadrant C | 3,152,807 | 651,892 |
| Events in quadrant D | 4,957,382 | 617,328 |
| Mode M9 | |||
|---|---|---|---|
| Quadrant | BADHDUFLAG | Total packets | Discarded packets |
| A | 0 | 3 | 0 |
| B | 0 | 3 | 0 |
| C | 0 | 3 | 0 |
| D | 0 | 3 | 0 |
| Mode SS | |||
|---|---|---|---|
| Quadrant | BADHDUFLAG | Total packets | Discarded packets |
| A | 0 | 148 | 2 |
| B | 0 | 148 | 0 |
| C | 0 | 148 | 0 |
| D | 0 | 148 | 0 |
| Mode M0 | |||
|---|---|---|---|
| Quadrant | BADHDUFLAG | Total packets | Discarded packets |
| A | 0 | 15533 | 119 |
| B | 0 | 15403 | 124 |
| C | 0 | 14834 | 104 |
| D | 0 | 20003 | 228 |
| Quadrant | Total seconds | Saturated seconds | Saturation percentage |
|---|---|---|---|
| A | 7252 | 58 | 0.799779% |
| B | 7250 | 54 | 0.744828% |
| C | 7255 | 12 | 0.165403% |
| D | 7231 | 281 | 3.886046% |
Noise dominated data is calculated using 1-second bins in cleaned event files. If a bin has >2000 counts, and if more than 50% of those come from <1% of pixels, then it is considered to be noise-dominated and hence unusable.
| Quadrant | # 1 sec bins | Bins with >0 counts | Bins with >2000 counts | High rate bins dominated by noise | Noise dominated (total time) | Noise dominated (detector-on time) | Marked lightcurve |
|---|---|---|---|---|---|---|---|
| A | 7651 | 7303 | 1 | 1 | 0.01% | 0.01% | 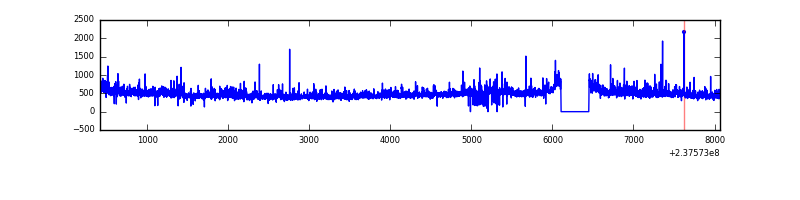 |
| B | 7651 | 7305 | 0 | 0 | 0.00% | 0.00% | 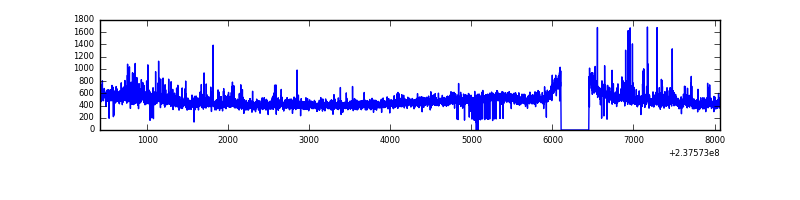 |
| C | 7651 | 7305 | 0 | 0 | 0.00% | 0.00% | 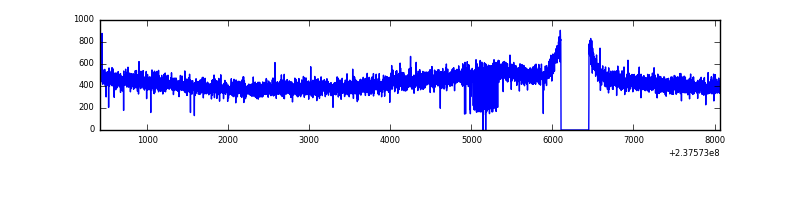 |
| D | 7651 | 7302 | 229 | 229 | 2.99% | 3.14% | 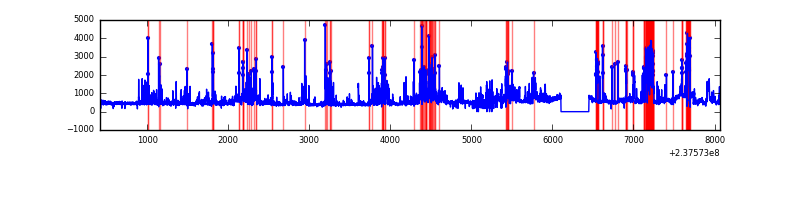 |
Top three noisy pixels from each quadrant. If the there are fewer than three noisy pixels in the level2.evt file, extra rows are filled as -1
| Pixel properties | Quadrant properties | ||||||
|---|---|---|---|---|---|---|---|
| Quadrant | DetID | PixID | Counts | Sigma | Mean | Median | Sigma |
| A | 1 | 162 | 124789 | 721.33 | 842 | 823 | 171.9 |
| A | 8 | 15 | 69459 | 399.38 | 842 | 823 | 171.9 |
| A | 1 | 178 | 45162 | 258.0 | 842 | 823 | 171.9 |
| B | 4 | 173 | 70669 | 432.45 | 841 | 821 | 161.5 |
| B | 0 | 219 | 55204 | 336.7 | 841 | 821 | 161.5 |
| B | 0 | 214 | 54102 | 329.88 | 841 | 821 | 161.5 |
| C | 13 | 61 | 6021 | 27.91 | 807 | 810 | 186.7 |
| C | 12 | 4 | 3227 | 12.95 | 807 | 810 | 186.7 |
| C | 8 | 222 | 2146 | 7.16 | 807 | 810 | 186.7 |
| D | 12 | 233 | 896940 | 4344.16 | 792 | 769 | 206.3 |
| D | 1 | 52 | 582483 | 2819.84 | 792 | 769 | 206.3 |
| D | 8 | 195 | 272159 | 1315.56 | 792 | 769 | 206.3 |
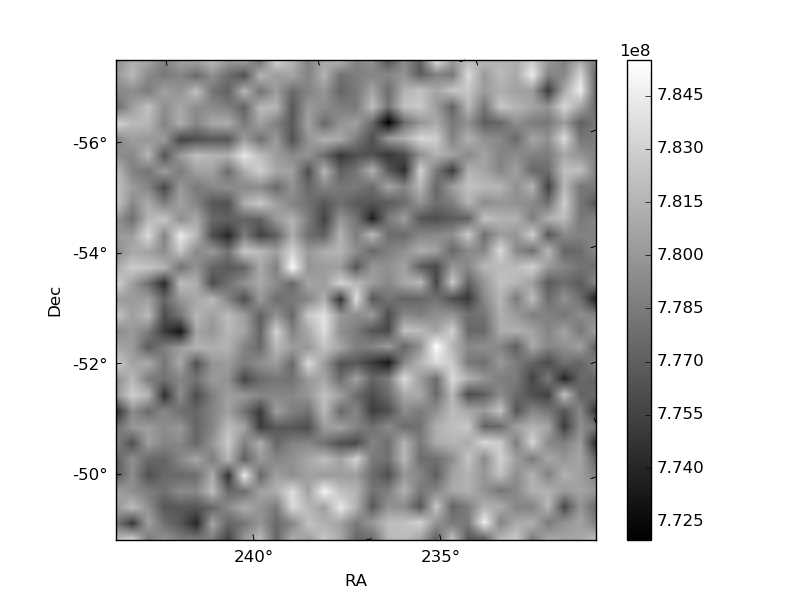
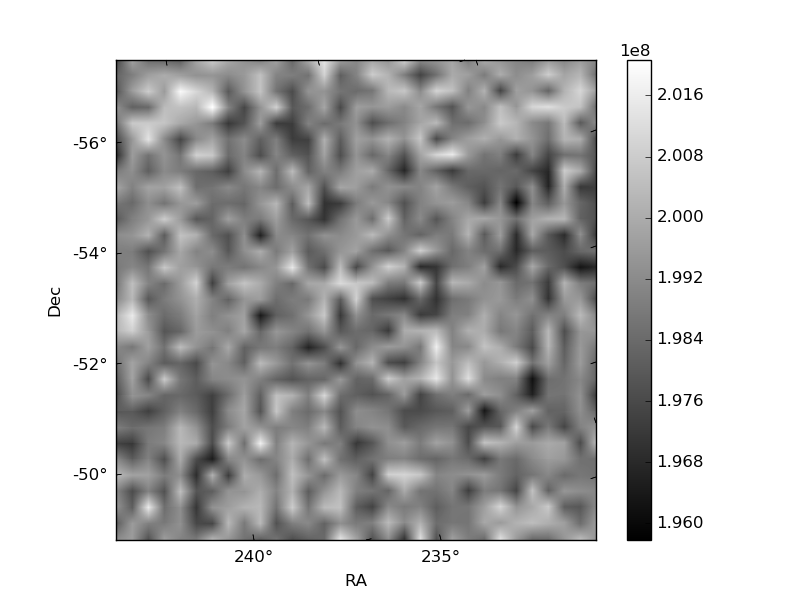
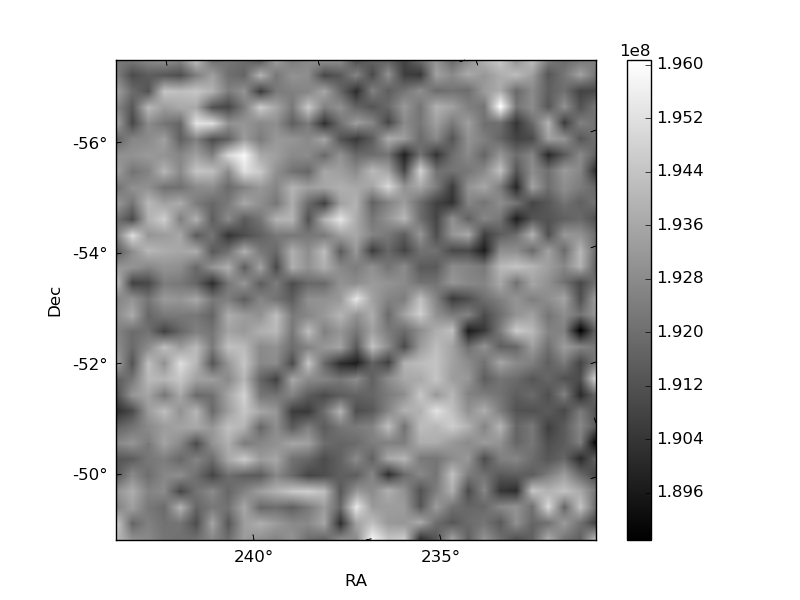
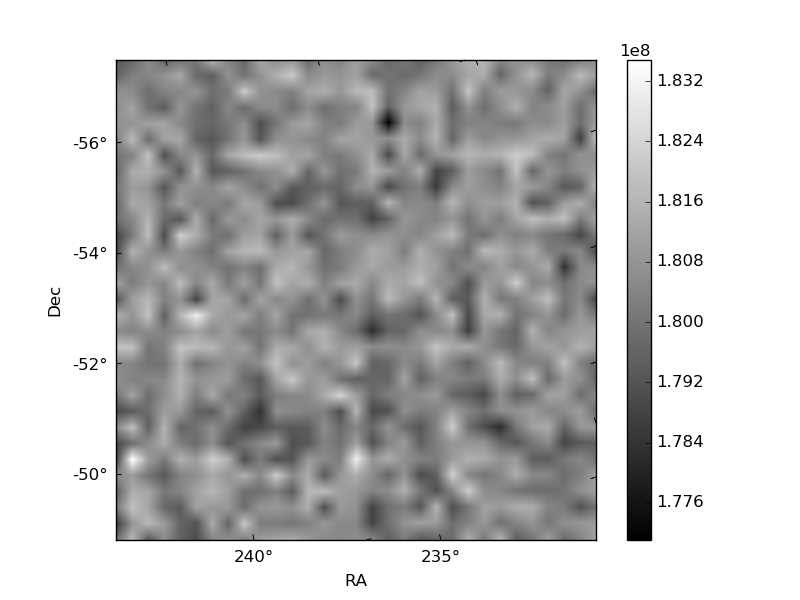
Histogram calculated using DETX and DETY for each event in the final _common_clean file
| Quadrant A | 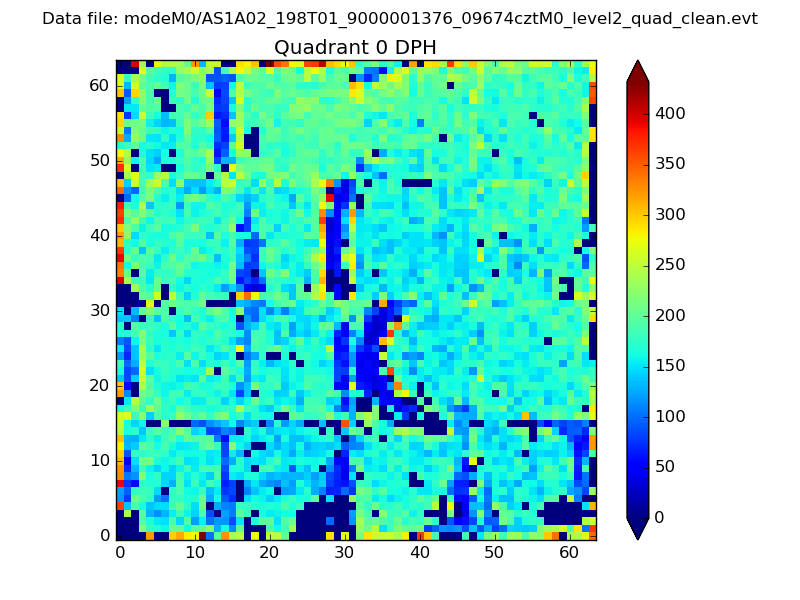 |
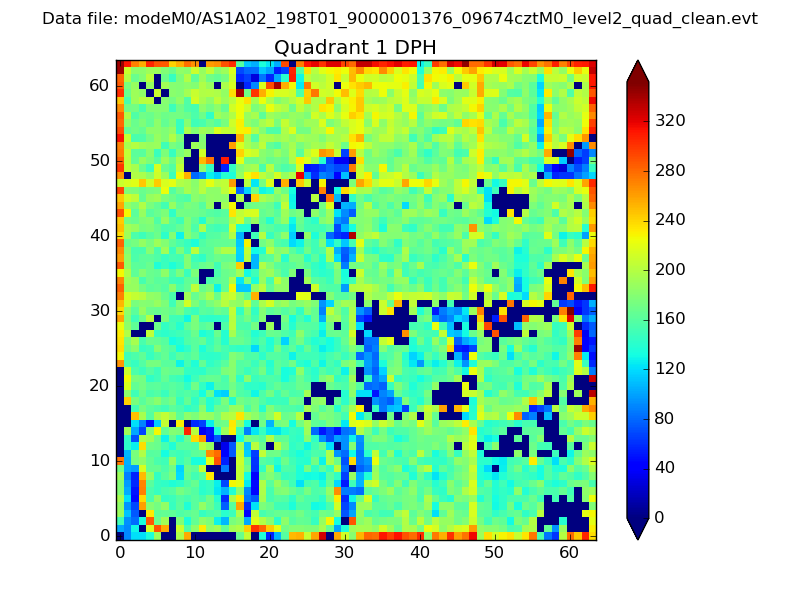 |
Quadrant B |
|---|---|---|---|
| Quadrant D | 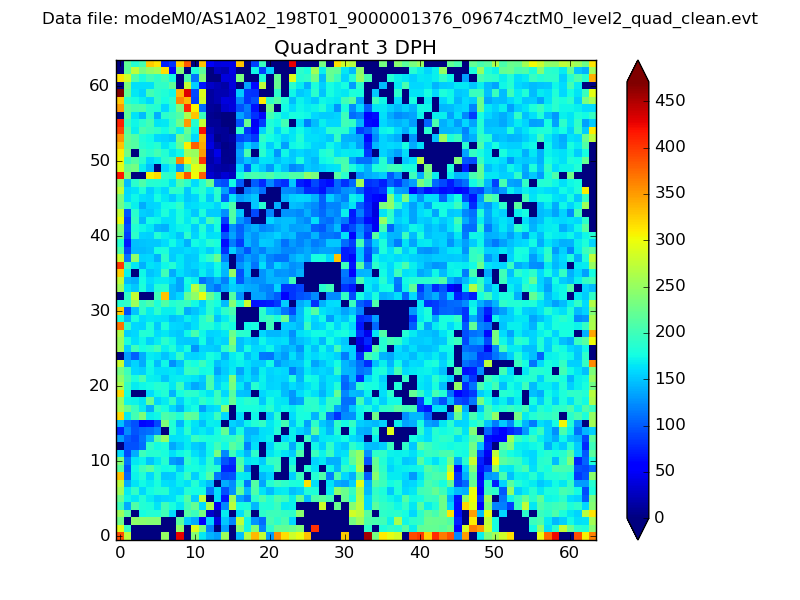 |
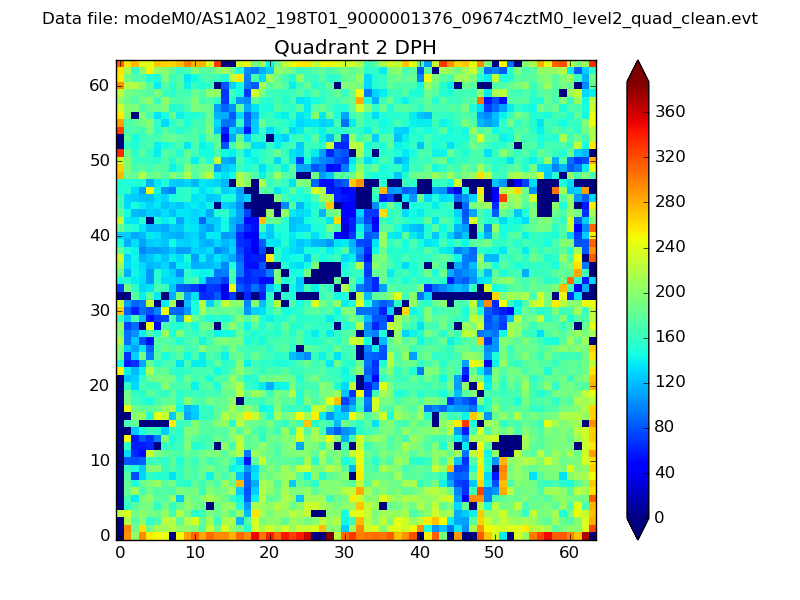 |
Quadrant C |
| Plot type | Count rate plots | Images |
|---|---|---|
| Comparison with Poisson distribution Blue bars denote a histogram of data divided into 1 sec bins. Red curve is a Poisson curve with rate = median count rate of data. |
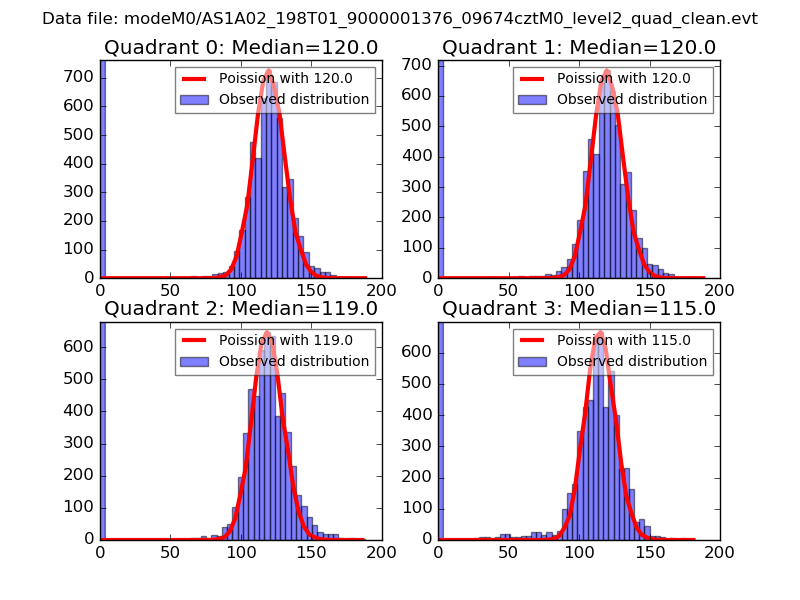 |
 |
| Quadrant-wise count rates Data is divided into 100 sec bins |
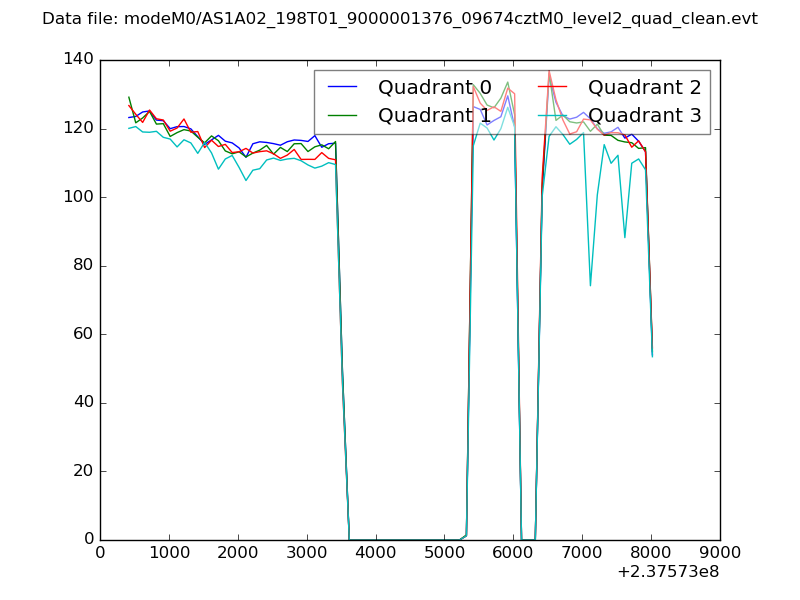 |
|
| Module-wise count rates for Quadrant A Data is divided into 100 sec bins |
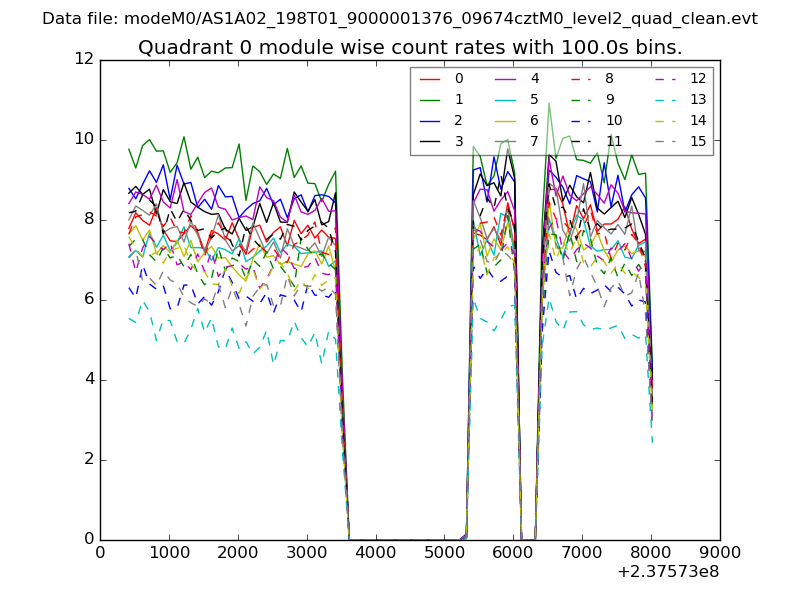 |
 |
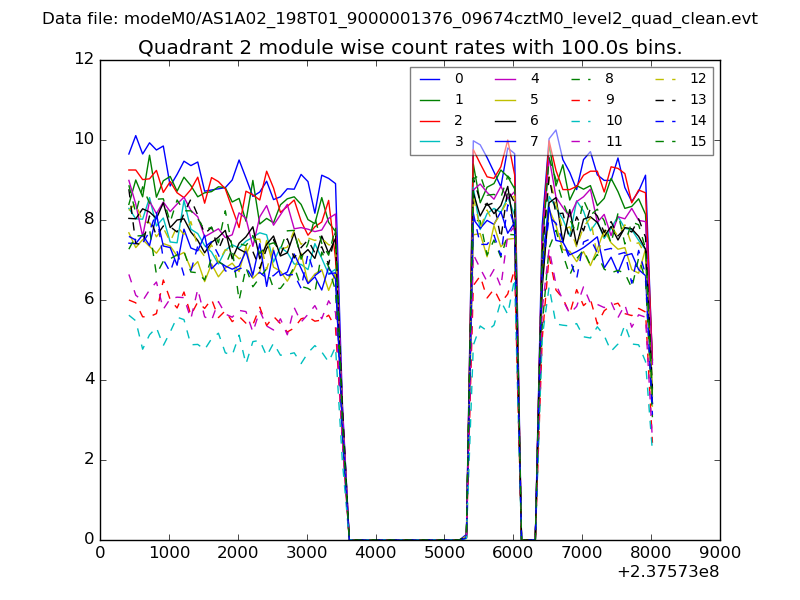
| Module-wise count rates for Quadrant B Data is divided into 100 sec bins |
 |
 |
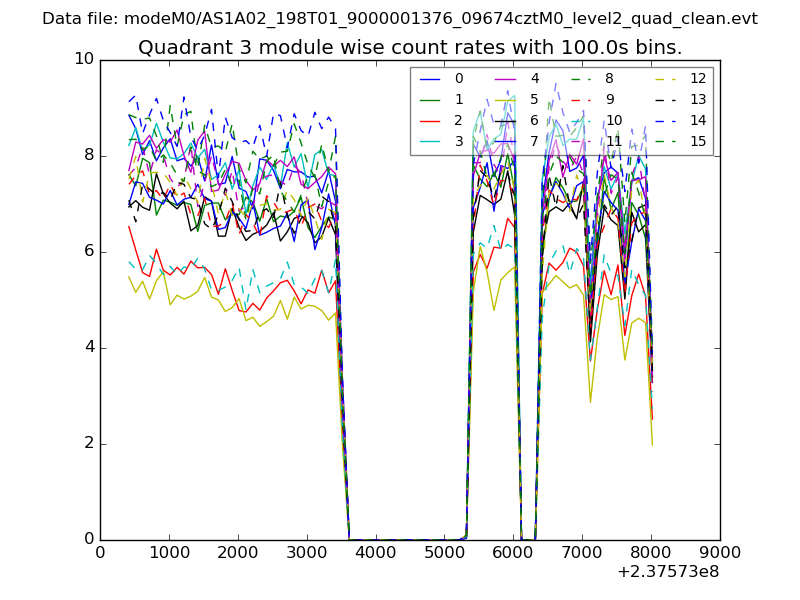
| Module-wise count rates for Quadrant C Data is divided into 100 sec bins |
 |
 |
| Module-wise count rates for Quadrant D Data is divided into 100 sec bins |
 |
 |
| Parameter | Plot |
|---|---|
| CZT HV Monitor |  |
| D_VDD | 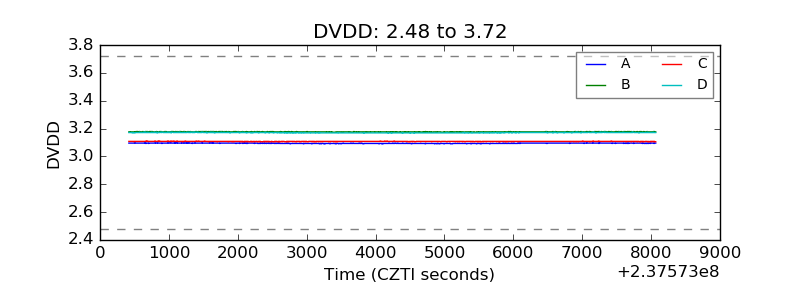 |
| Temperature 1 | 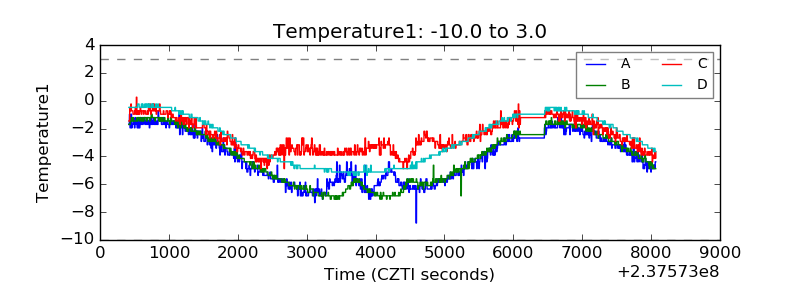 |
| Veto HV Monitor | 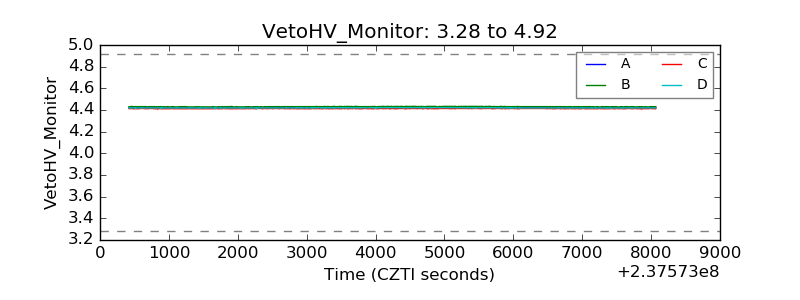 |
| Veto LLD | 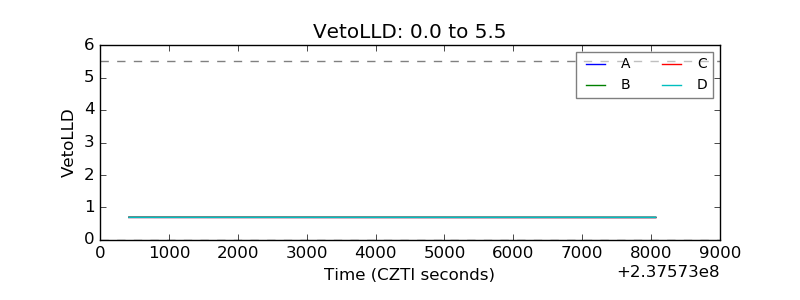 |
| Alpha Counter | 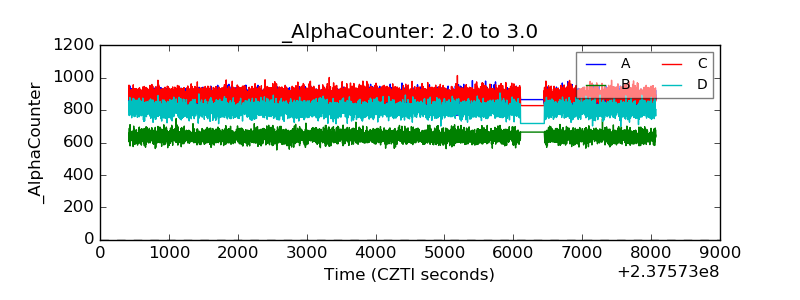 |
| _CPM_Rate | 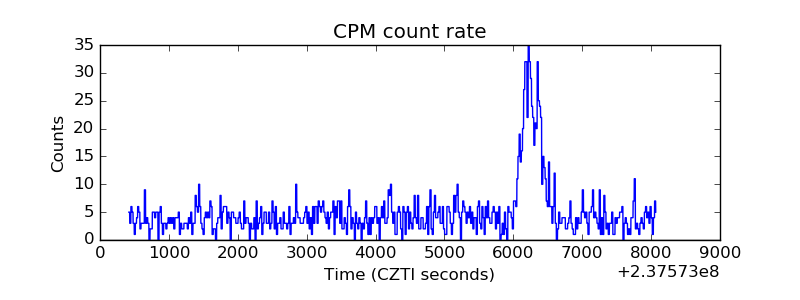 |
| CZT Counter | 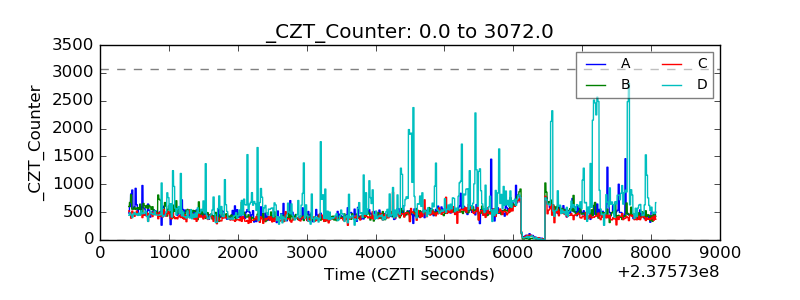 |
| +2.5 Volts monitor |  |
| +5 Volts monitor | 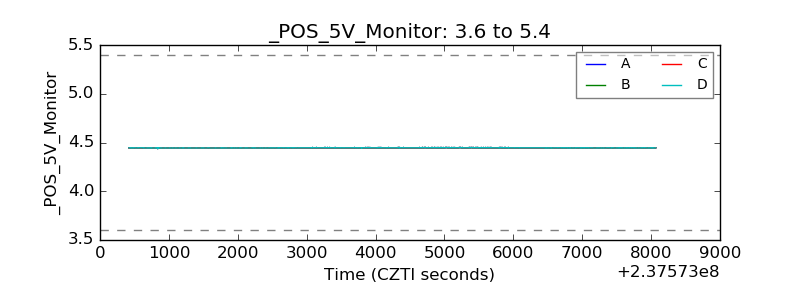 |
| _ROLL_ROT |  |
| _Roll_DEC | 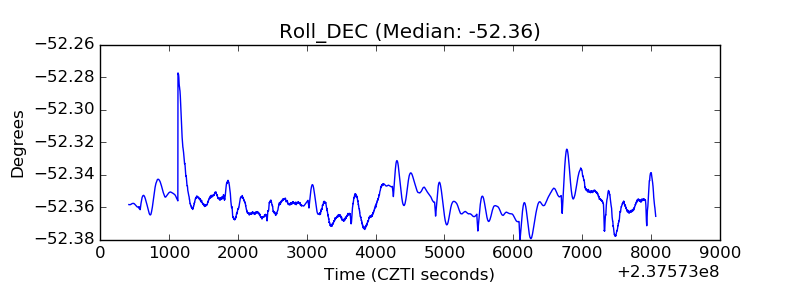 |
| _Roll_RA | 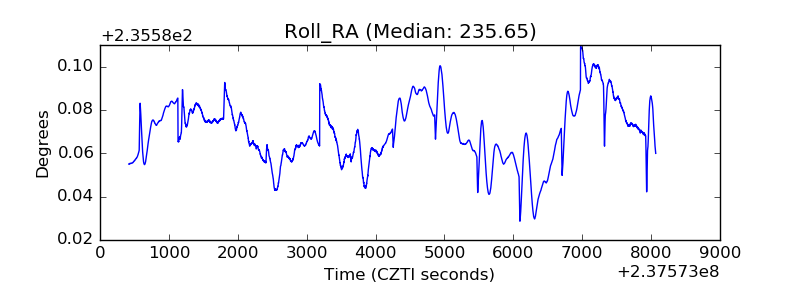 |
| Veto Counter | 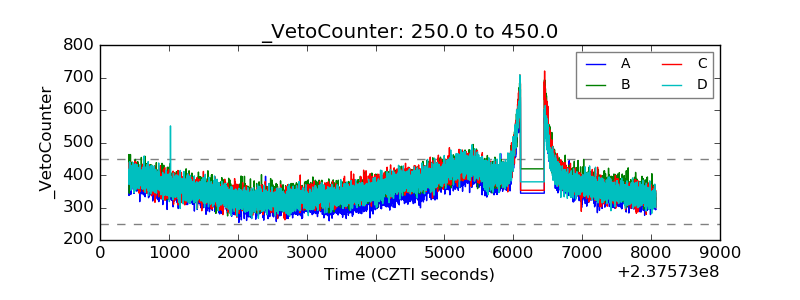 |