| Param | Original file | Final file |
|---|---|---|
| Filename | modeM0/AS1A02_198T01_9000001376_09677cztM0_level2.evt | modeM0/AS1A02_198T01_9000001376_09677cztM0_level2_quad_clean.evt |
| Size (bytes) | 1,277,559,360 | 237,752,640 |
| Size | 1.2 GB | 226.7 MB |
| Events in quadrant A | 9,173,402 | 1,513,159 |
| Events in quadrant B | 8,542,042 | 1,515,886 |
| Events in quadrant C | 7,838,240 | 1,503,806 |
| Events in quadrant D | 11,916,951 | 1,423,767 |
| Mode M9 | |||
|---|---|---|---|
| Quadrant | BADHDUFLAG | Total packets | Discarded packets |
| A | 0 | 21 | 0 |
| B | 0 | 21 | 0 |
| C | 0 | 21 | 0 |
| D | 0 | 21 | 0 |
| Mode SS | |||
|---|---|---|---|
| Quadrant | BADHDUFLAG | Total packets | Discarded packets |
| A | 0 | 368 | 0 |
| B | 0 | 368 | 0 |
| C | 0 | 368 | 0 |
| D | 0 | 368 | 0 |
| Mode M0 | |||
|---|---|---|---|
| Quadrant | BADHDUFLAG | Total packets | Discarded packets |
| A | 0 | 38964 | 4 |
| B | 0 | 37749 | 5 |
| C | 0 | 36337 | 3 |
| D | 0 | 48059 | 3 |
| Quadrant | Total seconds | Saturated seconds | Saturation percentage |
|---|---|---|---|
| A | 18047 | 84 | 0.465451% |
| B | 18046 | 60 | 0.332484% |
| C | 18047 | 11 | 0.060952% |
| D | 18047 | 1025 | 5.679614% |
Noise dominated data is calculated using 1-second bins in cleaned event files. If a bin has >2000 counts, and if more than 50% of those come from <1% of pixels, then it is considered to be noise-dominated and hence unusable.
| Quadrant | # 1 sec bins | Bins with >0 counts | Bins with >2000 counts | High rate bins dominated by noise | Noise dominated (total time) | Noise dominated (detector-on time) | Marked lightcurve |
|---|---|---|---|---|---|---|---|
| A | 20167 | 18050 | 37 | 37 | 0.18% | 0.20% | 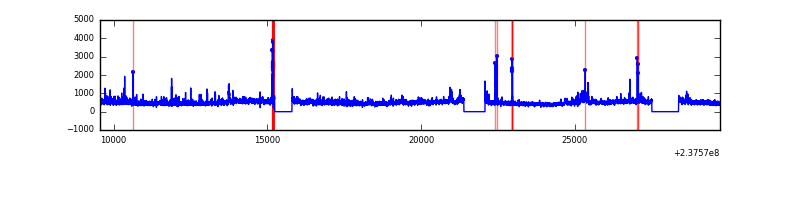 |
| B | 20167 | 18050 | 7 | 7 | 0.03% | 0.04% | 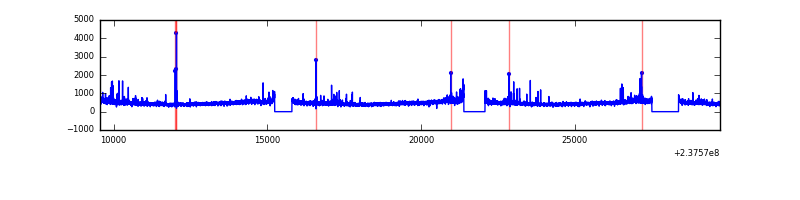 |
| C | 20167 | 18050 | 0 | 0 | 0.00% | 0.00% | 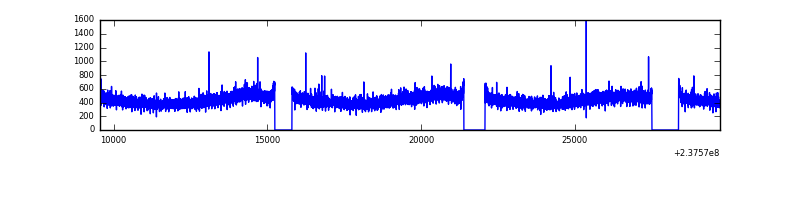 |
| D | 20167 | 18050 | 1159 | 1159 | 5.75% | 6.42% | 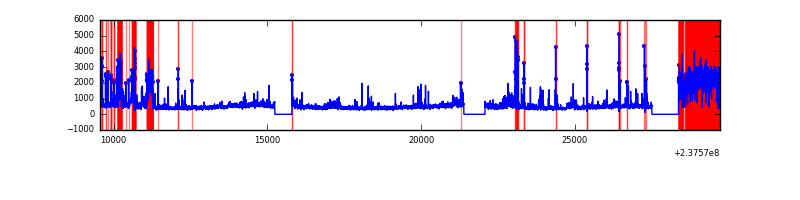 |
Top three noisy pixels from each quadrant. If the there are fewer than three noisy pixels in the level2.evt file, extra rows are filled as -1
| Pixel properties | Quadrant properties | ||||||
|---|---|---|---|---|---|---|---|
| Quadrant | DetID | PixID | Counts | Sigma | Mean | Median | Sigma |
| A | 8 | 15 | 646817 | 1541.82 | 2065 | 2025 | 418.2 |
| A | 1 | 162 | 204910 | 485.14 | 2065 | 2025 | 418.2 |
| A | 15 | 174 | 133446 | 314.25 | 2065 | 2025 | 418.2 |
| B | 0 | 214 | 184638 | 464.63 | 2071 | 2024 | 393.0 |
| B | 10 | 245 | 83275 | 206.73 | 2071 | 2024 | 393.0 |
| B | 0 | 219 | 75010 | 185.7 | 2071 | 2024 | 393.0 |
| C | 8 | 128 | 16662 | 31.6 | 1999 | 2010 | 463.7 |
| C | 13 | 61 | 15059 | 28.14 | 1999 | 2010 | 463.7 |
| C | 8 | 112 | 9764 | 16.72 | 1999 | 2010 | 463.7 |
| D | 1 | 52 | 2956803 | 6047.06 | 1961 | 1907 | 488.7 |
| D | 8 | 195 | 539743 | 1100.66 | 1961 | 1907 | 488.7 |
| D | 7 | 71 | 424220 | 864.24 | 1961 | 1907 | 488.7 |
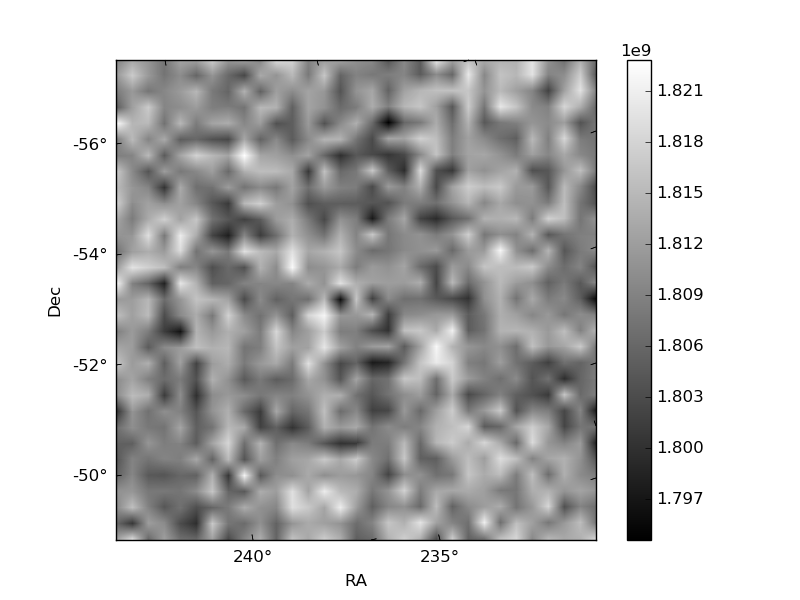
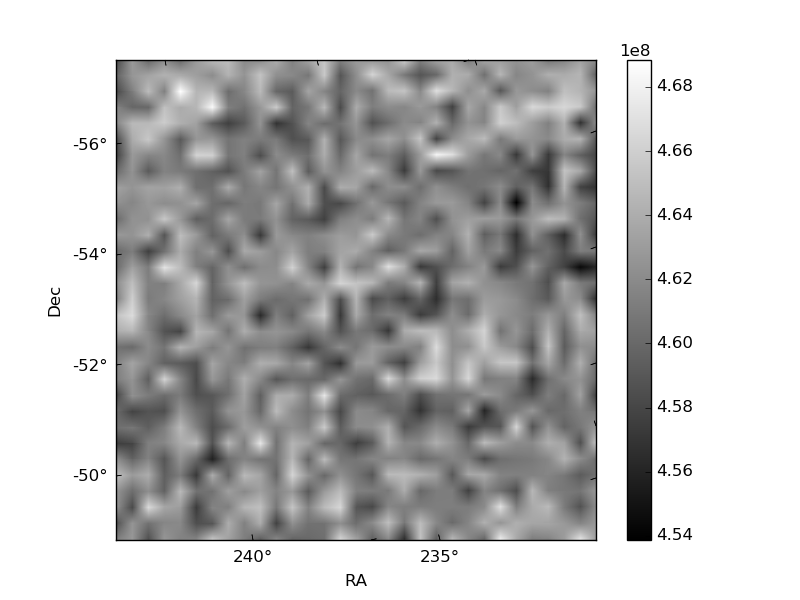
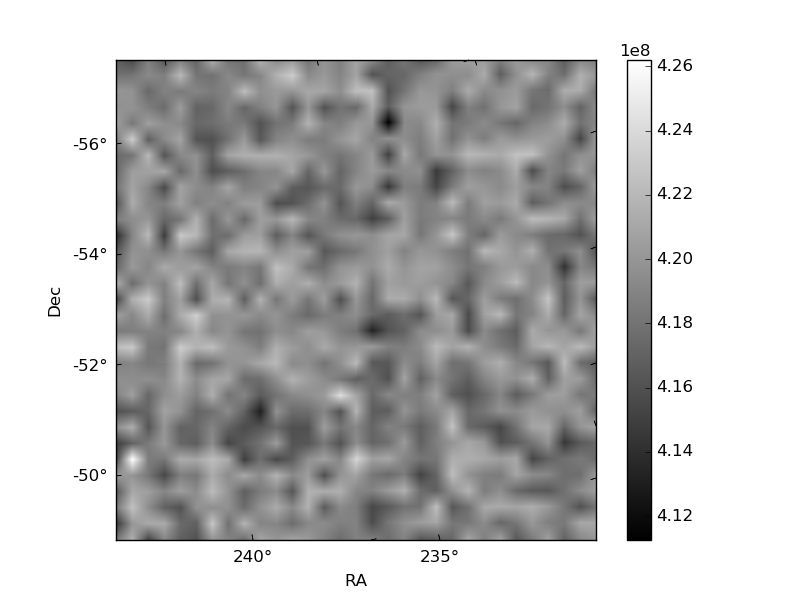
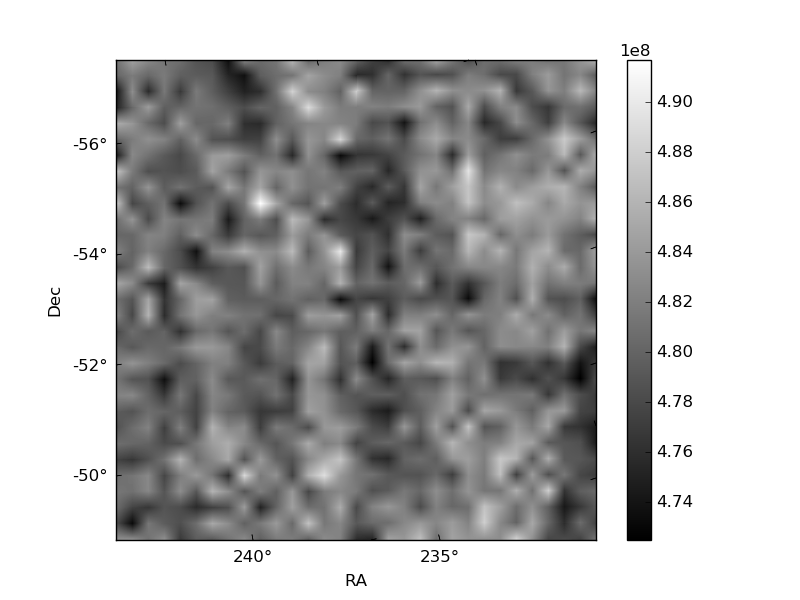
Histogram calculated using DETX and DETY for each event in the final _common_clean file
| Quadrant A | 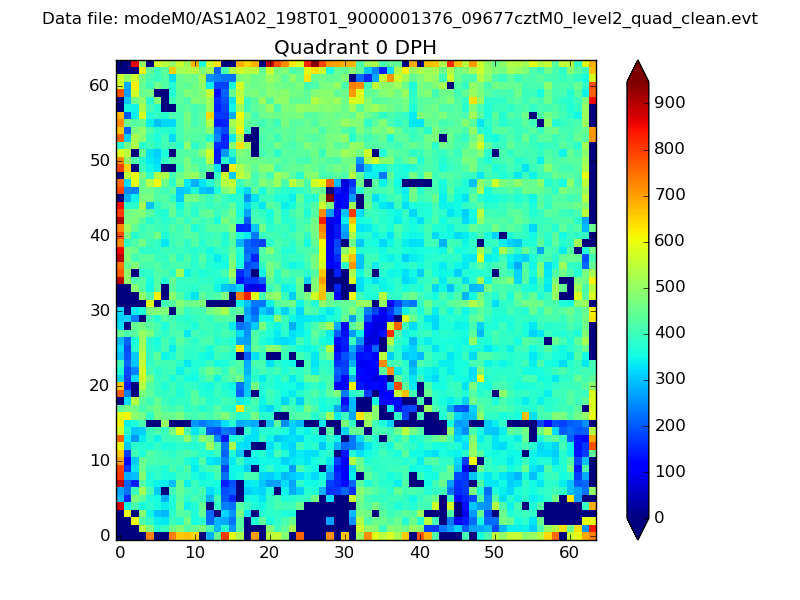 |
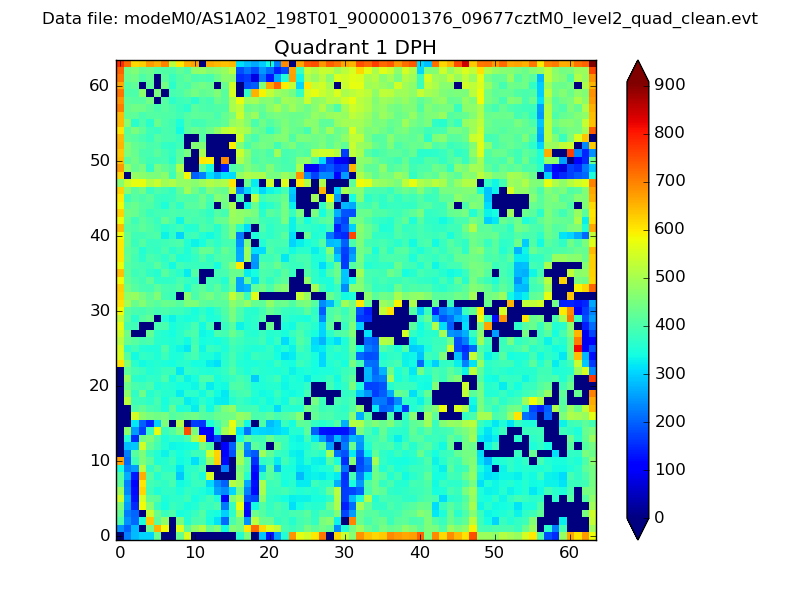 |
Quadrant B |
|---|---|---|---|
| Quadrant D | 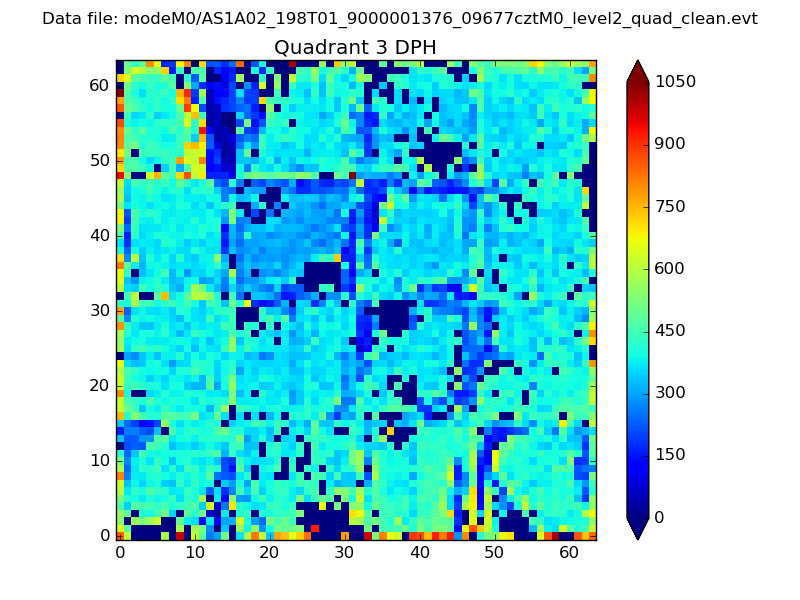 |
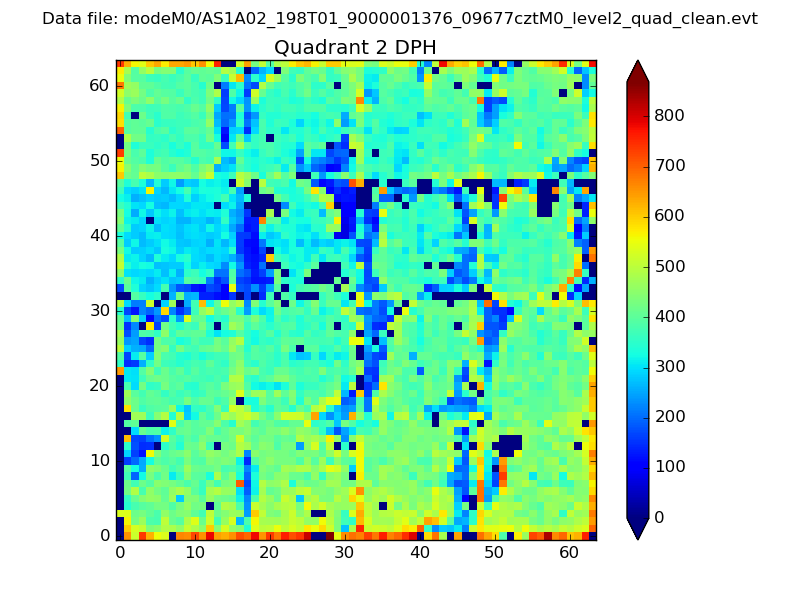 |
Quadrant C |
| Plot type | Count rate plots | Images |
|---|---|---|
| Comparison with Poisson distribution Blue bars denote a histogram of data divided into 1 sec bins. Red curve is a Poisson curve with rate = median count rate of data. |
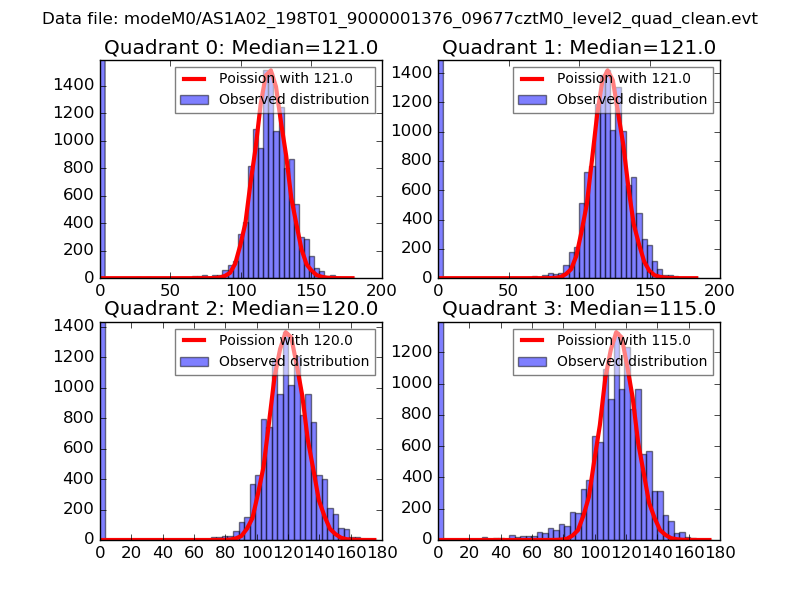 |
 |
| Quadrant-wise count rates Data is divided into 100 sec bins |
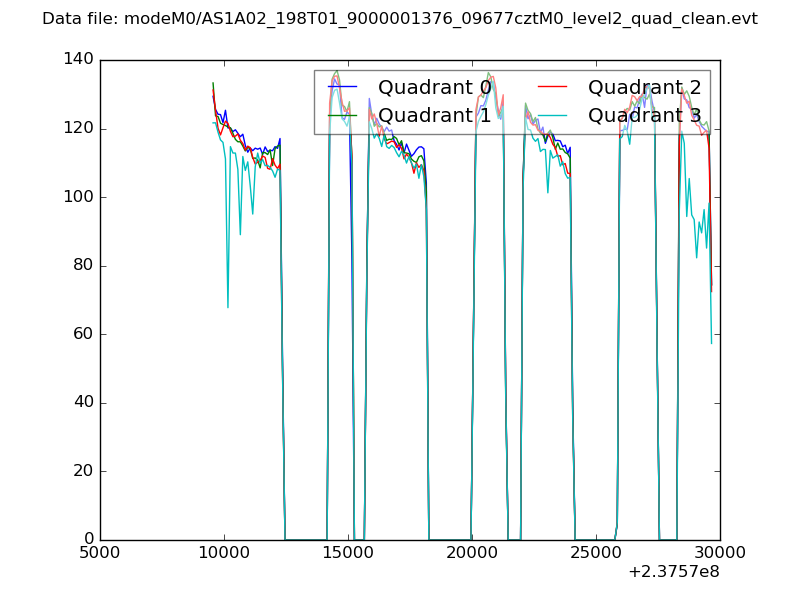 |
|
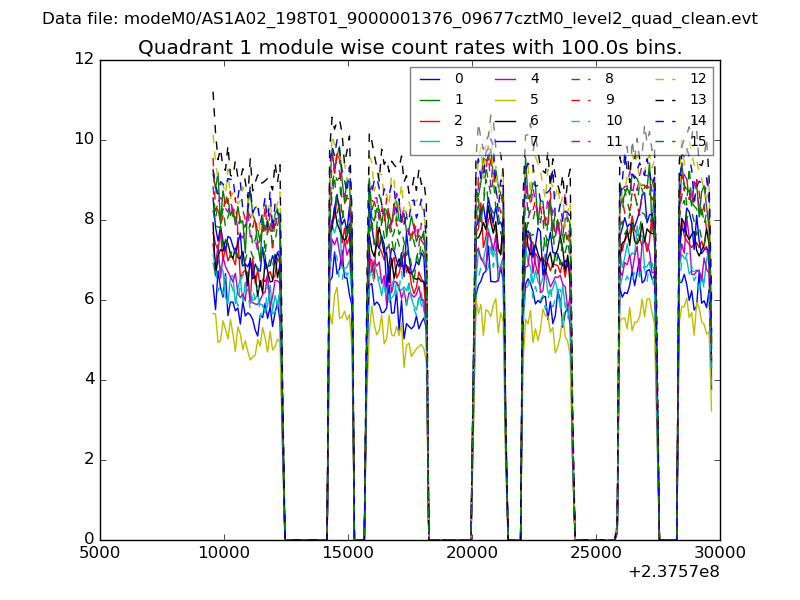
| Module-wise count rates for Quadrant A Data is divided into 100 sec bins |
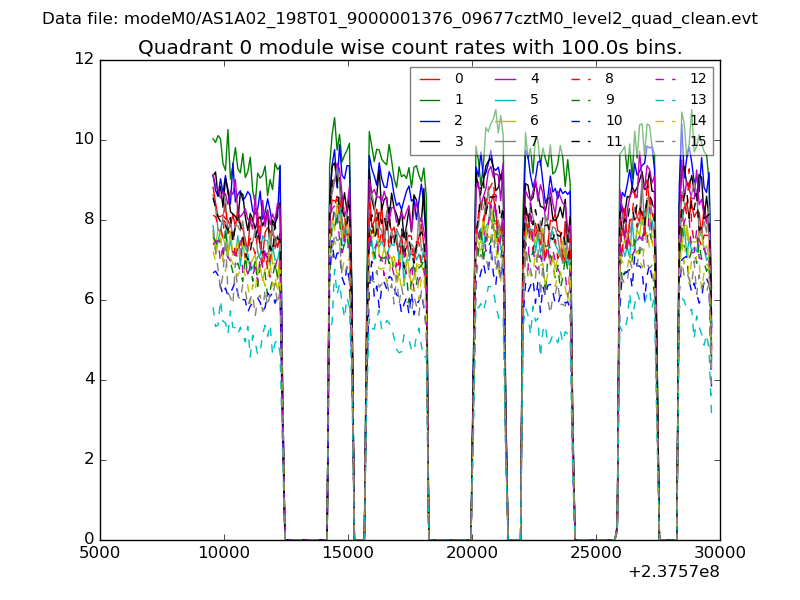 |
 |
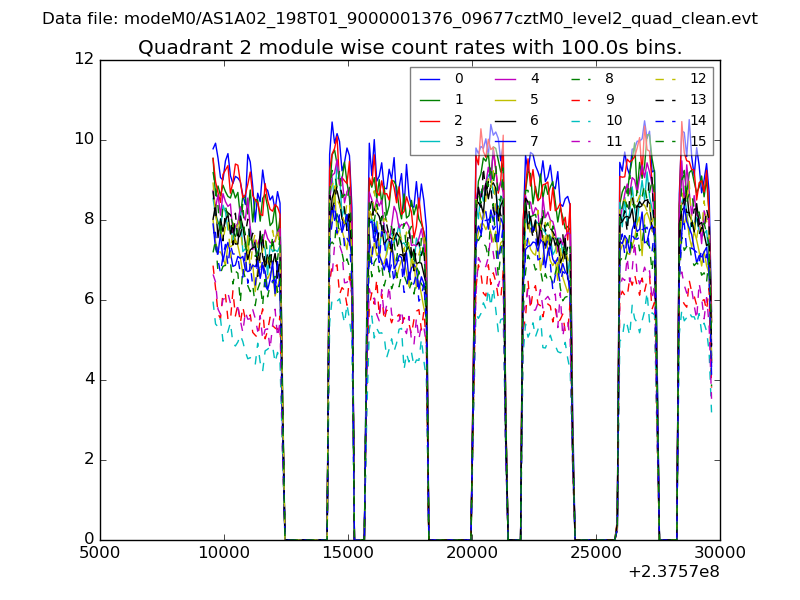
| Module-wise count rates for Quadrant B Data is divided into 100 sec bins |
 |
 |
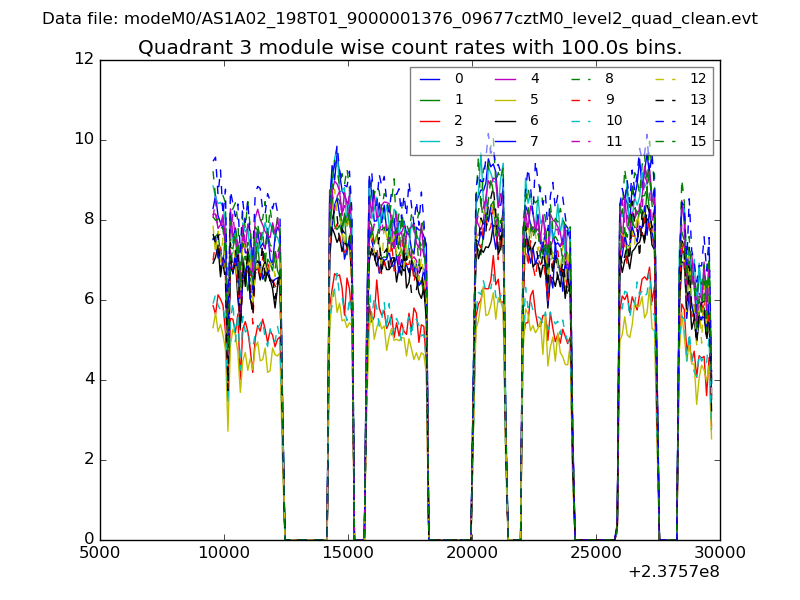
| Module-wise count rates for Quadrant C Data is divided into 100 sec bins |
 |
 |
| Module-wise count rates for Quadrant D Data is divided into 100 sec bins |
 |
 |
| Parameter | Plot |
|---|---|
| CZT HV Monitor | 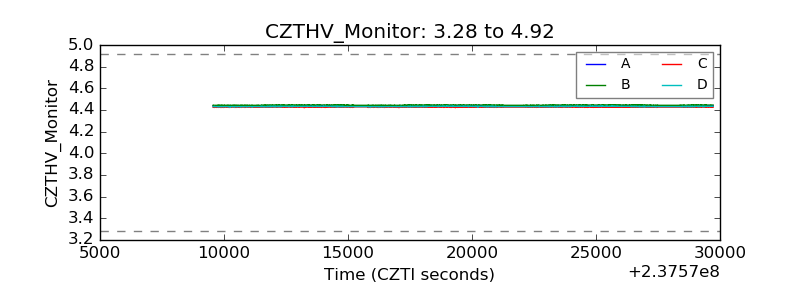 |
| D_VDD | 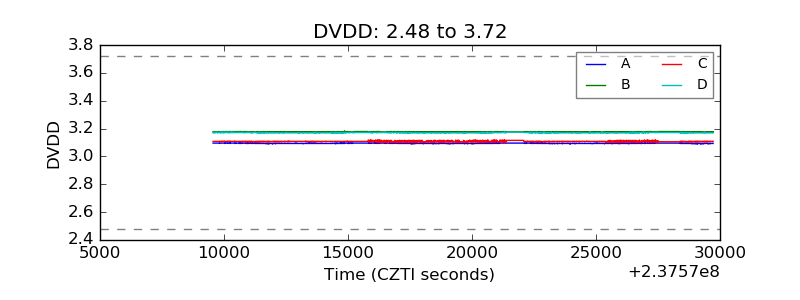 |
| Temperature 1 |  |
| Veto HV Monitor | 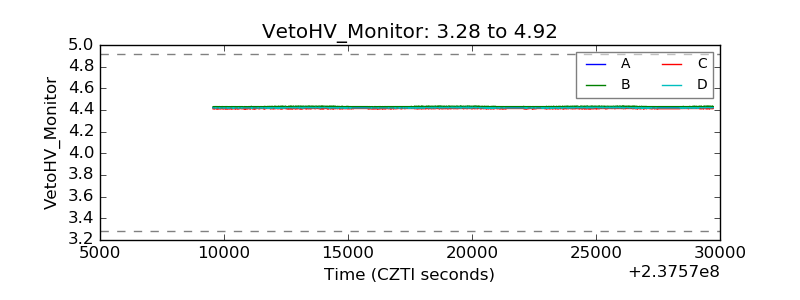 |
| Veto LLD | 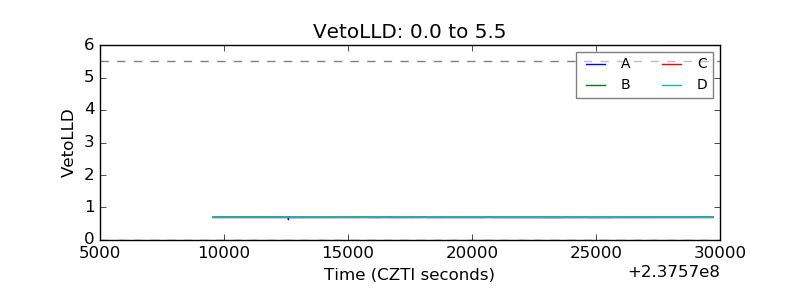 |
| Alpha Counter | 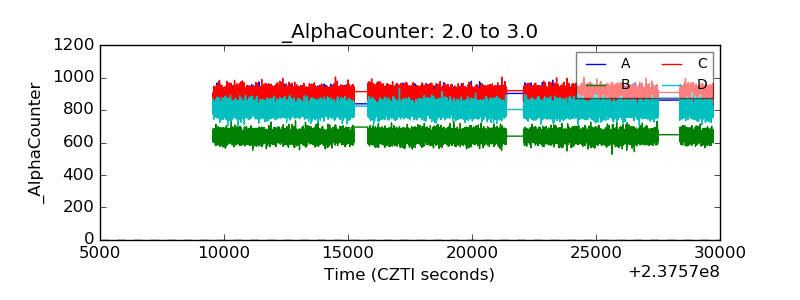 |
| _CPM_Rate | 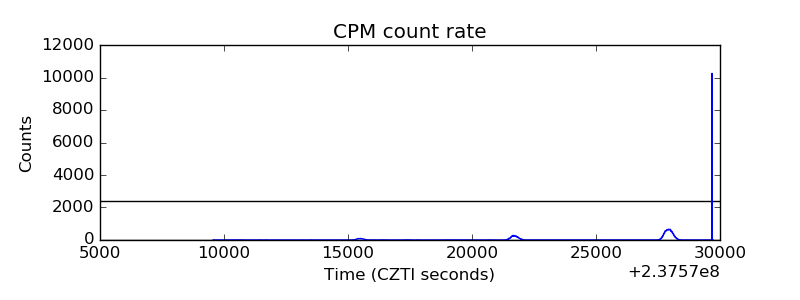 |
| CZT Counter | 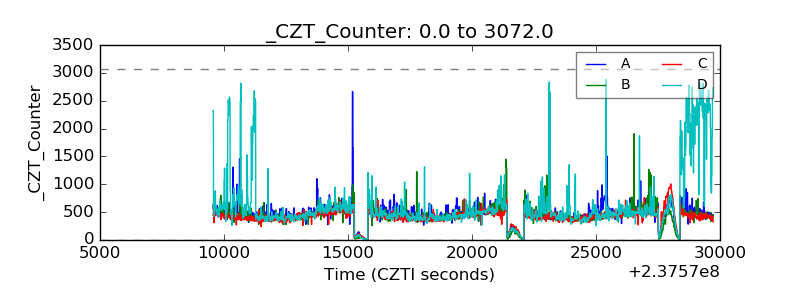 |
| +2.5 Volts monitor |  |
| +5 Volts monitor |  |
| _ROLL_ROT | 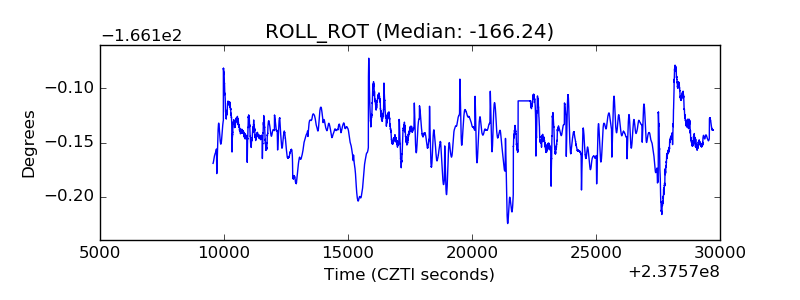 |
| _Roll_DEC |  |
| _Roll_RA | 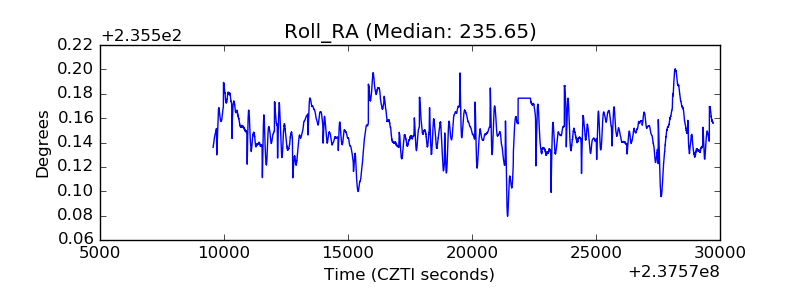 |
| Veto Counter | 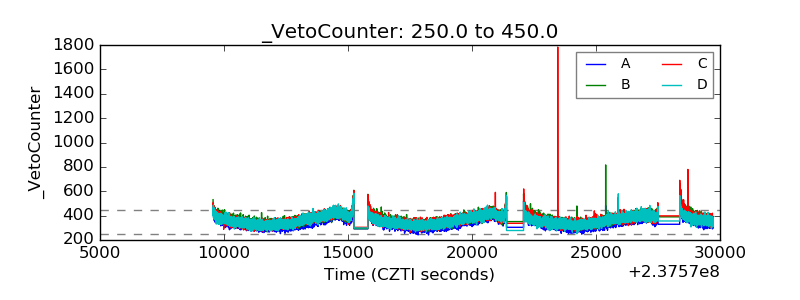 |