| Param | Original file | Final file |
|---|---|---|
| Filename | modeM0/AS1A02_198T01_9000001376_09678cztM0_level2.evt | modeM0/AS1A02_198T01_9000001376_09678cztM0_level2_quad_clean.evt |
| Size (bytes) | 609,099,840 | 93,905,280 |
| Size | 580.9 MB | 89.6 MB |
| Events in quadrant A | 3,510,503 | 603,716 |
| Events in quadrant B | 3,373,408 | 607,944 |
| Events in quadrant C | 3,202,975 | 600,946 |
| Events in quadrant D | 7,881,979 | 539,611 |
| Mode M9 | |||
|---|---|---|---|
| Quadrant | BADHDUFLAG | Total packets | Discarded packets |
| A | 0 | 18 | 0 |
| B | 0 | 18 | 0 |
| C | 0 | 18 | 0 |
| D | 0 | 18 | 0 |
| Mode SS | |||
|---|---|---|---|
| Quadrant | BADHDUFLAG | Total packets | Discarded packets |
| A | 0 | 148 | 0 |
| B | 0 | 148 | 0 |
| C | 0 | 148 | 0 |
| D | 0 | 148 | 0 |
| Mode M0 | |||
|---|---|---|---|
| Quadrant | BADHDUFLAG | Total packets | Discarded packets |
| A | 0 | 14885 | 3 |
| B | 0 | 14715 | 2 |
| C | 0 | 14479 | 2 |
| D | 0 | 28420 | 2 |
| Quadrant | Total seconds | Saturated seconds | Saturation percentage |
|---|---|---|---|
| A | 7039 | 12 | 0.170479% |
| B | 7039 | 20 | 0.284131% |
| C | 7039 | 35 | 0.497230% |
| D | 7039 | 1351 | 19.193067% |
Noise dominated data is calculated using 1-second bins in cleaned event files. If a bin has >2000 counts, and if more than 50% of those come from <1% of pixels, then it is considered to be noise-dominated and hence unusable.
| Quadrant | # 1 sec bins | Bins with >0 counts | Bins with >2000 counts | High rate bins dominated by noise | Noise dominated (total time) | Noise dominated (detector-on time) | Marked lightcurve |
|---|---|---|---|---|---|---|---|
| A | 8929 | 7041 | 0 | 0 | 0.00% | 0.00% | 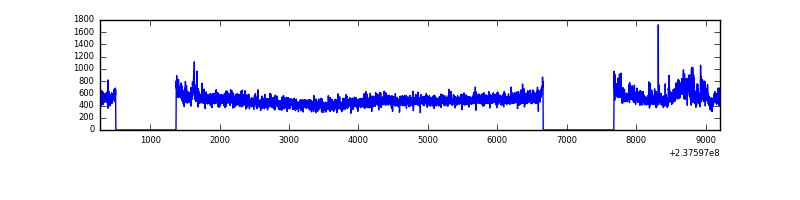 |
| B | 8929 | 7041 | 5 | 5 | 0.06% | 0.07% | 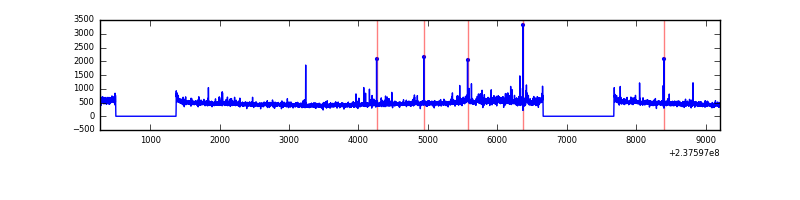 |
| C | 8929 | 7041 | 24 | 24 | 0.27% | 0.34% | 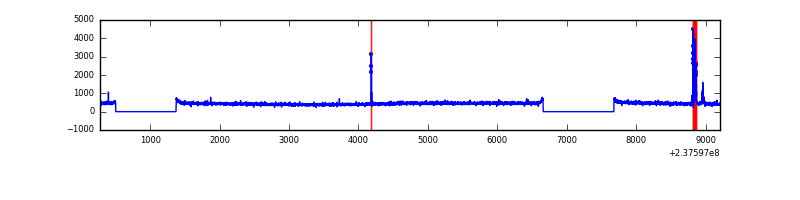 |
| D | 8929 | 7041 | 1461 | 1461 | 16.36% | 20.75% | 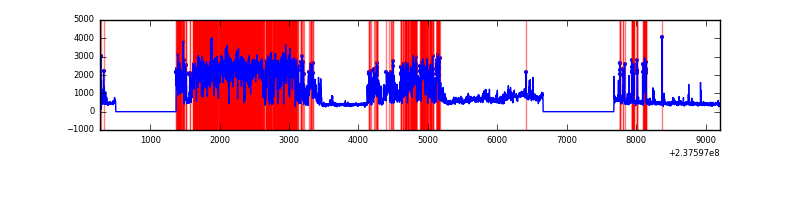 |
Top three noisy pixels from each quadrant. If the there are fewer than three noisy pixels in the level2.evt file, extra rows are filled as -1
| Pixel properties | Quadrant properties | ||||||
|---|---|---|---|---|---|---|---|
| Quadrant | DetID | PixID | Counts | Sigma | Mean | Median | Sigma |
| A | 8 | 15 | 244687 | 1485.09 | 814 | 796 | 164.2 |
| A | 1 | 162 | 74888 | 451.16 | 814 | 796 | 164.2 |
| A | 1 | 178 | 25417 | 149.92 | 814 | 796 | 164.2 |
| B | 0 | 214 | 79211 | 501.27 | 820 | 799 | 156.4 |
| B | 6 | 51 | 21161 | 130.17 | 820 | 799 | 156.4 |
| B | 0 | 219 | 20232 | 124.23 | 820 | 799 | 156.4 |
| C | 14 | 234 | 113184 | 609.86 | 791 | 791 | 184.3 |
| C | 13 | 61 | 5825 | 27.31 | 791 | 791 | 184.3 |
| C | 9 | 68 | 5325 | 24.6 | 791 | 791 | 184.3 |
| D | 1 | 52 | 4469888 | 24477.59 | 752 | 734 | 182.6 |
| D | 8 | 195 | 405376 | 2216.23 | 752 | 734 | 182.6 |
| D | 12 | 233 | 87008 | 472.52 | 752 | 734 | 182.6 |
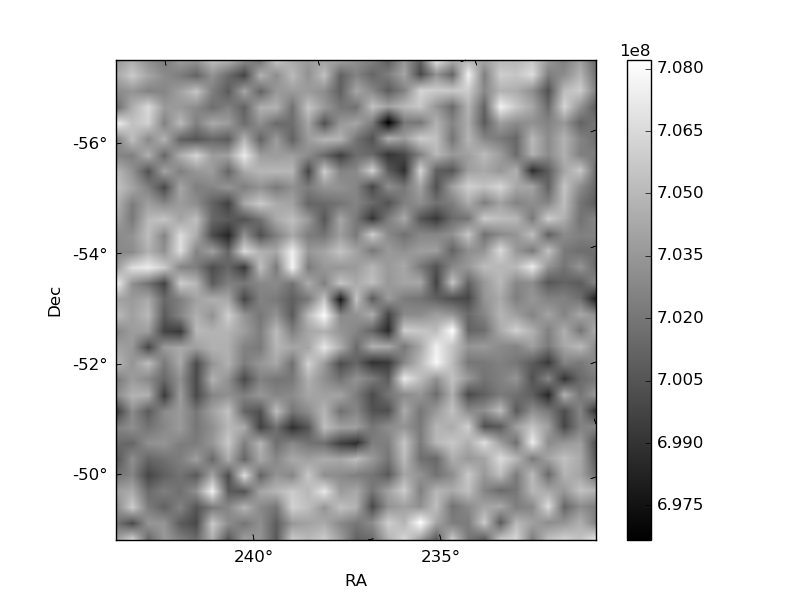
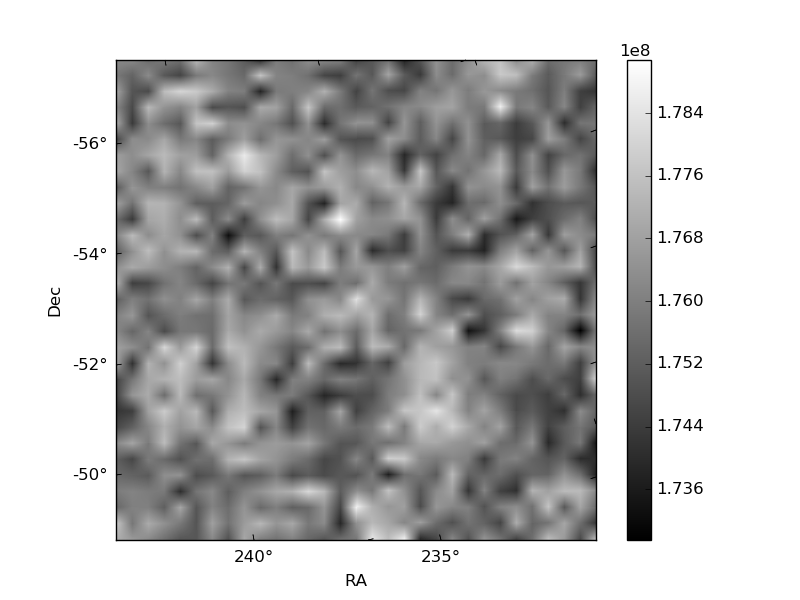
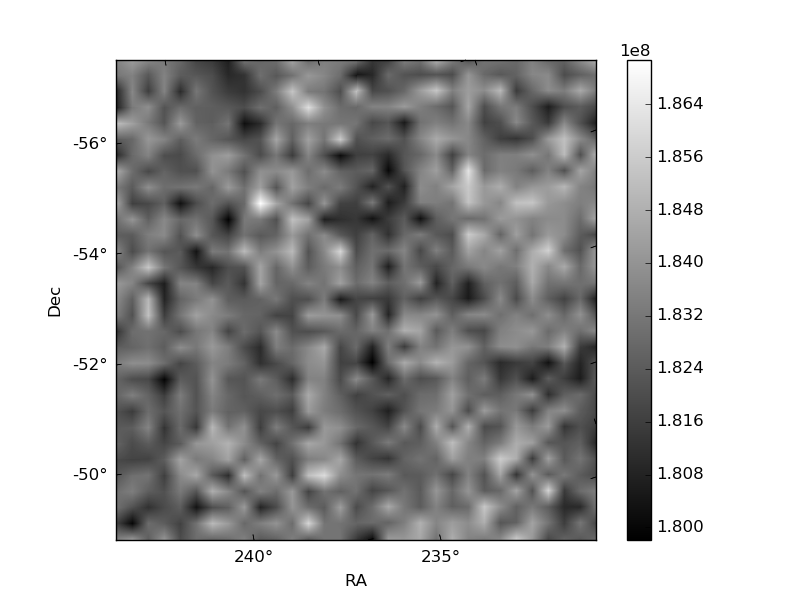
Histogram calculated using DETX and DETY for each event in the final _common_clean file
| Quadrant A | 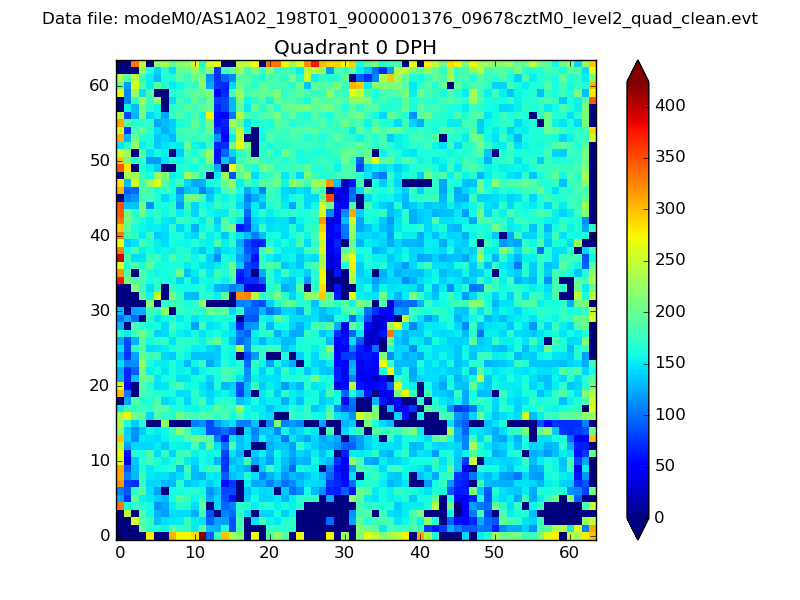 |
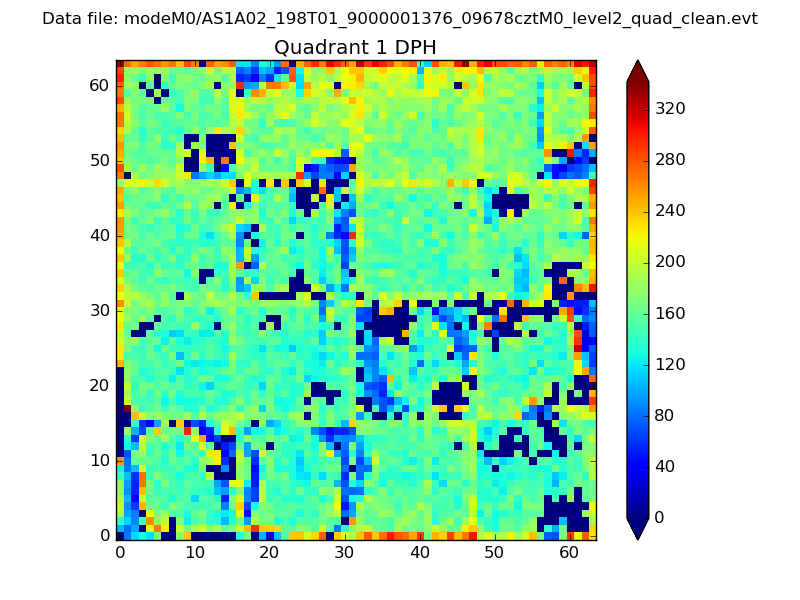 |
Quadrant B |
|---|---|---|---|
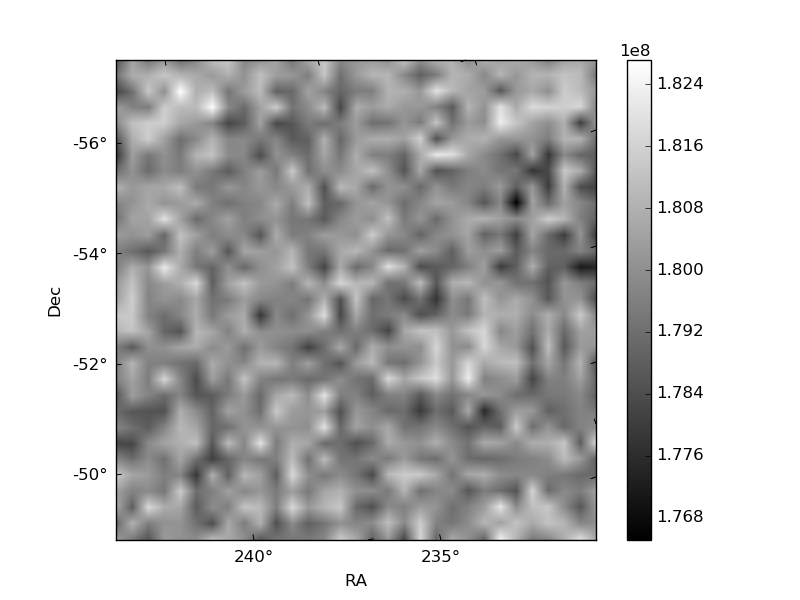
| Quadrant D | 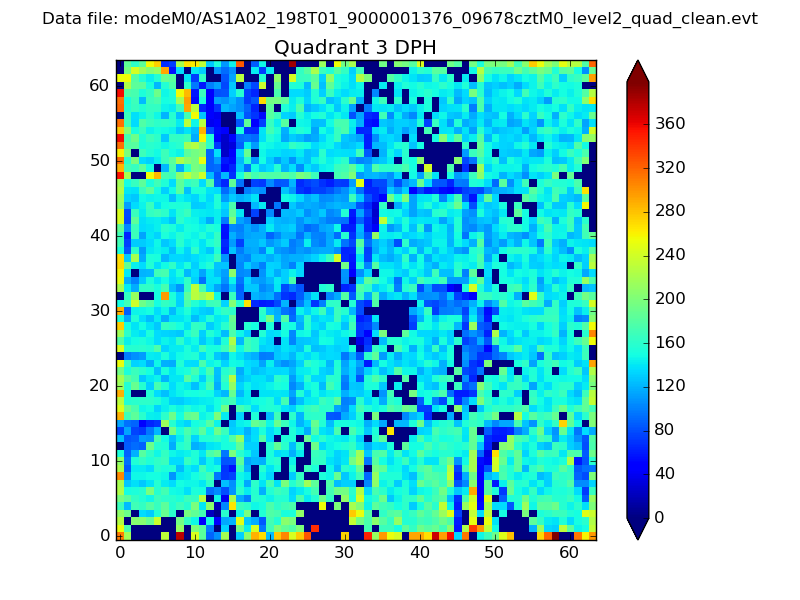 |
 |
Quadrant C |
| Plot type | Count rate plots | Images |
|---|---|---|
| Comparison with Poisson distribution Blue bars denote a histogram of data divided into 1 sec bins. Red curve is a Poisson curve with rate = median count rate of data. |
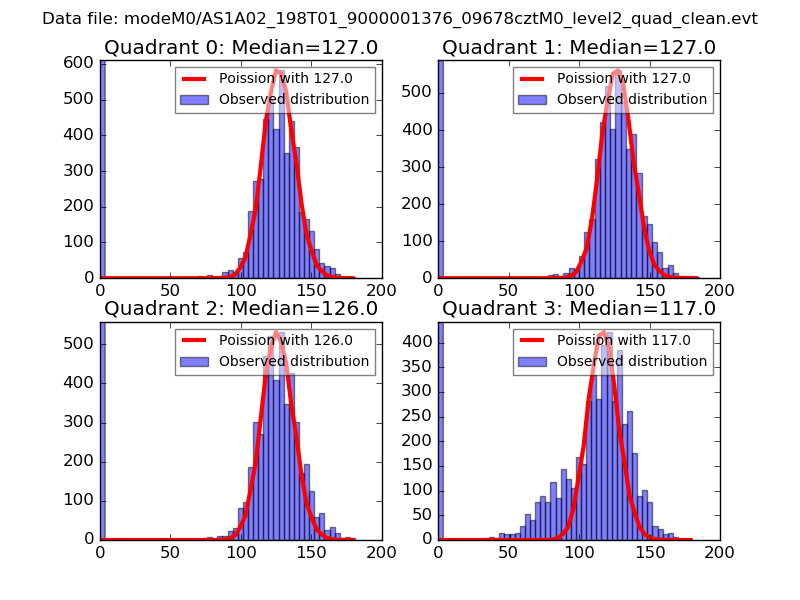 |
 |
| Quadrant-wise count rates Data is divided into 100 sec bins |
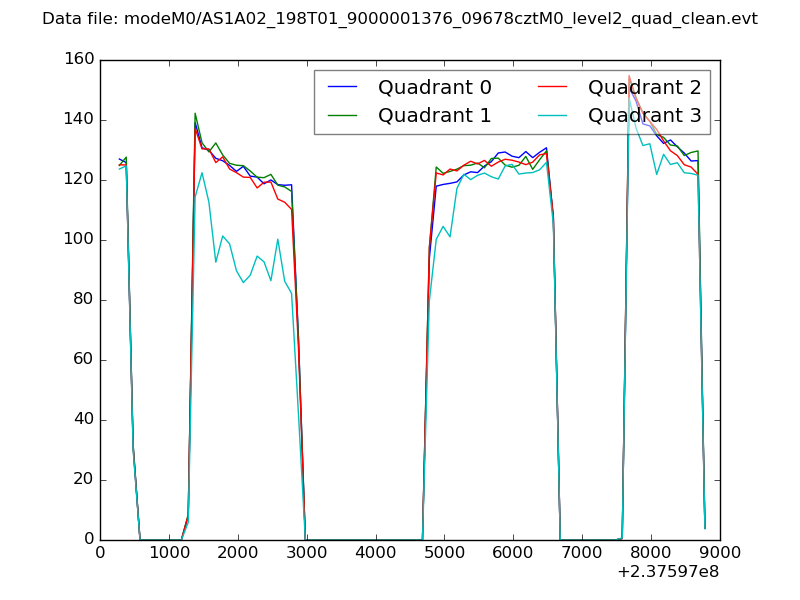 |
|
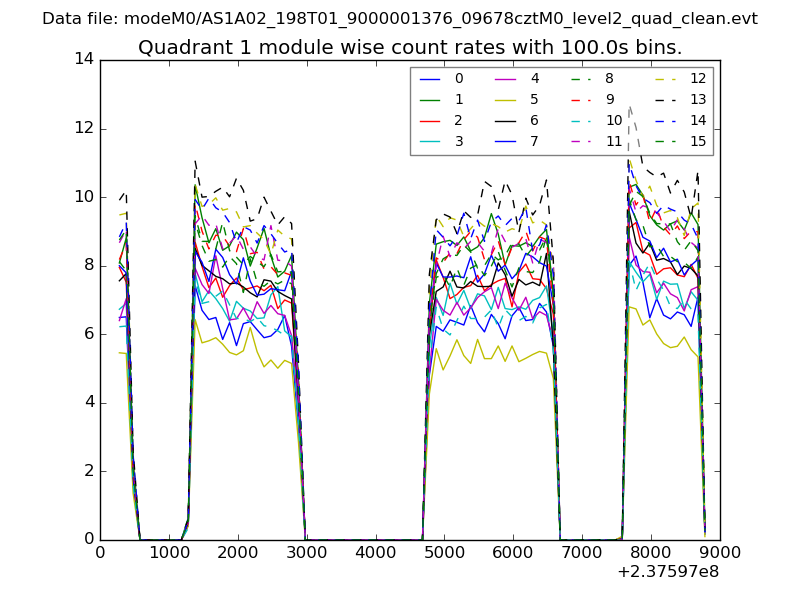
| Module-wise count rates for Quadrant A Data is divided into 100 sec bins |
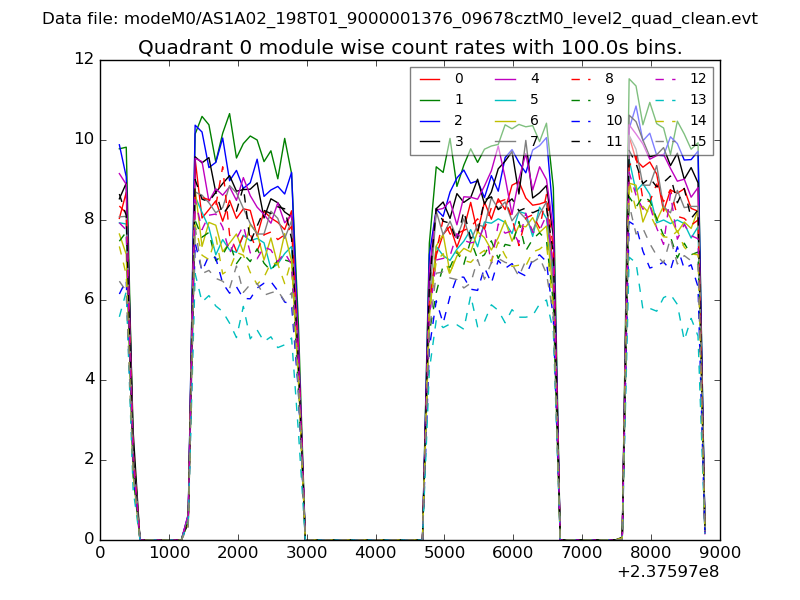 |
 |
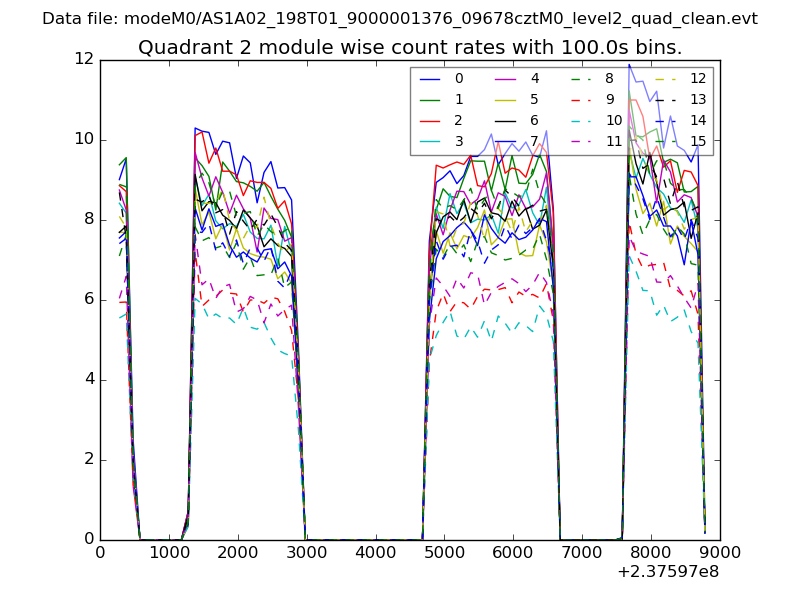
| Module-wise count rates for Quadrant B Data is divided into 100 sec bins |
 |
 |
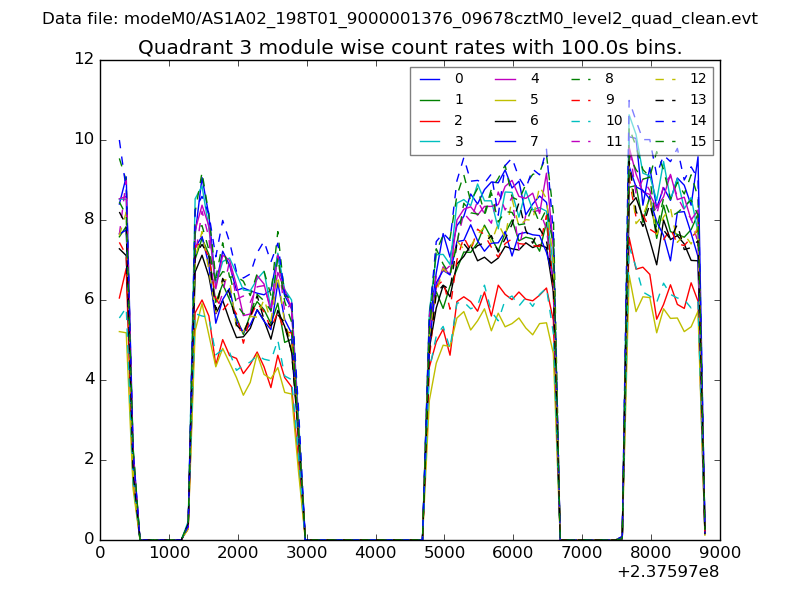
| Module-wise count rates for Quadrant C Data is divided into 100 sec bins |
 |
 |
| Module-wise count rates for Quadrant D Data is divided into 100 sec bins |
 |
 |
| Parameter | Plot |
|---|---|
| CZT HV Monitor | 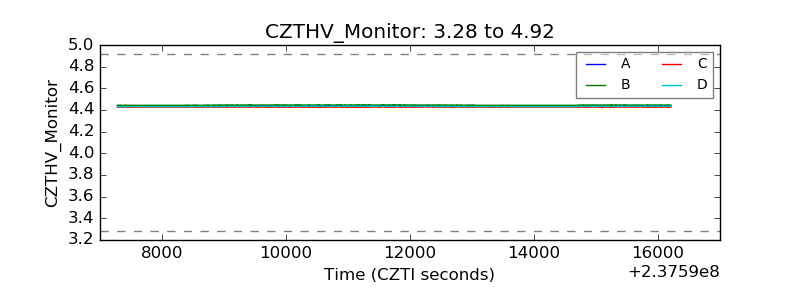 |
| D_VDD |  |
| Temperature 1 | 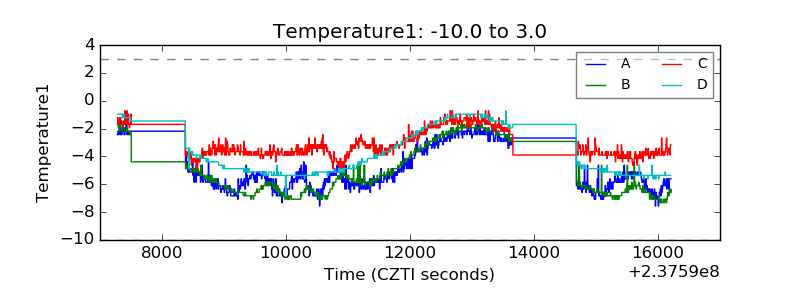 |
| Veto HV Monitor |  |
| Veto LLD | 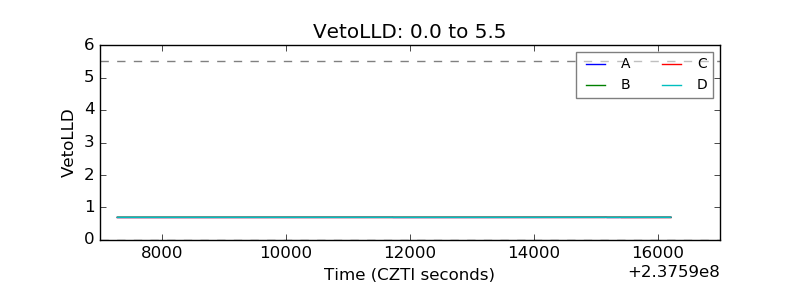 |
| Alpha Counter | 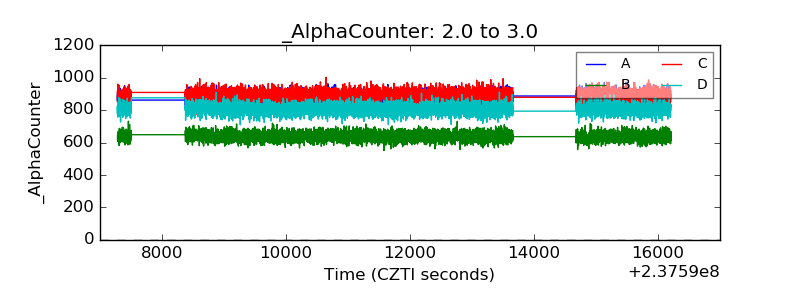 |
| _CPM_Rate | 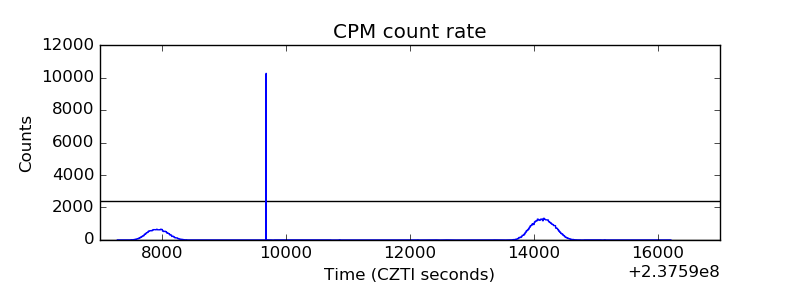 |
| CZT Counter |  |
| +2.5 Volts monitor |  |
| +5 Volts monitor | 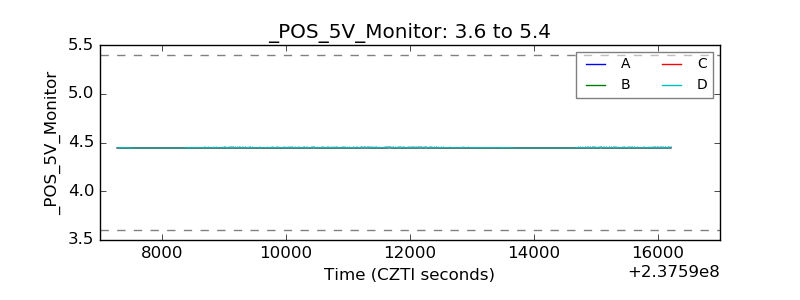 |
| _ROLL_ROT | 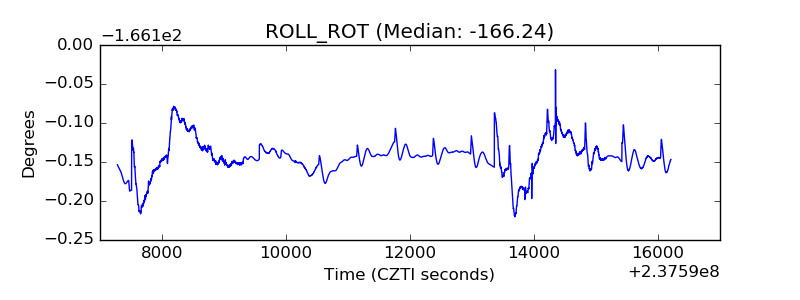 |
| _Roll_DEC | 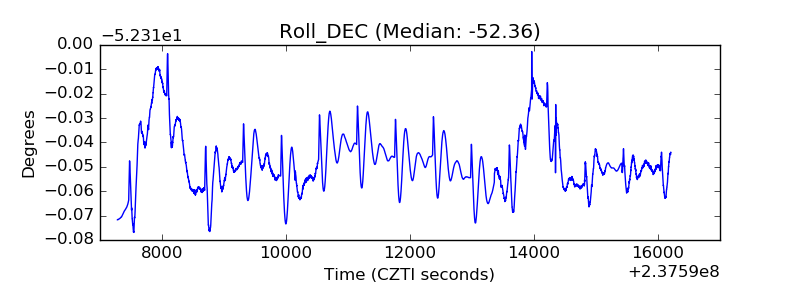 |
| _Roll_RA | 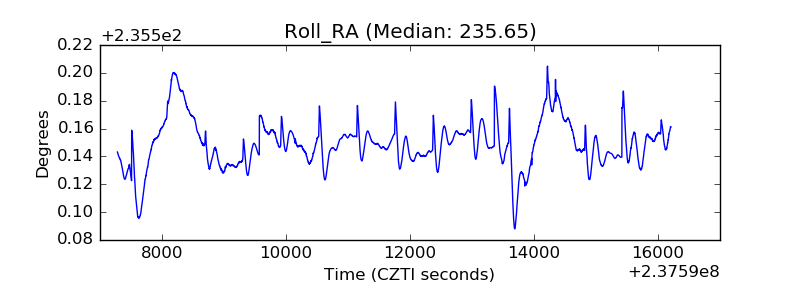 |
| Veto Counter | 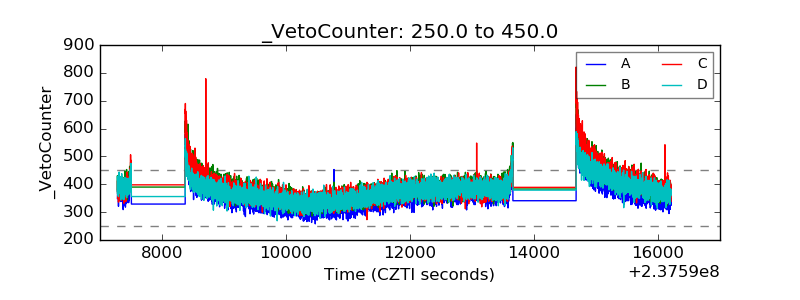 |