| Param | Original file | Final file |
|---|---|---|
| Filename | modeM0/AS1A02_198T01_9000001376_09680cztM0_level2.evt | modeM0/AS1A02_198T01_9000001376_09680cztM0_level2_quad_clean.evt |
| Size (bytes) | 493,603,200 | 91,848,960 |
| Size | 470.7 MB | 87.6 MB |
| Events in quadrant A | 3,685,051 | 577,161 |
| Events in quadrant B | 3,438,627 | 581,008 |
| Events in quadrant C | 3,285,554 | 582,684 |
| Events in quadrant D | 4,068,044 | 556,641 |
| Mode M9 | |||
|---|---|---|---|
| Quadrant | BADHDUFLAG | Total packets | Discarded packets |
| A | 0 | 21 | 0 |
| B | 0 | 21 | 0 |
| C | 0 | 21 | 0 |
| D | 0 | 21 | 0 |
| Mode SS | |||
|---|---|---|---|
| Quadrant | BADHDUFLAG | Total packets | Discarded packets |
| A | 0 | 144 | 0 |
| B | 0 | 144 | 0 |
| C | 0 | 144 | 0 |
| D | 0 | 144 | 0 |
| Mode M0 | |||
|---|---|---|---|
| Quadrant | BADHDUFLAG | Total packets | Discarded packets |
| A | 0 | 15283 | 3 |
| B | 0 | 14693 | 2 |
| C | 0 | 14408 | 2 |
| D | 0 | 17053 | 2 |
| Quadrant | Total seconds | Saturated seconds | Saturation percentage |
|---|---|---|---|
| A | 6944 | 38 | 0.547235% |
| B | 6944 | 43 | 0.619240% |
| C | 6944 | 48 | 0.691244% |
| D | 6944 | 82 | 1.180876% |
Noise dominated data is calculated using 1-second bins in cleaned event files. If a bin has >2000 counts, and if more than 50% of those come from <1% of pixels, then it is considered to be noise-dominated and hence unusable.
| Quadrant | # 1 sec bins | Bins with >0 counts | Bins with >2000 counts | High rate bins dominated by noise | Noise dominated (total time) | Noise dominated (detector-on time) | Marked lightcurve |
|---|---|---|---|---|---|---|---|
| A | 9079 | 6946 | 0 | 0 | 0.00% | 0.00% | 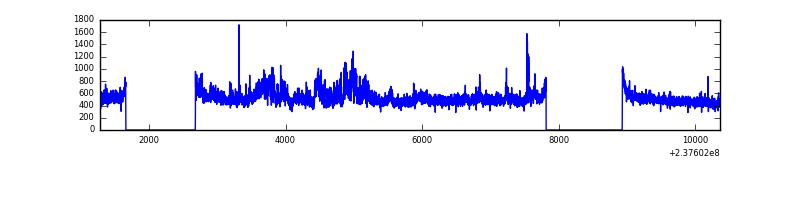 |
| B | 9079 | 6946 | 4 | 4 | 0.04% | 0.06% | 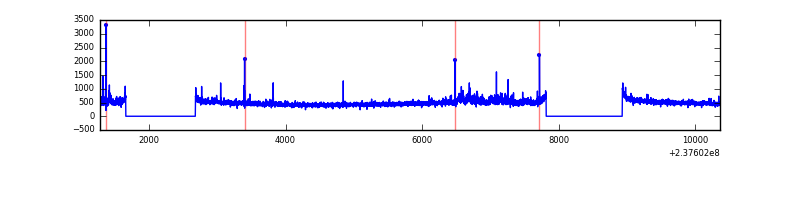 |
| C | 9079 | 6946 | 21 | 21 | 0.23% | 0.30% | 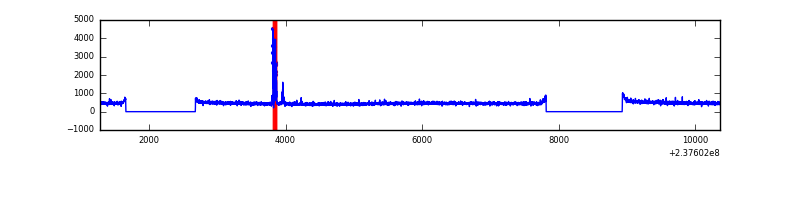 |
| D | 9079 | 6946 | 59 | 59 | 0.65% | 0.85% | 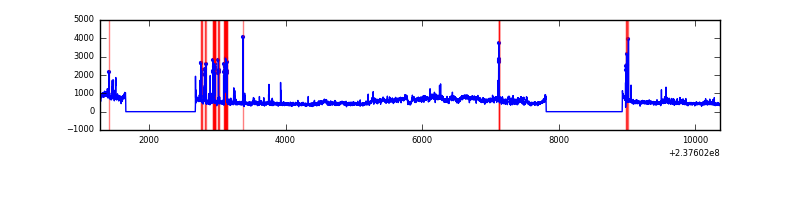 |
Top three noisy pixels from each quadrant. If the there are fewer than three noisy pixels in the level2.evt file, extra rows are filled as -1
| Pixel properties | Quadrant properties | ||||||
|---|---|---|---|---|---|---|---|
| Quadrant | DetID | PixID | Counts | Sigma | Mean | Median | Sigma |
| A | 8 | 15 | 438424 | 2606.63 | 829 | 811 | 167.9 |
| A | 15 | 174 | 31532 | 182.99 | 829 | 811 | 167.9 |
| A | 1 | 162 | 15486 | 87.41 | 829 | 811 | 167.9 |
| B | 0 | 214 | 75844 | 476.87 | 834 | 815 | 157.3 |
| B | 0 | 219 | 39875 | 248.26 | 834 | 815 | 157.3 |
| B | 12 | 111 | 17220 | 104.27 | 834 | 815 | 157.3 |
| C | 14 | 234 | 102797 | 545.65 | 812 | 816 | 186.9 |
| C | 9 | 68 | 16279 | 82.73 | 812 | 816 | 186.9 |
| C | 13 | 61 | 6000 | 27.74 | 812 | 816 | 186.9 |
| D | 8 | 195 | 702148 | 3608.11 | 801 | 781 | 194.4 |
| D | 1 | 52 | 187793 | 962.06 | 801 | 781 | 194.4 |
| D | 2 | 152 | 38962 | 196.42 | 801 | 781 | 194.4 |
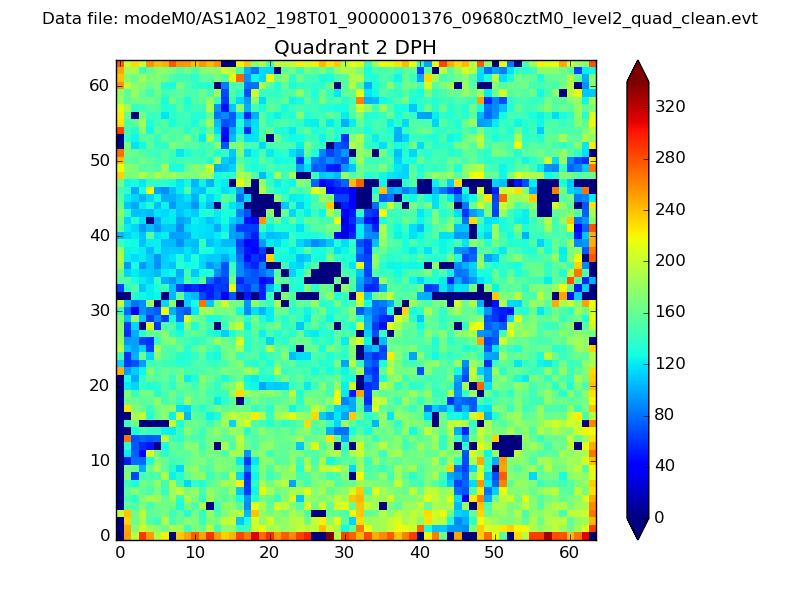
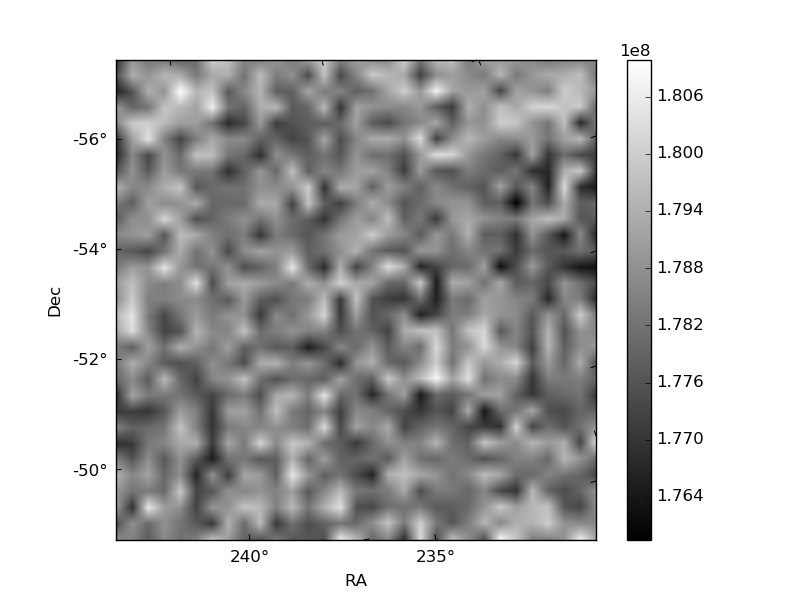
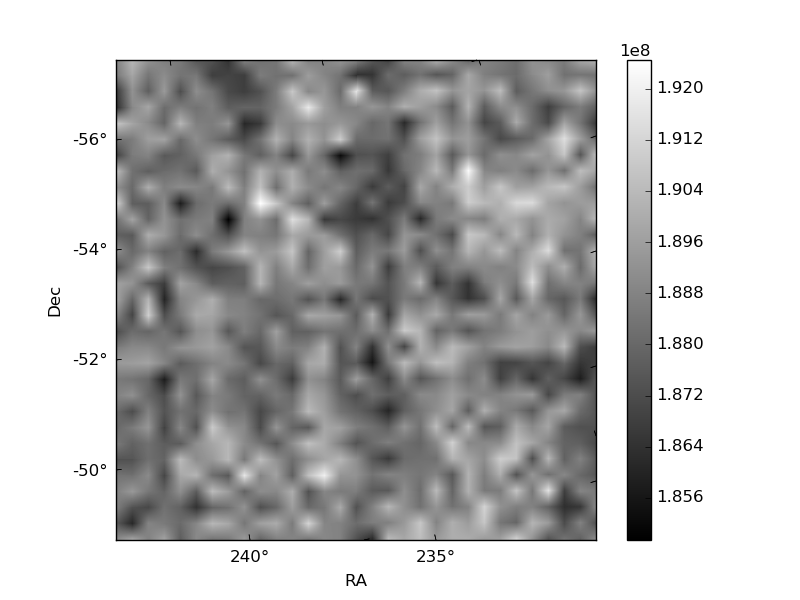
Histogram calculated using DETX and DETY for each event in the final _common_clean file
| Quadrant A |  |
 |
Quadrant B |
|---|---|---|---|
| Quadrant D | 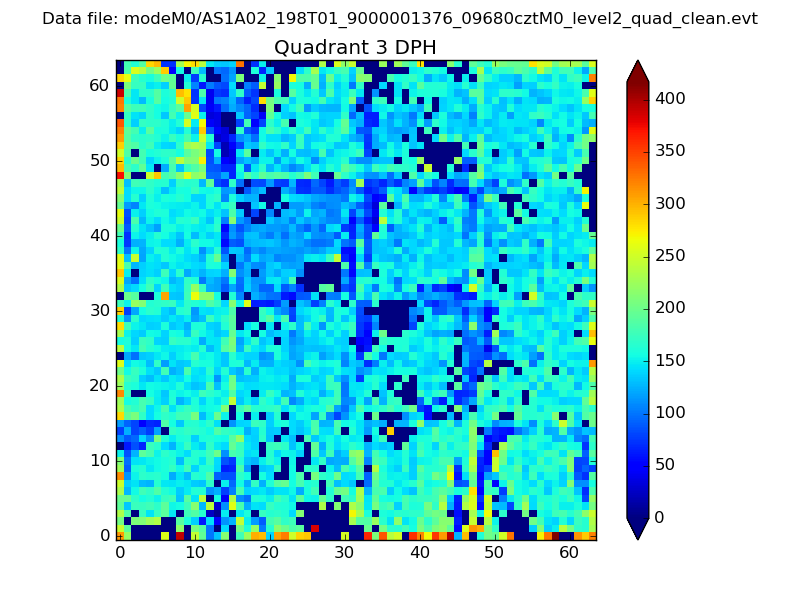 |
 |
Quadrant C |
| Plot type | Count rate plots | Images |
|---|---|---|
| Comparison with Poisson distribution Blue bars denote a histogram of data divided into 1 sec bins. Red curve is a Poisson curve with rate = median count rate of data. |
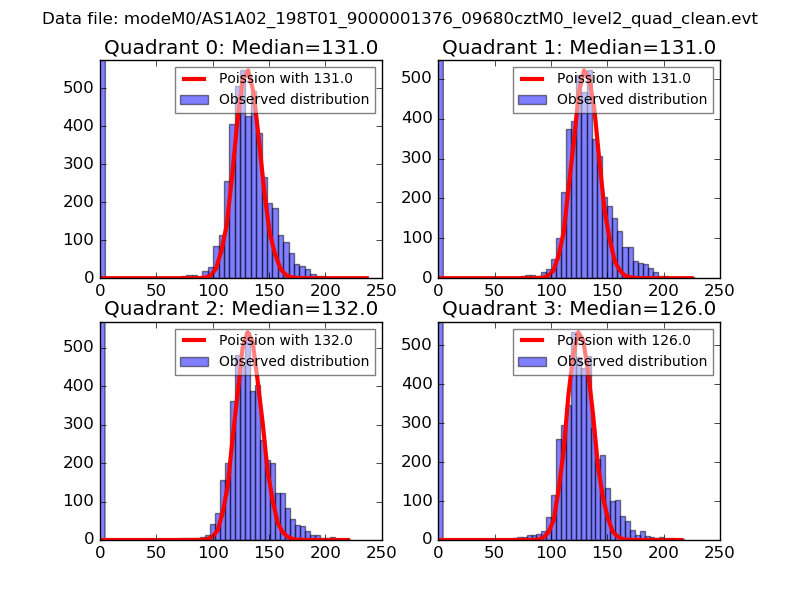 |
 |
| Quadrant-wise count rates Data is divided into 100 sec bins |
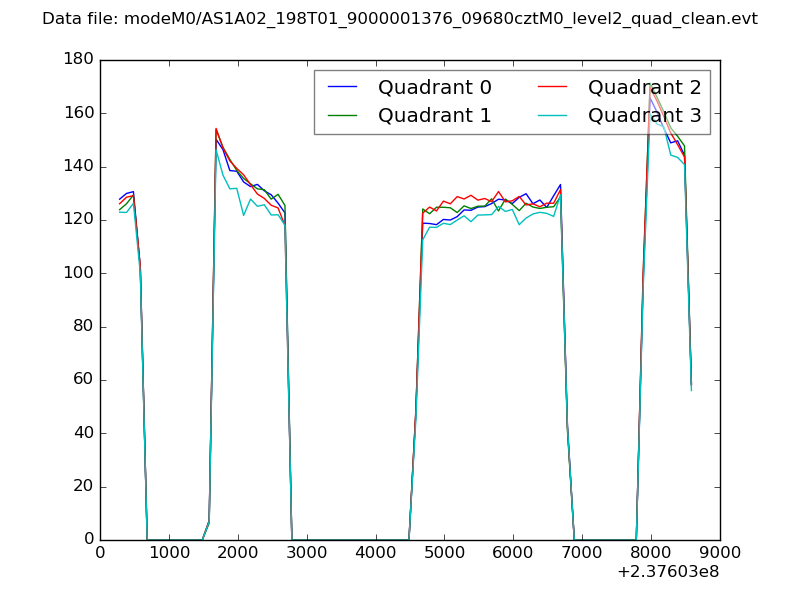 |
|
| Module-wise count rates for Quadrant A Data is divided into 100 sec bins |
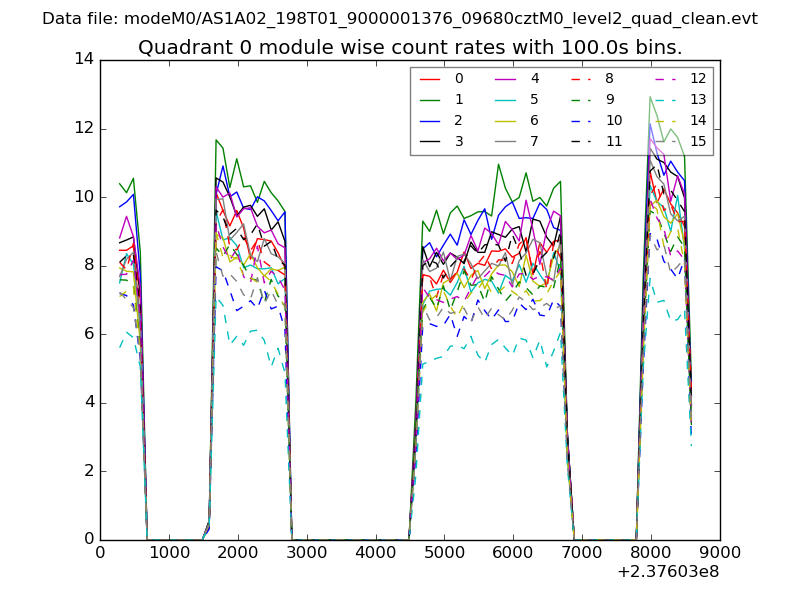 |
 |
| Module-wise count rates for Quadrant B Data is divided into 100 sec bins |
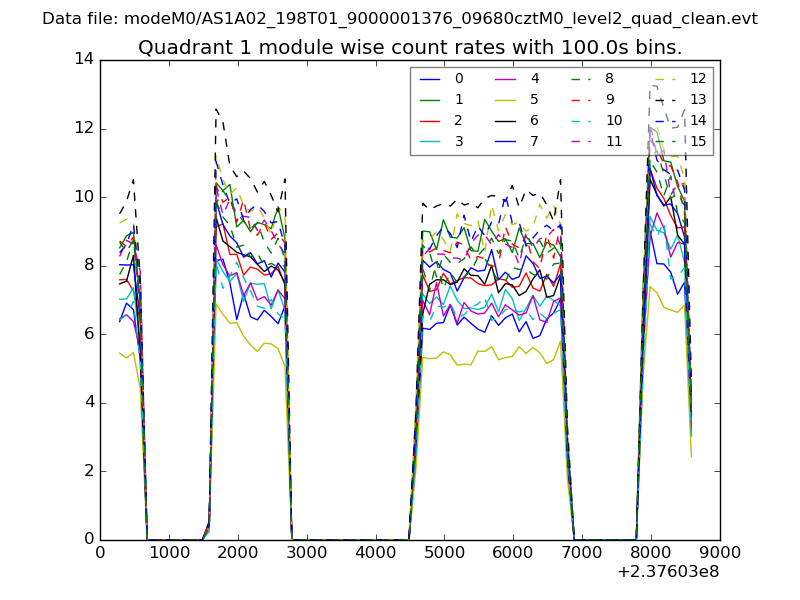 |
 |
| Module-wise count rates for Quadrant C Data is divided into 100 sec bins |
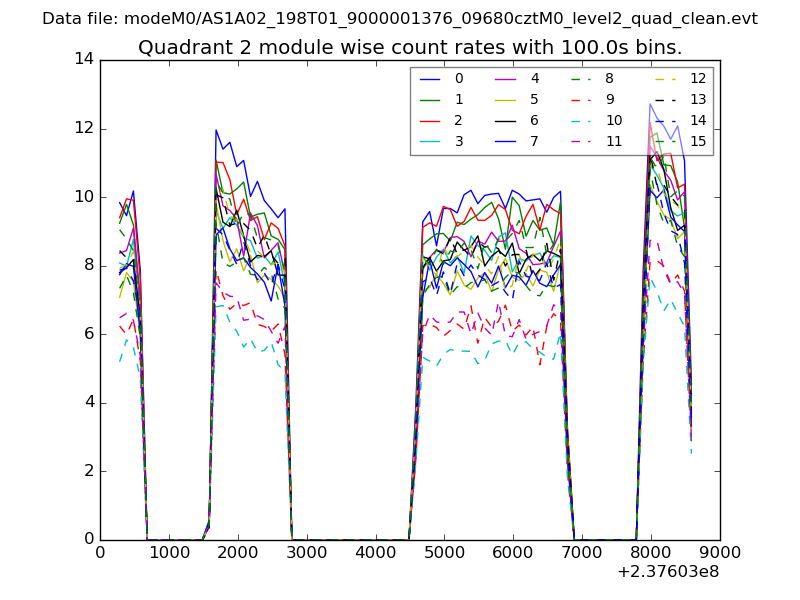 |
 |
| Module-wise count rates for Quadrant D Data is divided into 100 sec bins |
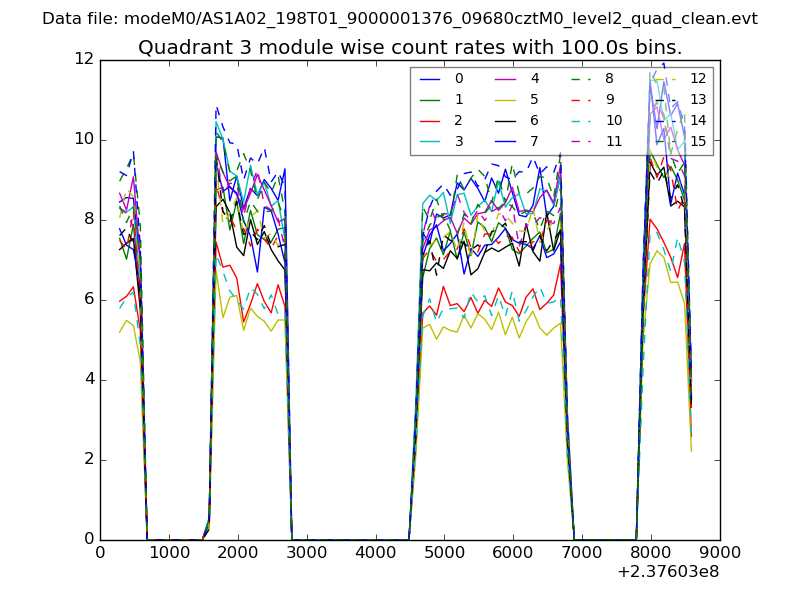 |
 |
| Parameter | Plot |
|---|---|
| CZT HV Monitor | 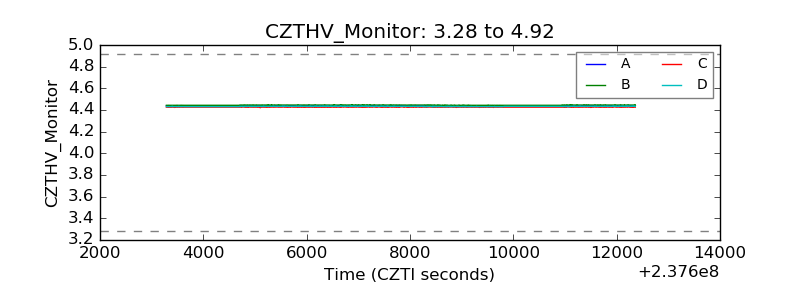 |
| D_VDD | 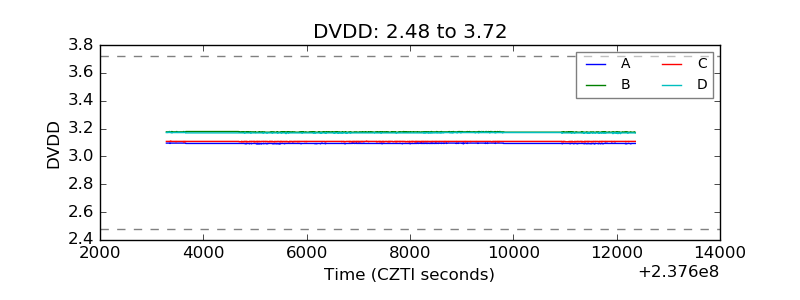 |
| Temperature 1 | 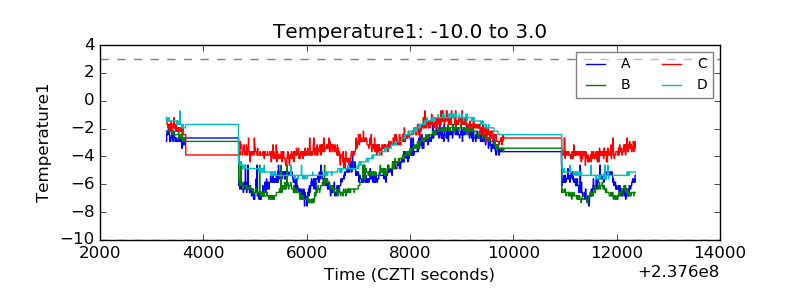 |
| Veto HV Monitor | 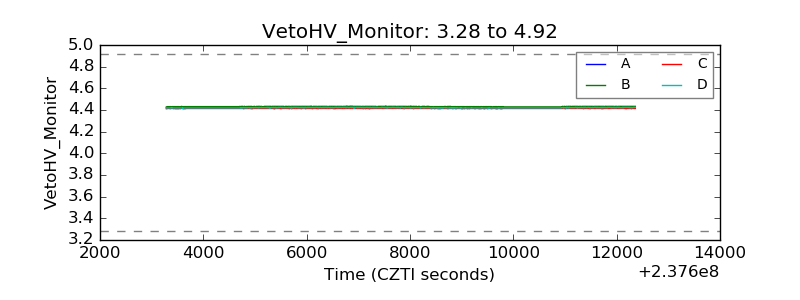 |
| Veto LLD | 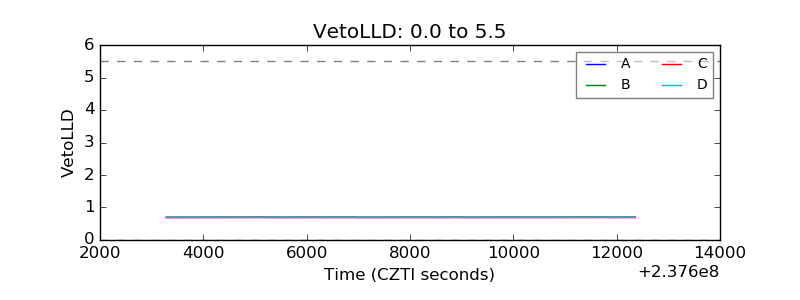 |
| Alpha Counter | 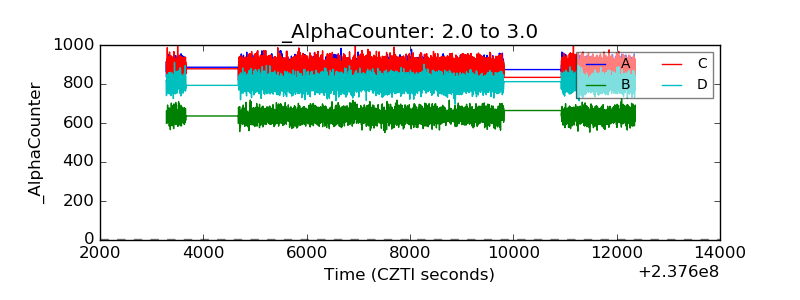 |
| _CPM_Rate | 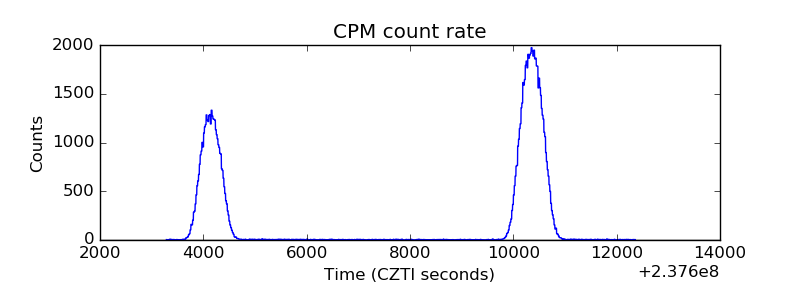 |
| CZT Counter | 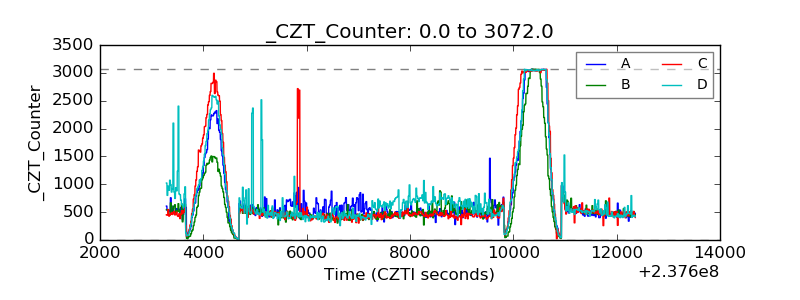 |
| +2.5 Volts monitor |  |
| +5 Volts monitor |  |
| _ROLL_ROT | 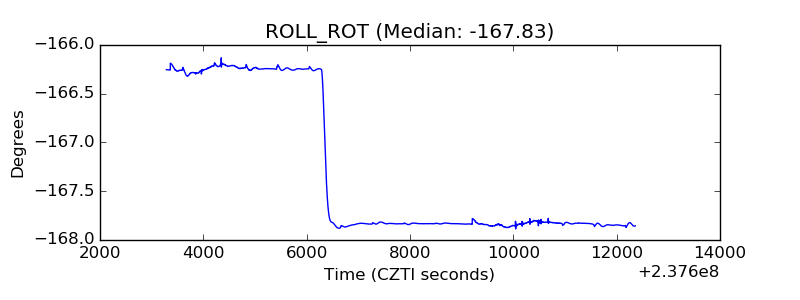 |
| _Roll_DEC | 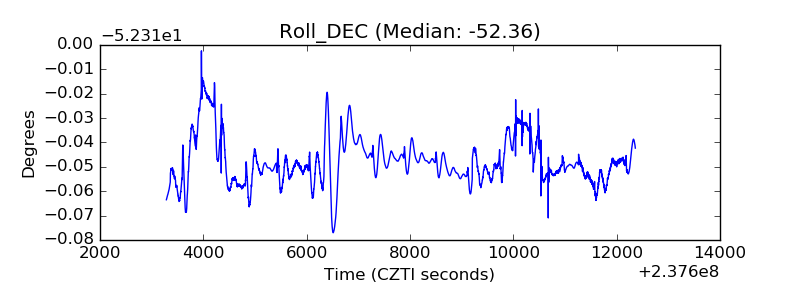 |
| _Roll_RA |  |
| Veto Counter | 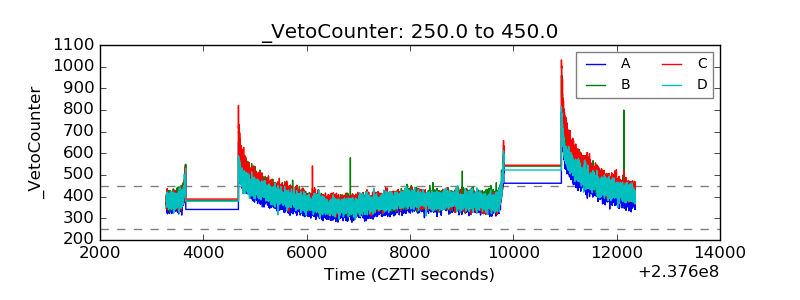 |