| Param | Original file | Final file |
|---|---|---|
| Filename | modeM0/AS1A02_198T01_9000001376_09683cztM0_level2.evt | modeM0/AS1A02_198T01_9000001376_09683cztM0_level2_quad_clean.evt |
| Size (bytes) | 430,836,480 | 70,237,440 |
| Size | 410.9 MB | 67.0 MB |
| Events in quadrant A | 3,083,995 | 427,054 |
| Events in quadrant B | 3,199,638 | 428,301 |
| Events in quadrant C | 3,043,467 | 431,209 |
| Events in quadrant D | 3,307,957 | 416,393 |
| Mode M9 | |||
|---|---|---|---|
| Quadrant | BADHDUFLAG | Total packets | Discarded packets |
| A | 0 | 22 | 0 |
| B | 0 | 22 | 1 |
| C | 0 | 22 | 0 |
| D | 0 | 23 | 1 |
| Mode SS | |||
|---|---|---|---|
| Quadrant | BADHDUFLAG | Total packets | Discarded packets |
| A | 0 | 124 | 2 |
| B | 0 | 124 | 6 |
| C | 0 | 124 | 0 |
| D | 0 | 124 | 2 |
| Mode M0 | |||
|---|---|---|---|
| Quadrant | BADHDUFLAG | Total packets | Discarded packets |
| A | 0 | 12990 | 293 |
| B | 0 | 13335 | 295 |
| C | 0 | 13107 | 297 |
| D | 0 | 13894 | 332 |
| Quadrant | Total seconds | Saturated seconds | Saturation percentage |
|---|---|---|---|
| A | 6079 | 70 | 1.151505% |
| B | 6076 | 93 | 1.530612% |
| C | 6074 | 70 | 1.152453% |
| D | 6070 | 70 | 1.153213% |
Noise dominated data is calculated using 1-second bins in cleaned event files. If a bin has >2000 counts, and if more than 50% of those come from <1% of pixels, then it is considered to be noise-dominated and hence unusable.
| Quadrant | # 1 sec bins | Bins with >0 counts | Bins with >2000 counts | High rate bins dominated by noise | Noise dominated (total time) | Noise dominated (detector-on time) | Marked lightcurve |
|---|---|---|---|---|---|---|---|
| A | 7524 | 6195 | 0 | 0 | 0.00% | 0.00% | 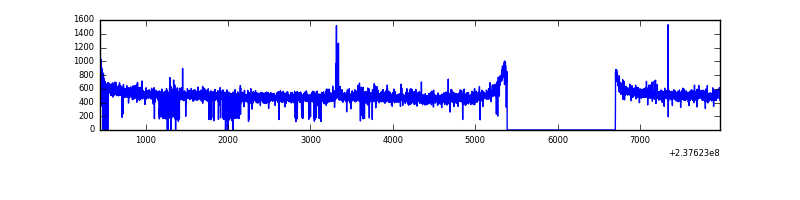 |
| B | 7524 | 6193 | 0 | 0 | 0.00% | 0.00% | 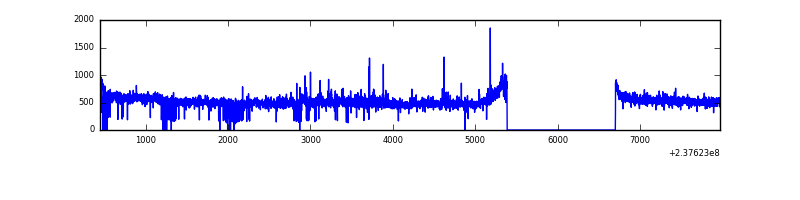 |
| C | 7524 | 6195 | 0 | 0 | 0.00% | 0.00% | 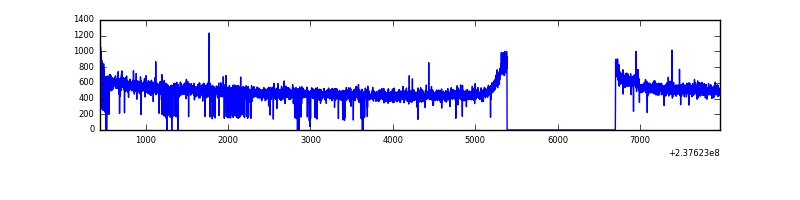 |
| D | 7524 | 6196 | 5 | 5 | 0.07% | 0.08% | 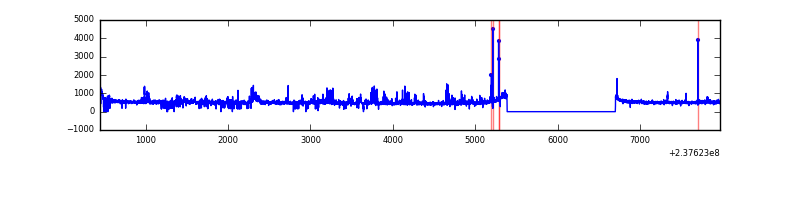 |
Top three noisy pixels from each quadrant. If the there are fewer than three noisy pixels in the level2.evt file, extra rows are filled as -1
| Pixel properties | Quadrant properties | ||||||
|---|---|---|---|---|---|---|---|
| Quadrant | DetID | PixID | Counts | Sigma | Mean | Median | Sigma |
| A | 1 | 162 | 24985 | 153.68 | 787 | 771 | 157.6 |
| A | 15 | 174 | 11557 | 68.46 | 787 | 771 | 157.6 |
| A | 1 | 178 | 8567 | 49.48 | 787 | 771 | 157.6 |
| B | 0 | 214 | 46610 | 314.18 | 788 | 771 | 145.9 |
| B | 0 | 219 | 44862 | 302.2 | 788 | 771 | 145.9 |
| B | 12 | 111 | 15310 | 99.65 | 788 | 771 | 145.9 |
| C | 10 | 22 | 12056 | 64.29 | 774 | 778 | 175.4 |
| C | 9 | 68 | 11242 | 59.65 | 774 | 778 | 175.4 |
| C | 13 | 61 | 5797 | 28.61 | 774 | 778 | 175.4 |
| D | 1 | 52 | 144077 | 784.89 | 766 | 747 | 182.6 |
| D | 8 | 195 | 97298 | 528.72 | 766 | 747 | 182.6 |
| D | 7 | 46 | 91532 | 497.15 | 766 | 747 | 182.6 |
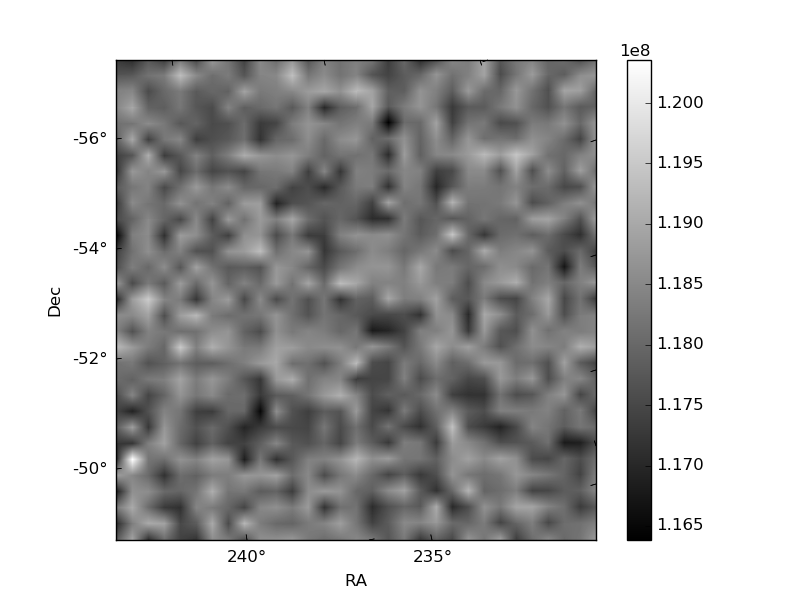
Histogram calculated using DETX and DETY for each event in the final _common_clean file
| Quadrant A | 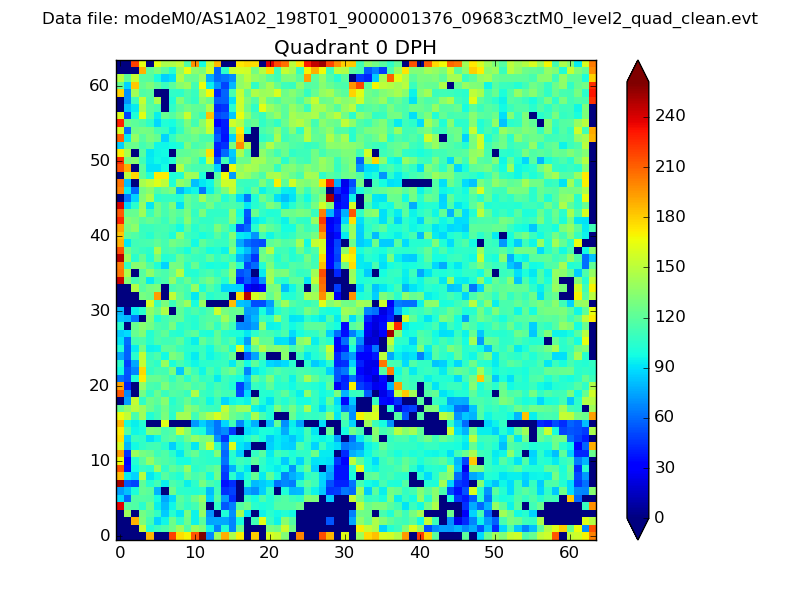 |
 |
Quadrant B |
|---|---|---|---|
| Quadrant D |  |
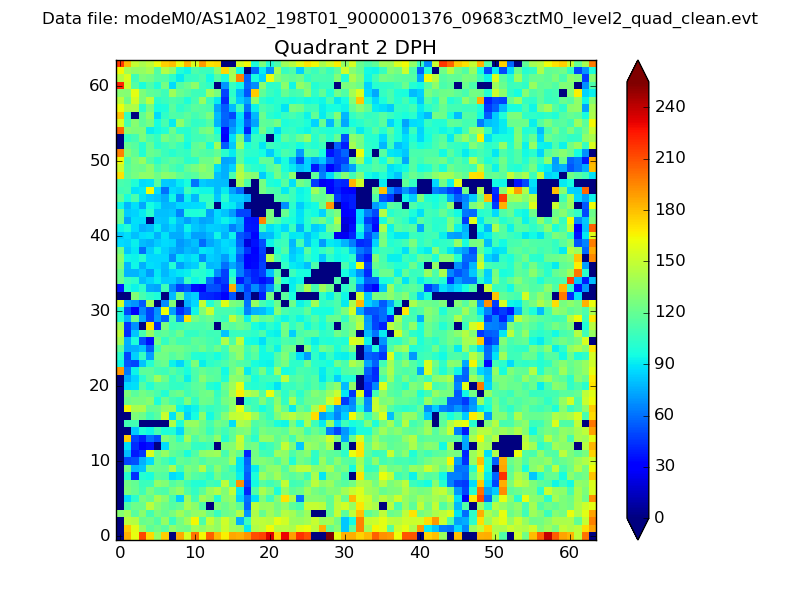 |
Quadrant C |
| Plot type | Count rate plots | Images |
|---|---|---|
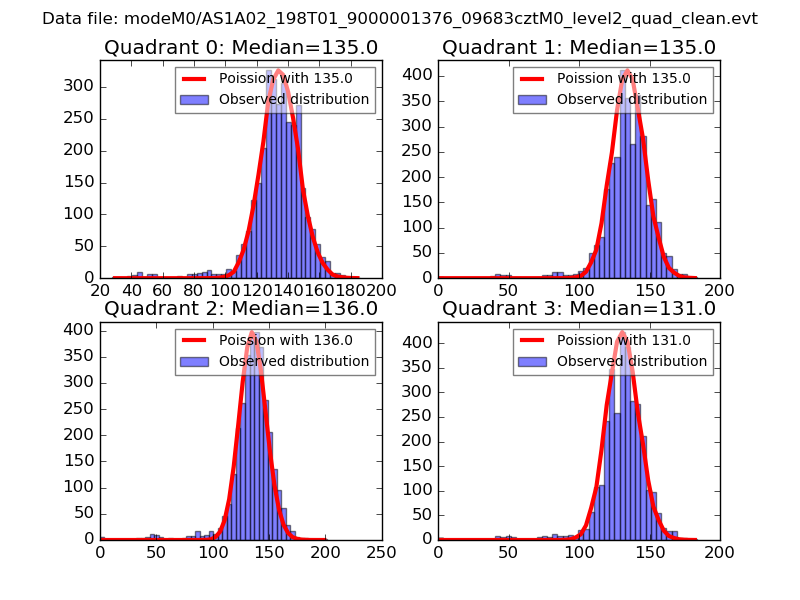
| Comparison with Poisson distribution Blue bars denote a histogram of data divided into 1 sec bins. Red curve is a Poisson curve with rate = median count rate of data. |
 |
 |
| Quadrant-wise count rates Data is divided into 100 sec bins |
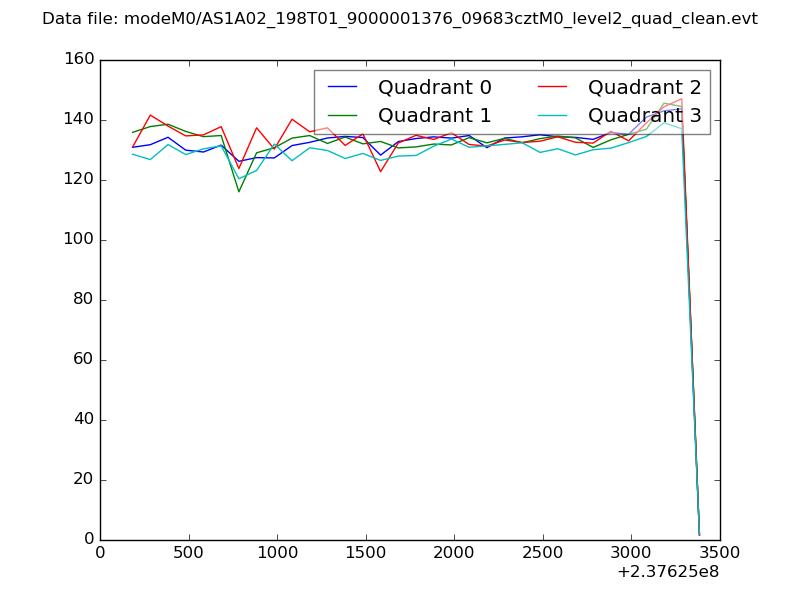 |
|
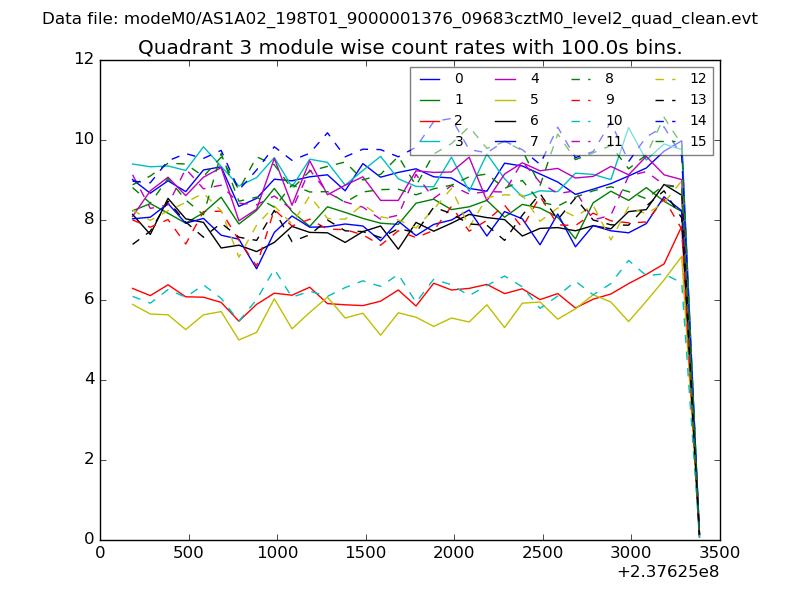
| Module-wise count rates for Quadrant A Data is divided into 100 sec bins |
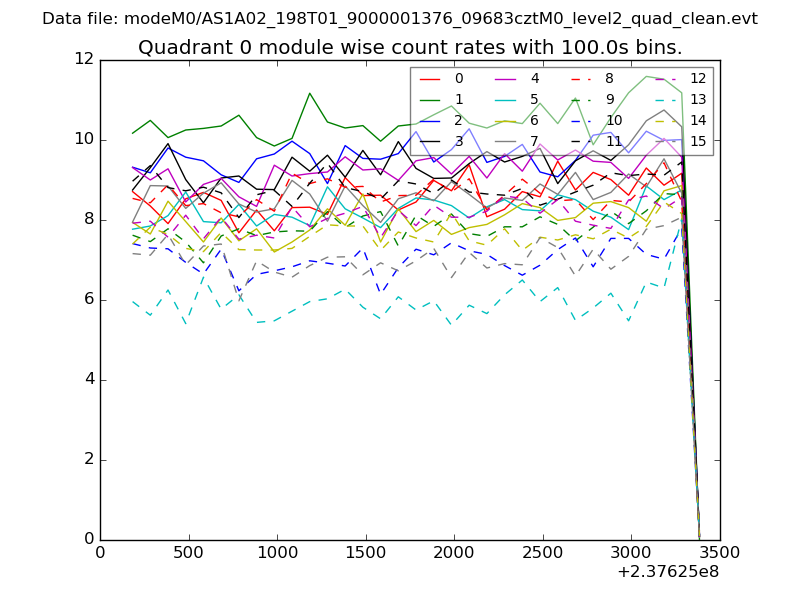 |
 |
| Module-wise count rates for Quadrant B Data is divided into 100 sec bins |
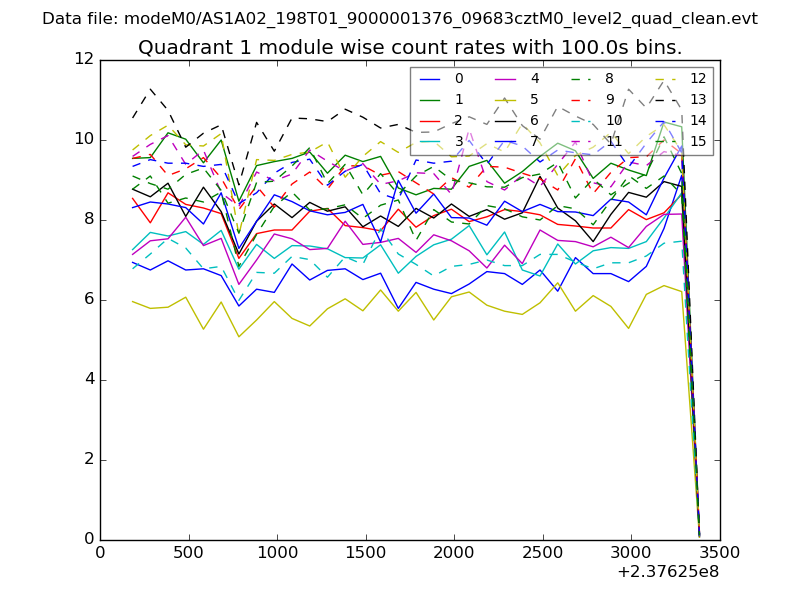 |
 |
| Module-wise count rates for Quadrant C Data is divided into 100 sec bins |
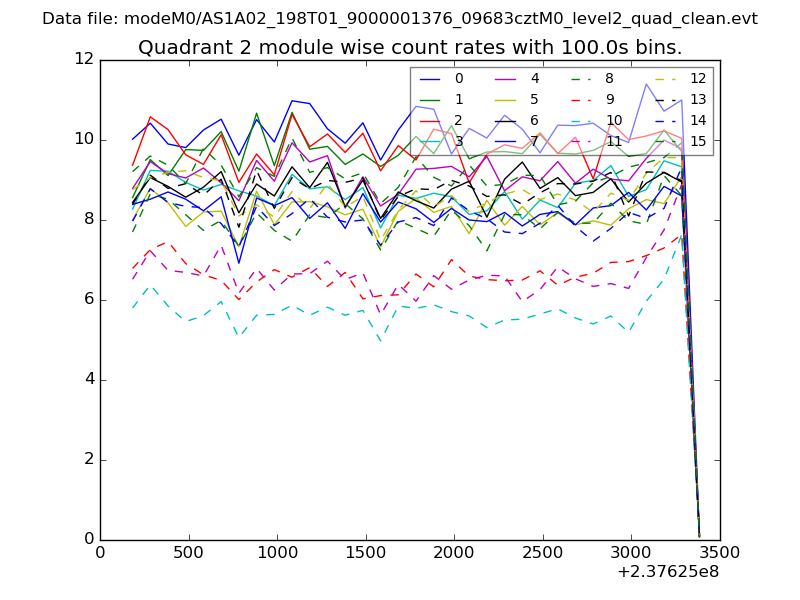 |
 |
| Module-wise count rates for Quadrant D Data is divided into 100 sec bins |
 |
 |
| Parameter | Plot |
|---|---|
| CZT HV Monitor | 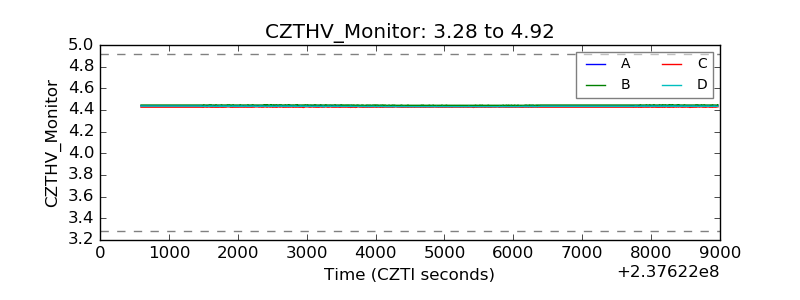 |
| D_VDD | 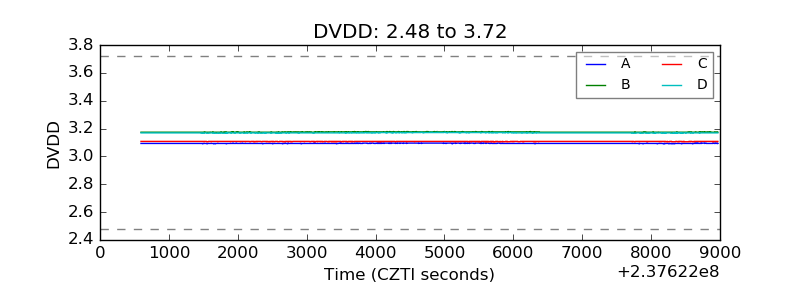 |
| Temperature 1 | 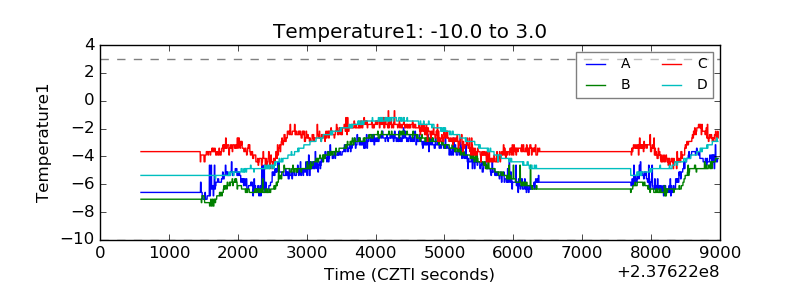 |
| Veto HV Monitor | 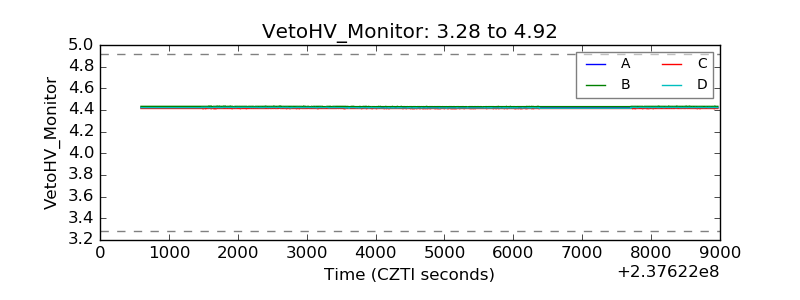 |
| Veto LLD | 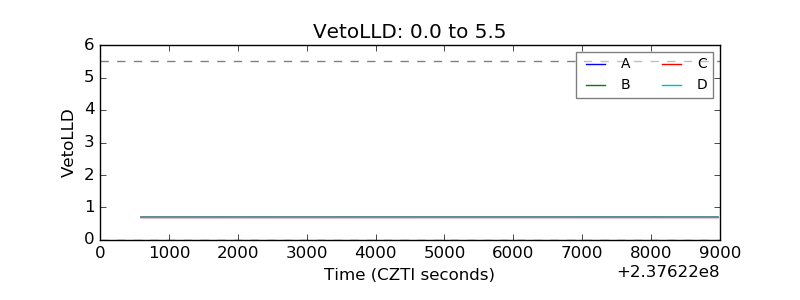 |
| Alpha Counter | 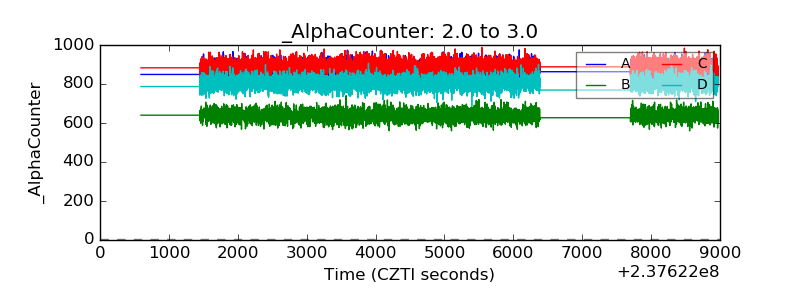 |
| _CPM_Rate | 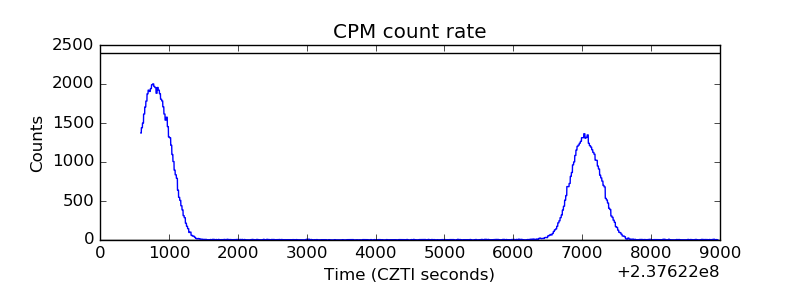 |
| CZT Counter | 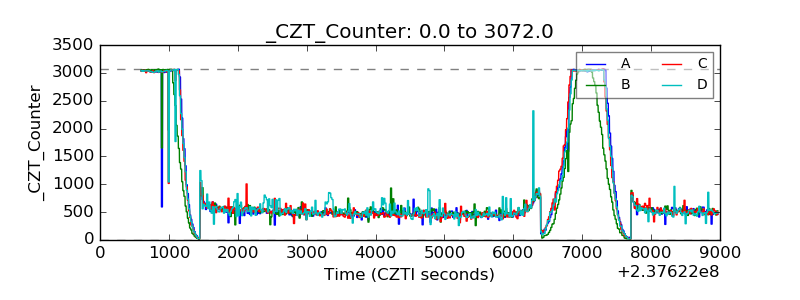 |
| +2.5 Volts monitor |  |
| +5 Volts monitor |  |
| _ROLL_ROT | 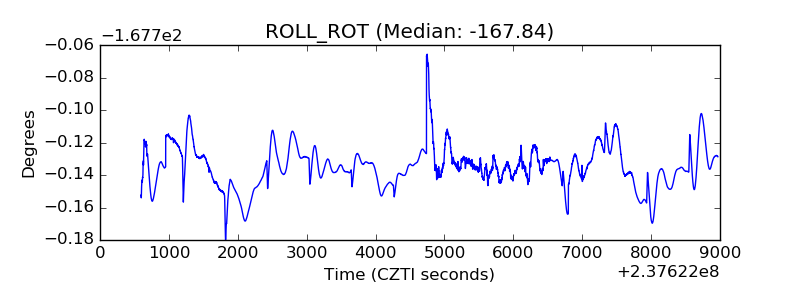 |
| _Roll_DEC | 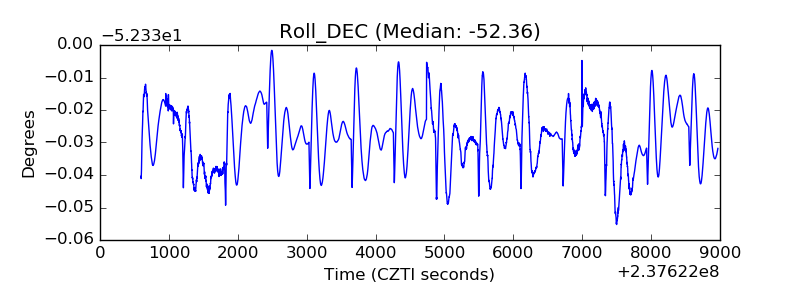 |
| _Roll_RA | 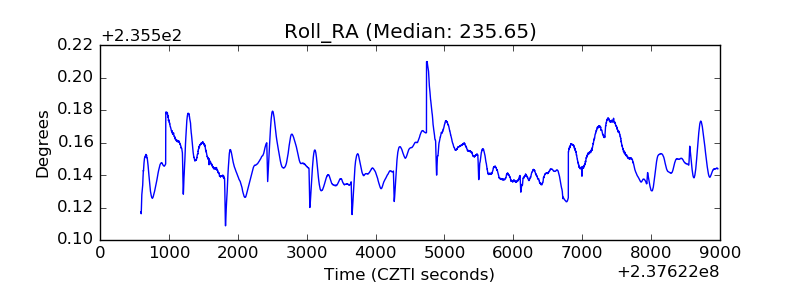 |
| Veto Counter | 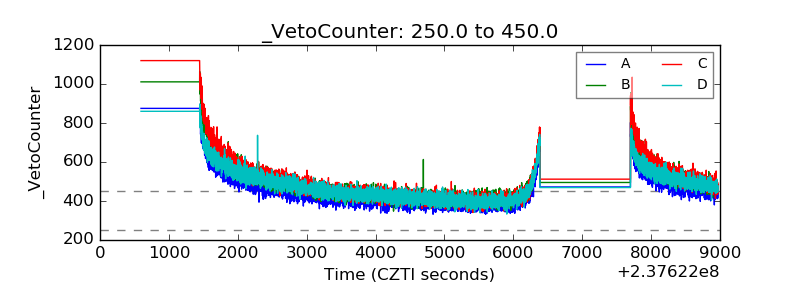 |