| Param | Original file | Final file |
|---|---|---|
| Filename | modeM0/AS1A02_198T01_9000001376_09684cztM0_level2.evt | modeM0/AS1A02_198T01_9000001376_09684cztM0_level2_quad_clean.evt |
| Size (bytes) | 439,790,400 | 84,188,160 |
| Size | 419.4 MB | 80.3 MB |
| Events in quadrant A | 3,082,623 | 530,467 |
| Events in quadrant B | 3,233,932 | 530,932 |
| Events in quadrant C | 3,137,216 | 535,657 |
| Events in quadrant D | 3,441,061 | 516,811 |
| Mode M9 | |||
|---|---|---|---|
| Quadrant | BADHDUFLAG | Total packets | Discarded packets |
| A | 0 | 20 | 0 |
| B | 0 | 20 | 1 |
| C | 0 | 20 | 0 |
| D | 0 | 21 | 0 |
| Mode SS | |||
|---|---|---|---|
| Quadrant | BADHDUFLAG | Total packets | Discarded packets |
| A | 0 | 128 | 2 |
| B | 0 | 128 | 2 |
| C | 0 | 128 | 2 |
| D | 0 | 128 | 0 |
| Mode M0 | |||
|---|---|---|---|
| Quadrant | BADHDUFLAG | Total packets | Discarded packets |
| A | 0 | 13108 | 171 |
| B | 0 | 13473 | 229 |
| C | 0 | 13445 | 163 |
| D | 0 | 14259 | 193 |
| Quadrant | Total seconds | Saturated seconds | Saturation percentage |
|---|---|---|---|
| A | 6242 | 126 | 2.018584% |
| B | 6222 | 147 | 2.362584% |
| C | 6245 | 118 | 1.889512% |
| D | 6239 | 124 | 1.987498% |
Noise dominated data is calculated using 1-second bins in cleaned event files. If a bin has >2000 counts, and if more than 50% of those come from <1% of pixels, then it is considered to be noise-dominated and hence unusable.
| Quadrant | # 1 sec bins | Bins with >0 counts | Bins with >2000 counts | High rate bins dominated by noise | Noise dominated (total time) | Noise dominated (detector-on time) | Marked lightcurve |
|---|---|---|---|---|---|---|---|
| A | 7519 | 6319 | 0 | 0 | 0.00% | 0.00% | 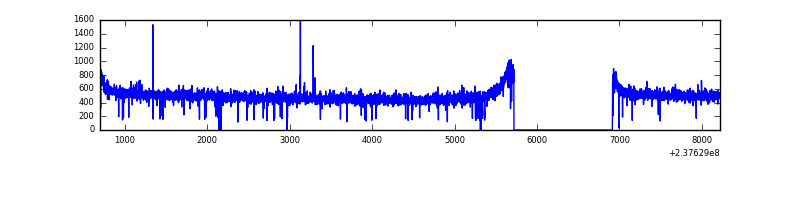 |
| B | 7519 | 6316 | 5 | 5 | 0.07% | 0.08% | 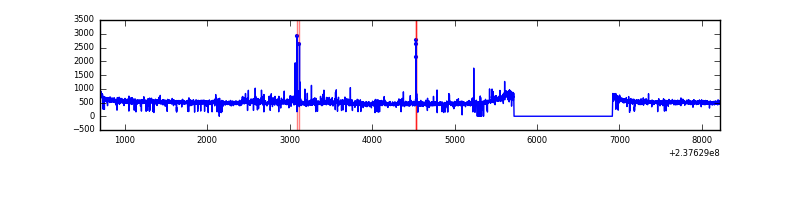 |
| C | 7519 | 6323 | 1 | 1 | 0.01% | 0.02% | 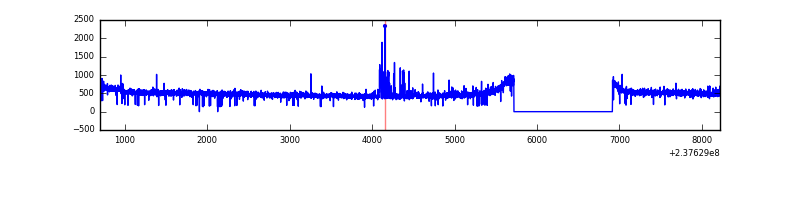 |
| D | 7519 | 6316 | 9 | 9 | 0.12% | 0.14% | 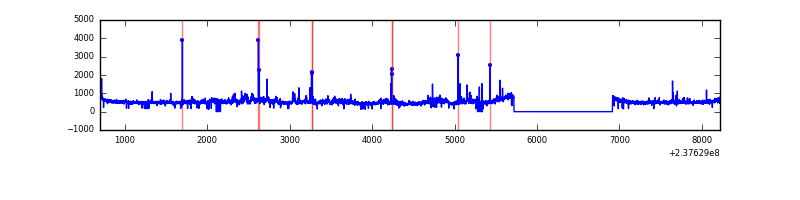 |
Top three noisy pixels from each quadrant. If the there are fewer than three noisy pixels in the level2.evt file, extra rows are filled as -1
| Pixel properties | Quadrant properties | ||||||
|---|---|---|---|---|---|---|---|
| Quadrant | DetID | PixID | Counts | Sigma | Mean | Median | Sigma |
| A | 0 | 226 | 7556 | 42.15 | 797 | 780 | 160.8 |
| A | 12 | 194 | 6667 | 36.62 | 797 | 780 | 160.8 |
| A | 15 | 174 | 6505 | 35.61 | 797 | 780 | 160.8 |
| B | 0 | 214 | 74793 | 495.94 | 793 | 773 | 149.3 |
| B | 4 | 173 | 25817 | 167.8 | 793 | 773 | 149.3 |
| B | 10 | 245 | 24595 | 159.61 | 793 | 773 | 149.3 |
| C | 9 | 68 | 84946 | 475.85 | 779 | 784 | 176.9 |
| C | 10 | 22 | 11864 | 62.65 | 779 | 784 | 176.9 |
| C | 13 | 61 | 5911 | 28.99 | 779 | 784 | 176.9 |
| D | 8 | 195 | 243380 | 1307.66 | 775 | 755 | 185.5 |
| D | 1 | 52 | 77942 | 416.01 | 775 | 755 | 185.5 |
| D | 7 | 46 | 74848 | 399.33 | 775 | 755 | 185.5 |
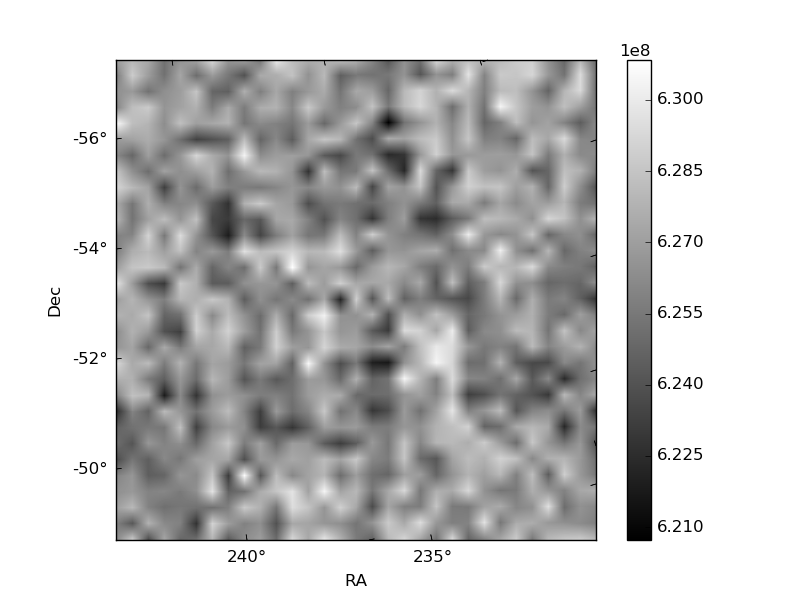
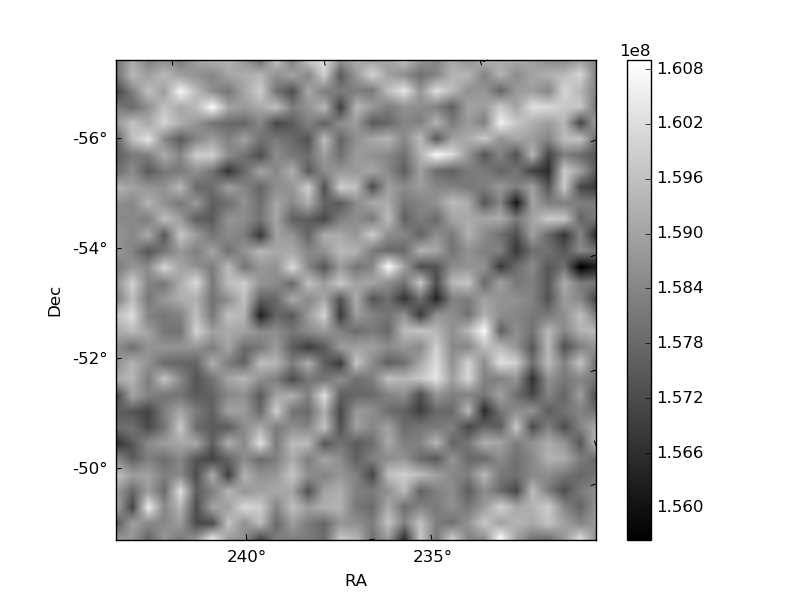
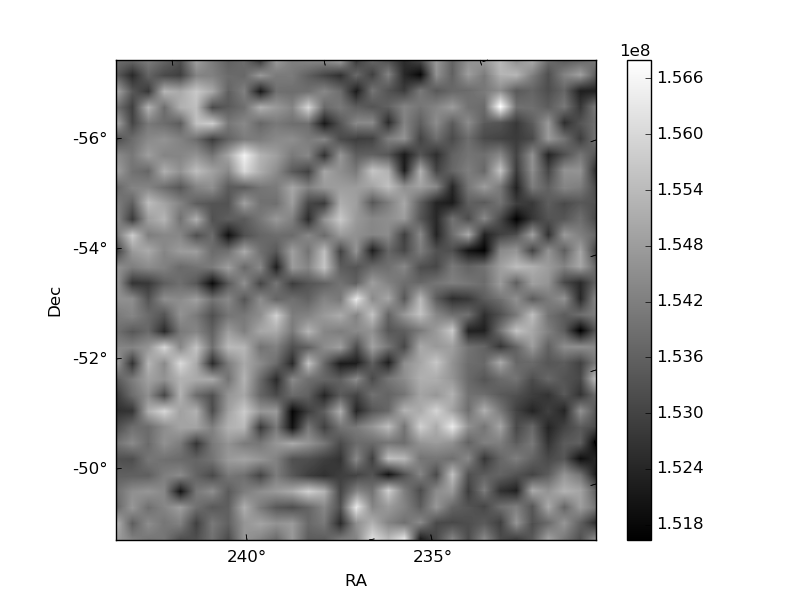
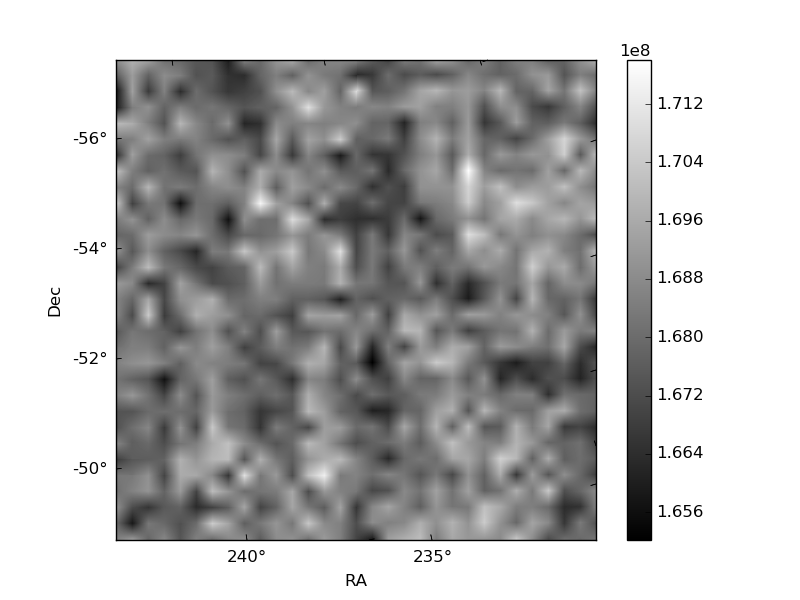
Histogram calculated using DETX and DETY for each event in the final _common_clean file
| Quadrant A | 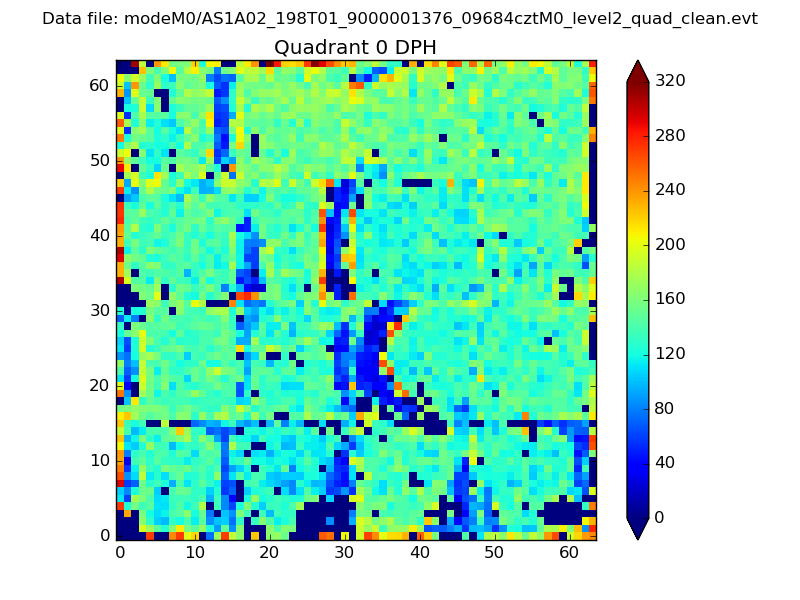 |
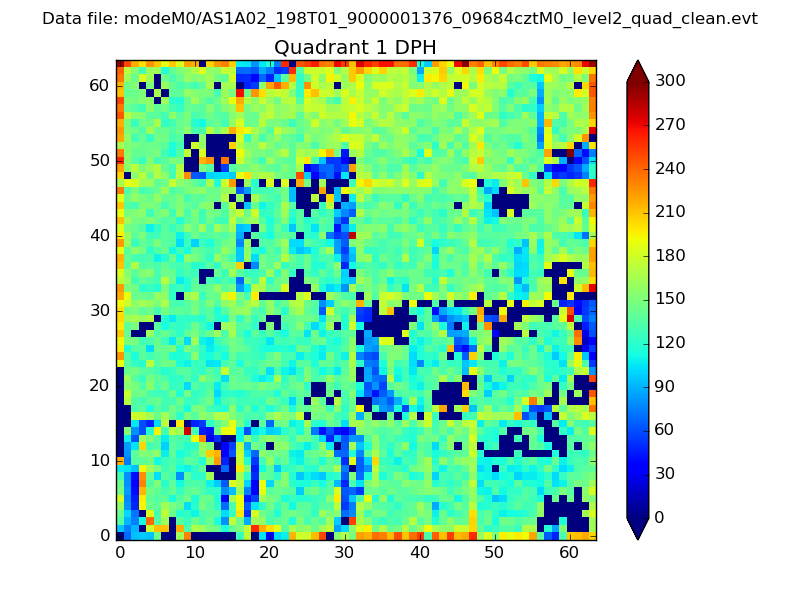 |
Quadrant B |
|---|---|---|---|
| Quadrant D | 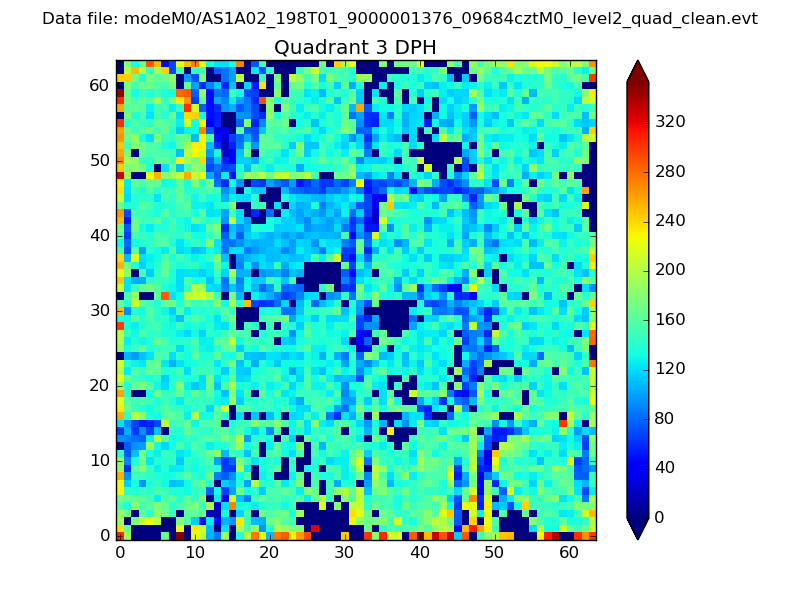 |
 |
Quadrant C |
| Plot type | Count rate plots | Images |
|---|---|---|
| Comparison with Poisson distribution Blue bars denote a histogram of data divided into 1 sec bins. Red curve is a Poisson curve with rate = median count rate of data. |
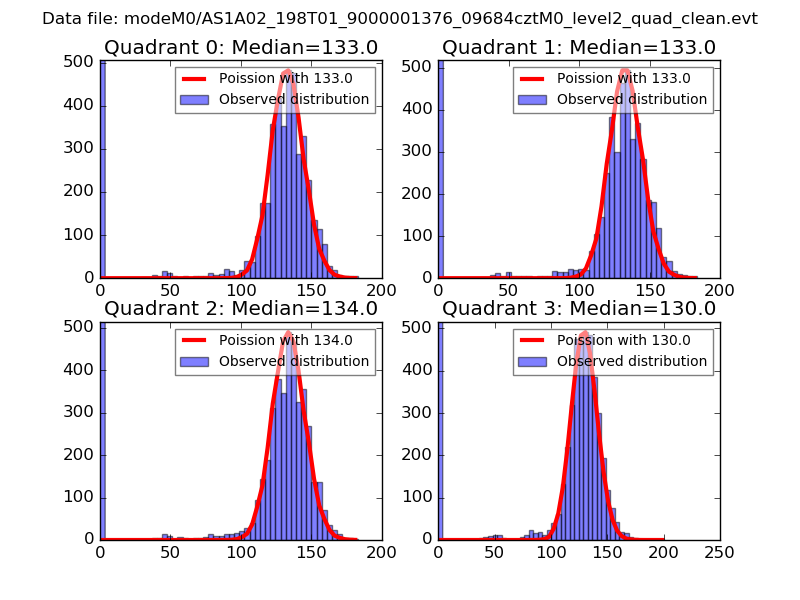 |
 |
| Quadrant-wise count rates Data is divided into 100 sec bins |
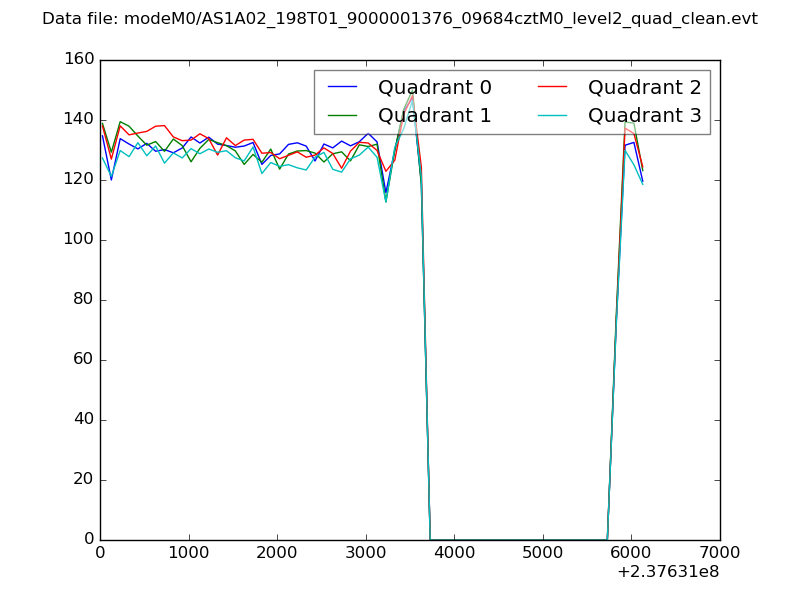 |
|
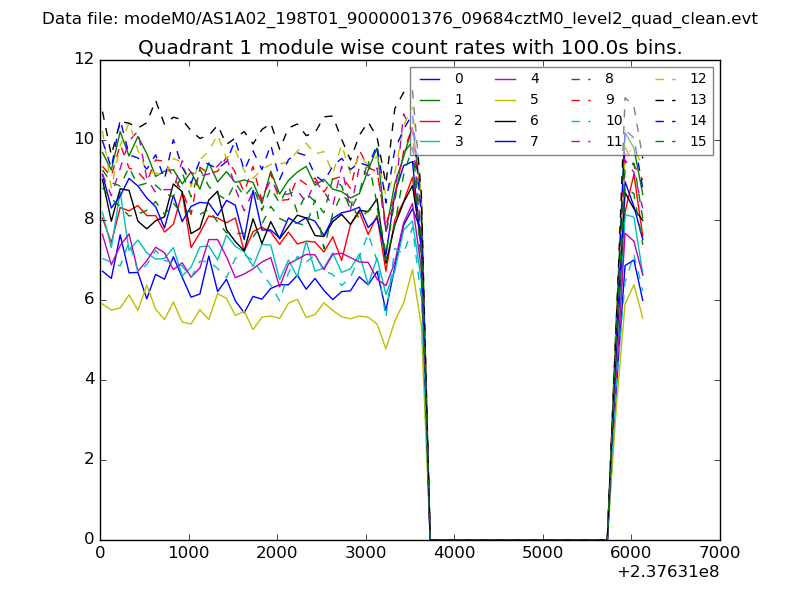
| Module-wise count rates for Quadrant A Data is divided into 100 sec bins |
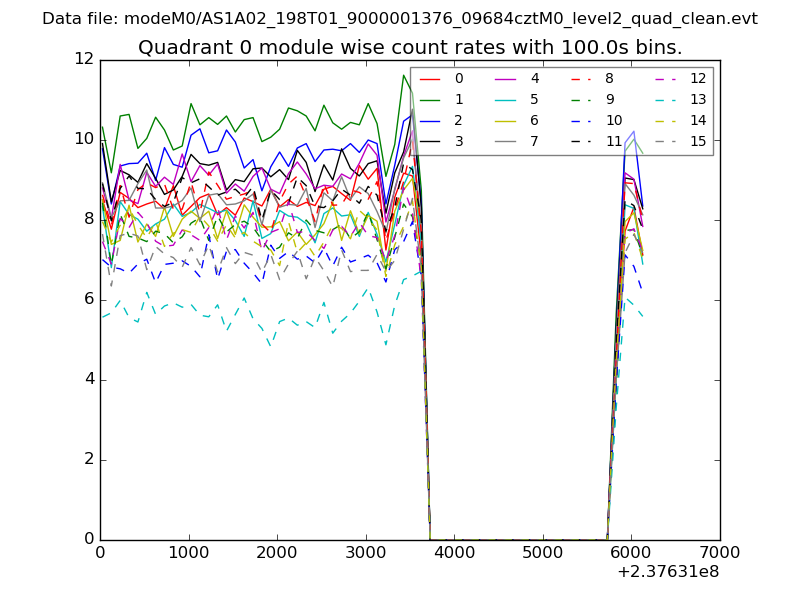 |
 |
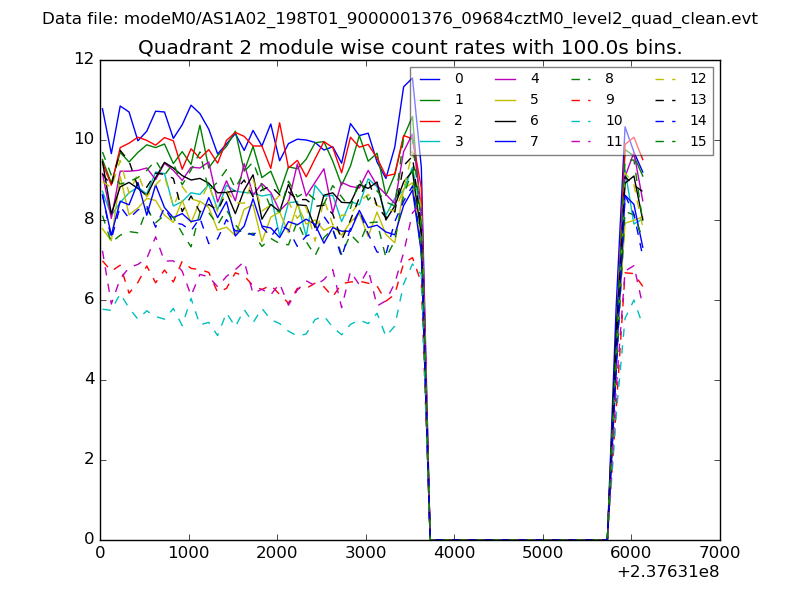
| Module-wise count rates for Quadrant B Data is divided into 100 sec bins |
 |
 |
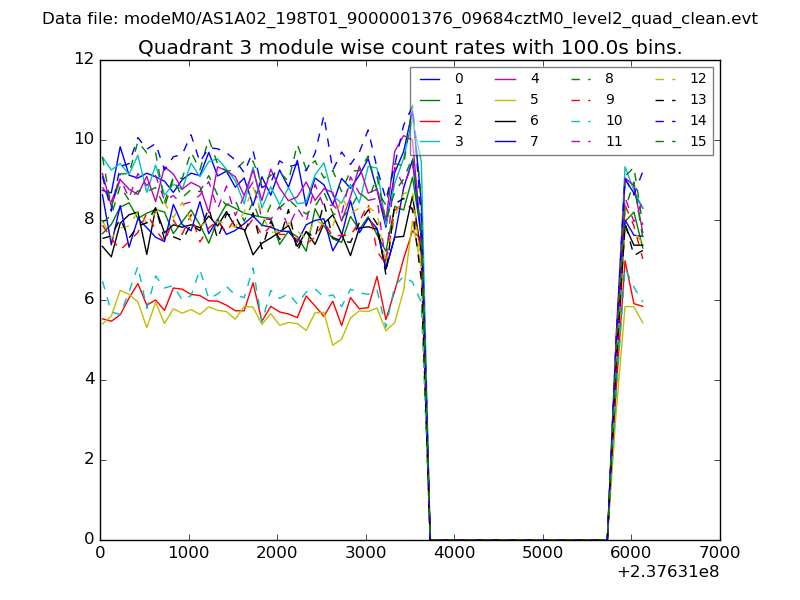
| Module-wise count rates for Quadrant C Data is divided into 100 sec bins |
 |
 |
| Module-wise count rates for Quadrant D Data is divided into 100 sec bins |
 |
 |
| Parameter | Plot |
|---|---|
| CZT HV Monitor | 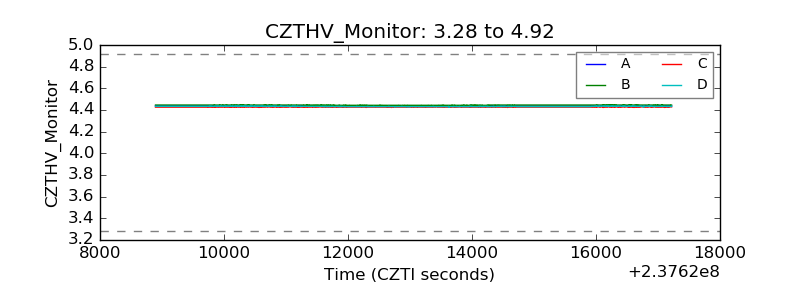 |
| D_VDD | 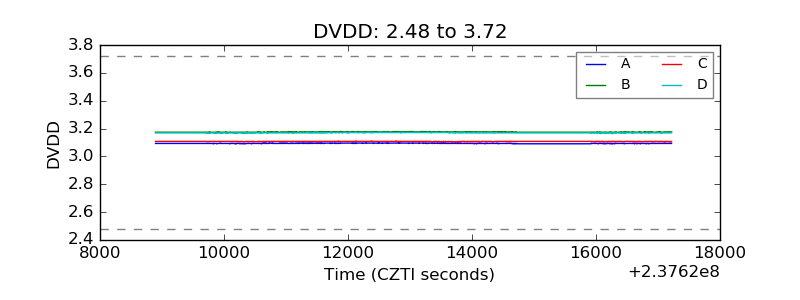 |
| Temperature 1 | 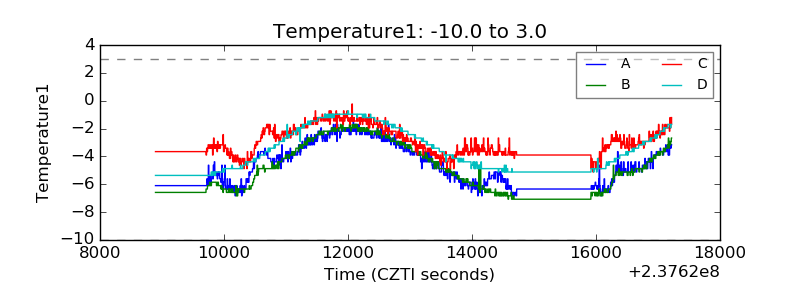 |
| Veto HV Monitor | 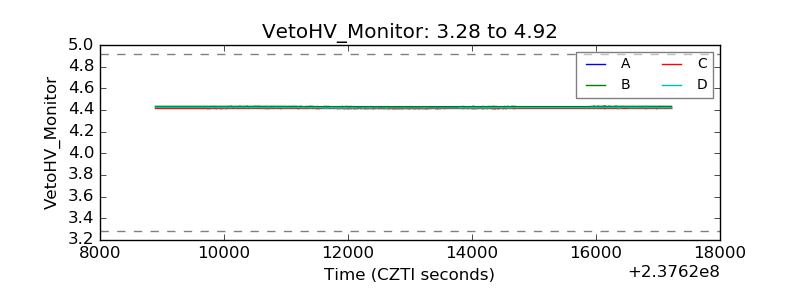 |
| Veto LLD | 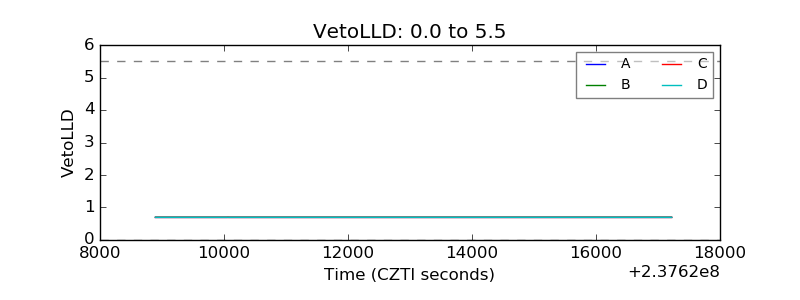 |
| Alpha Counter | 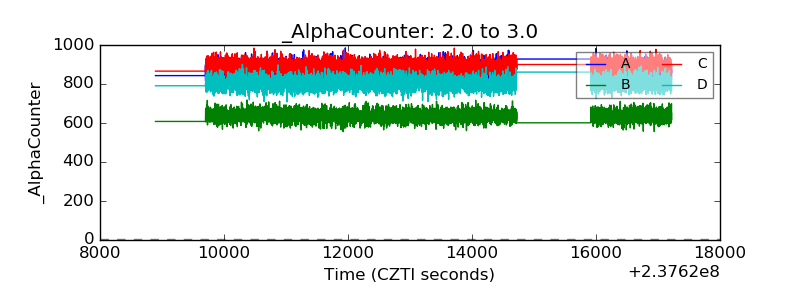 |
| _CPM_Rate | 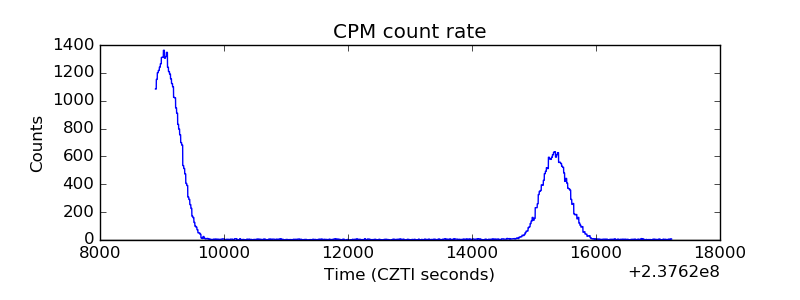 |
| CZT Counter |  |
| +2.5 Volts monitor |  |
| +5 Volts monitor |  |
| _ROLL_ROT | 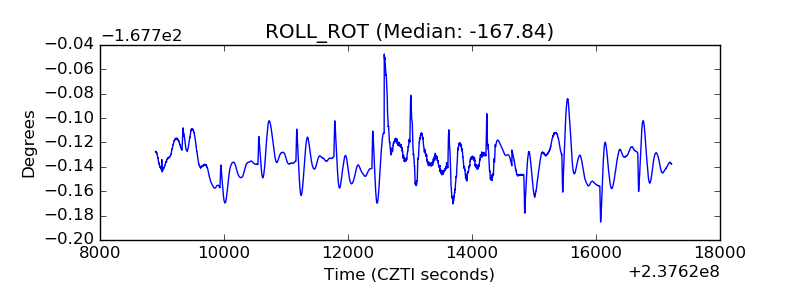 |
| _Roll_DEC | 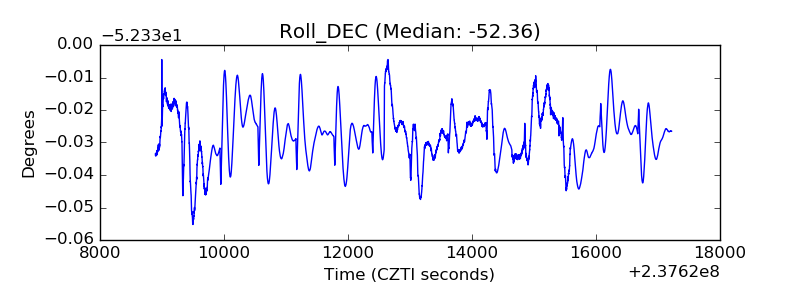 |
| _Roll_RA | 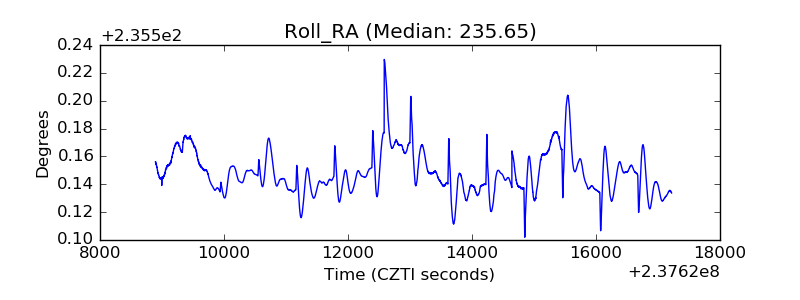 |
| Veto Counter | 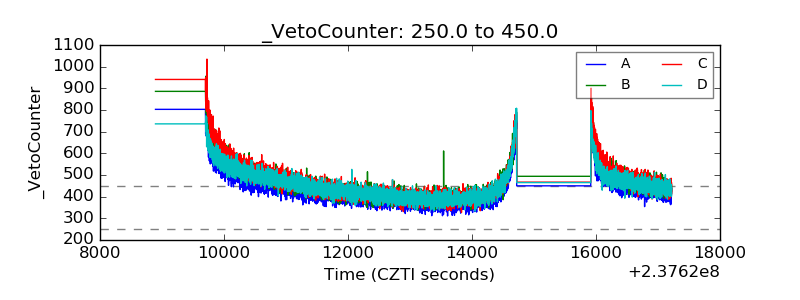 |