| Param | Original file | Final file |
|---|---|---|
| Filename | modeM0/AS1A02_198T01_9000001376_09685cztM0_level2.evt | modeM0/AS1A02_198T01_9000001376_09685cztM0_level2_quad_clean.evt |
| Size (bytes) | 387,688,320 | 86,532,480 |
| Size | 369.7 MB | 82.5 MB |
| Events in quadrant A | 2,692,498 | 560,302 |
| Events in quadrant B | 2,777,894 | 561,694 |
| Events in quadrant C | 2,672,403 | 559,734 |
| Events in quadrant D | 3,212,970 | 543,499 |
| Mode M9 | |||
|---|---|---|---|
| Quadrant | BADHDUFLAG | Total packets | Discarded packets |
| A | 0 | 16 | 1 |
| B | 0 | 16 | 1 |
| C | 0 | 16 | 2 |
| D | 0 | 17 | 2 |
| Mode SS | |||
|---|---|---|---|
| Quadrant | BADHDUFLAG | Total packets | Discarded packets |
| A | 0 | 134 | 20 |
| B | 0 | 134 | 12 |
| C | 0 | 134 | 22 |
| D | 0 | 134 | 22 |
| Mode M0 | |||
|---|---|---|---|
| Quadrant | BADHDUFLAG | Total packets | Discarded packets |
| A | 0 | 13642 | 2008 |
| B | 0 | 13867 | 2111 |
| C | 0 | 13822 | 2045 |
| D | 0 | 15371 | 2266 |
| Quadrant | Total seconds | Saturated seconds | Saturation percentage |
|---|---|---|---|
| A | 5668 | 84 | 1.482004% |
| B | 5630 | 89 | 1.580817% |
| C | 5662 | 60 | 1.059696% |
| D | 5627 | 100 | 1.777146% |
Noise dominated data is calculated using 1-second bins in cleaned event files. If a bin has >2000 counts, and if more than 50% of those come from <1% of pixels, then it is considered to be noise-dominated and hence unusable.
| Quadrant | # 1 sec bins | Bins with >0 counts | Bins with >2000 counts | High rate bins dominated by noise | Noise dominated (total time) | Noise dominated (detector-on time) | Marked lightcurve |
|---|---|---|---|---|---|---|---|
| A | 7659 | 6075 | 0 | 0 | 0.00% | 0.00% |  |
| B | 7659 | 6051 | 0 | 0 | 0.00% | 0.00% | 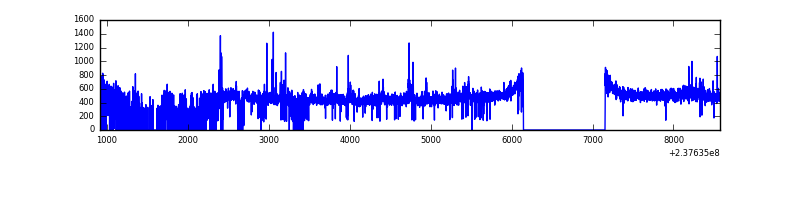 |
| C | 7659 | 6097 | 0 | 0 | 0.00% | 0.00% | 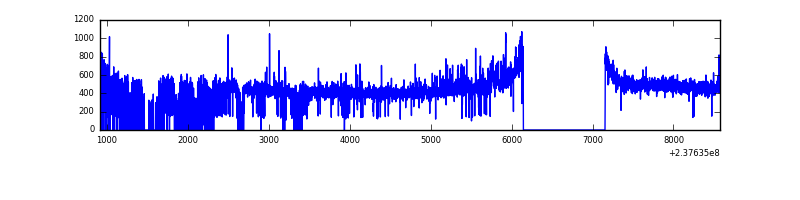 |
| D | 7657 | 6032 | 18 | 18 | 0.24% | 0.30% | 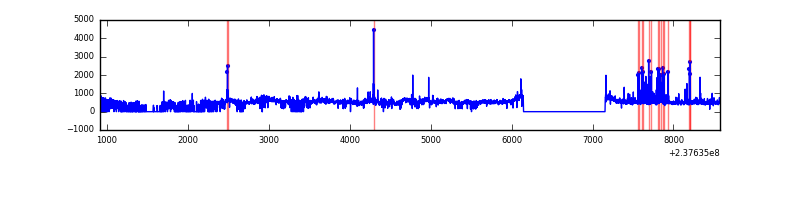 |
Top three noisy pixels from each quadrant. If the there are fewer than three noisy pixels in the level2.evt file, extra rows are filled as -1
| Pixel properties | Quadrant properties | ||||||
|---|---|---|---|---|---|---|---|
| Quadrant | DetID | PixID | Counts | Sigma | Mean | Median | Sigma |
| A | 13 | 252 | 20784 | 143.56 | 690 | 675 | 140.1 |
| A | 15 | 174 | 8999 | 59.42 | 690 | 675 | 140.1 |
| A | 0 | 226 | 6401 | 40.88 | 690 | 675 | 140.1 |
| B | 10 | 245 | 30102 | 226.36 | 682 | 667 | 130.0 |
| B | 0 | 187 | 24700 | 184.82 | 682 | 667 | 130.0 |
| B | 0 | 229 | 20549 | 152.9 | 682 | 667 | 130.0 |
| C | 9 | 68 | 61936 | 397.93 | 667 | 672 | 154.0 |
| C | 14 | 67 | 8587 | 51.41 | 667 | 672 | 154.0 |
| C | 13 | 61 | 5067 | 28.55 | 667 | 672 | 154.0 |
| D | 8 | 195 | 341396 | 2119.3 | 661 | 644 | 160.8 |
| D | 1 | 52 | 180481 | 1118.49 | 661 | 644 | 160.8 |
| D | 7 | 46 | 81544 | 503.16 | 661 | 644 | 160.8 |
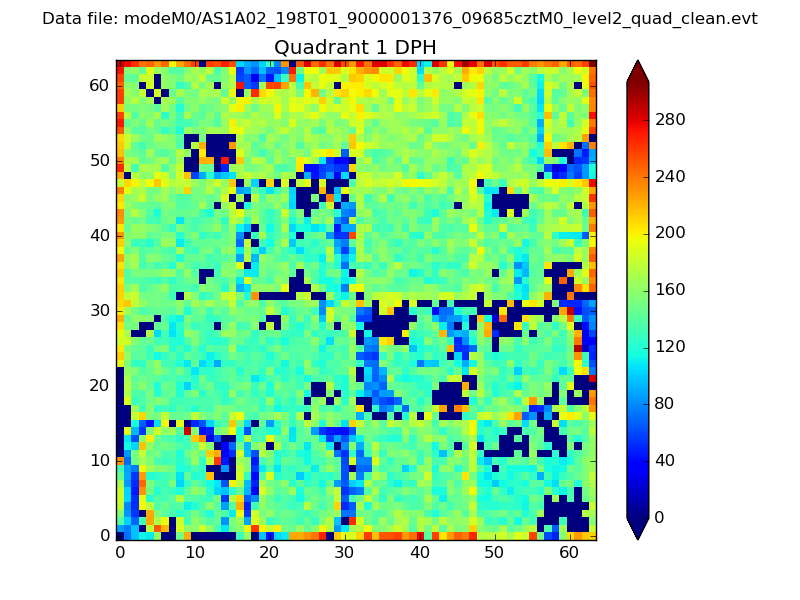
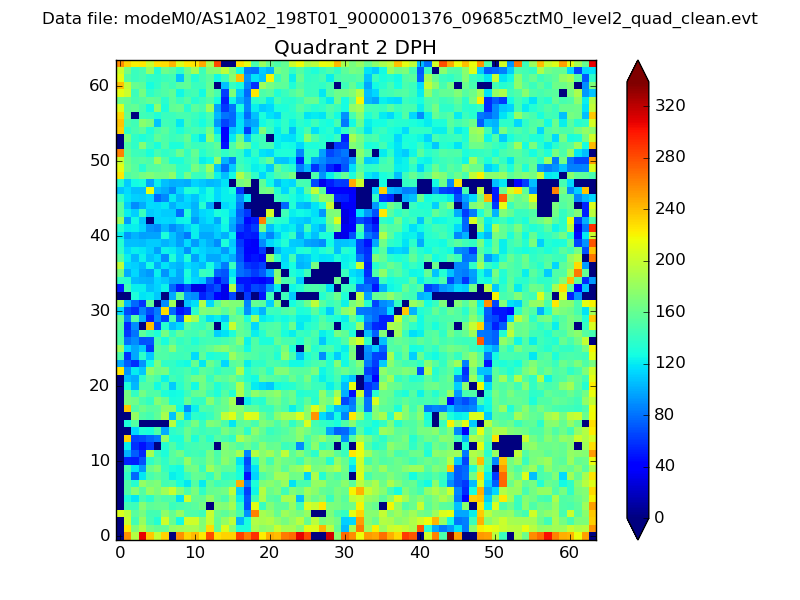
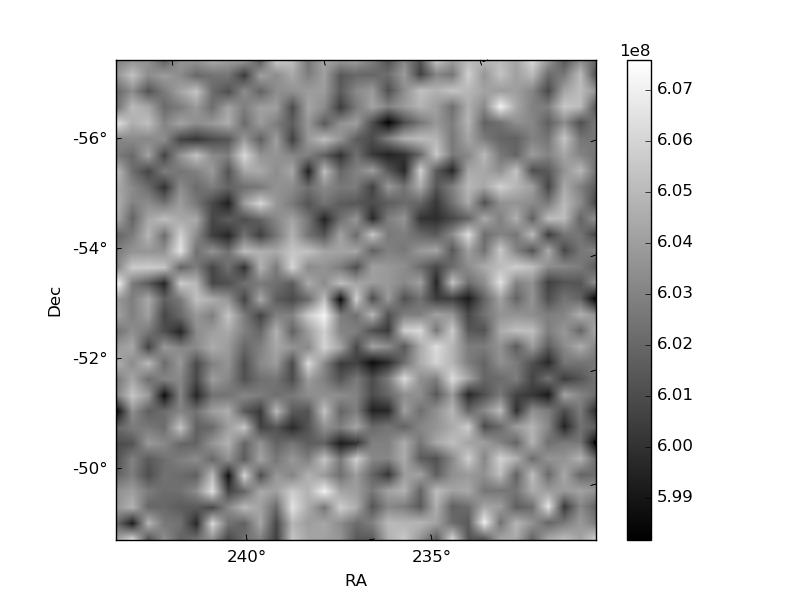
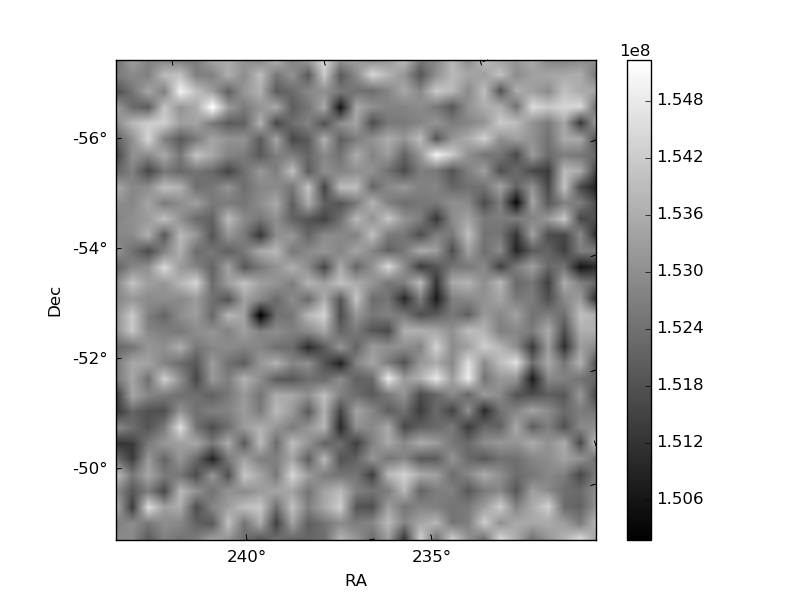
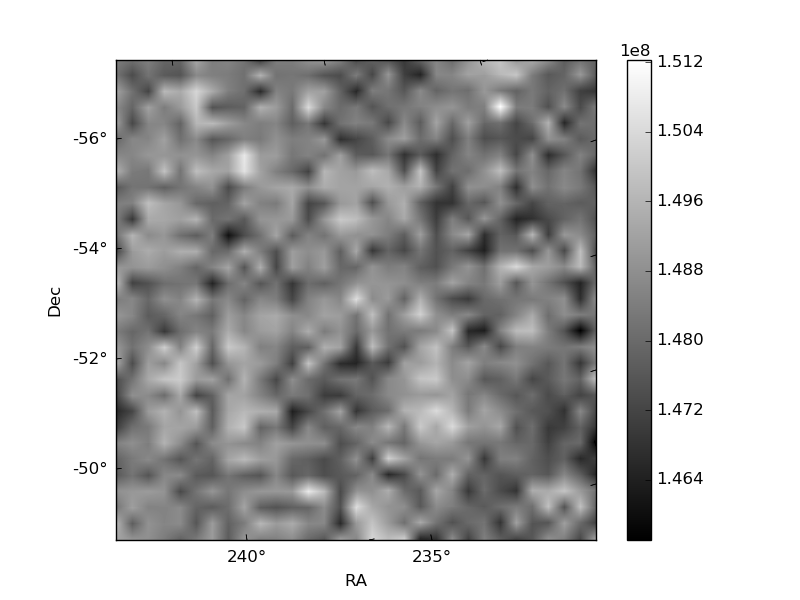
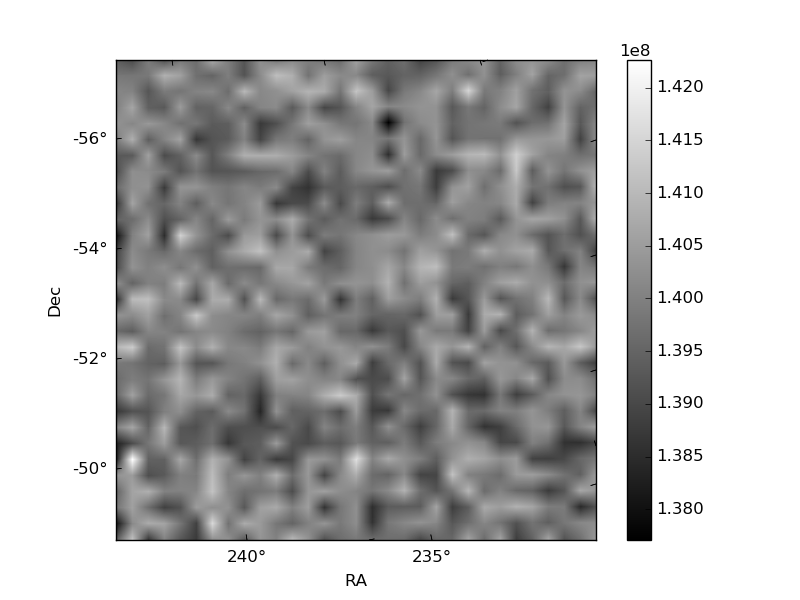
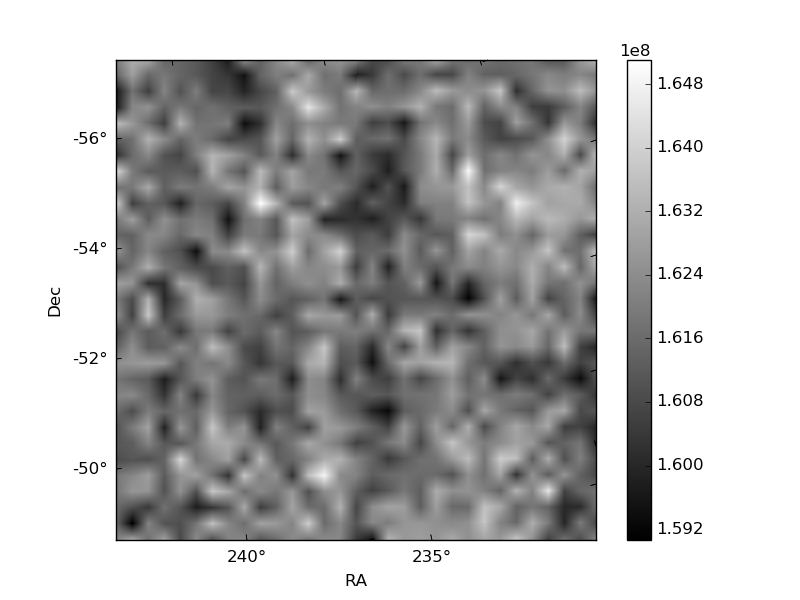
Histogram calculated using DETX and DETY for each event in the final _common_clean file
| Quadrant A | 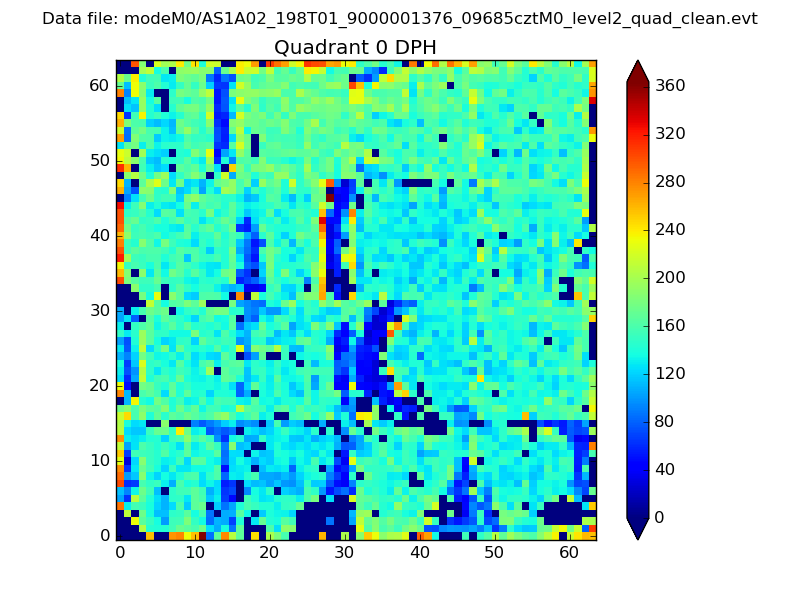 |
 |
Quadrant B |
|---|---|---|---|
| Quadrant D | 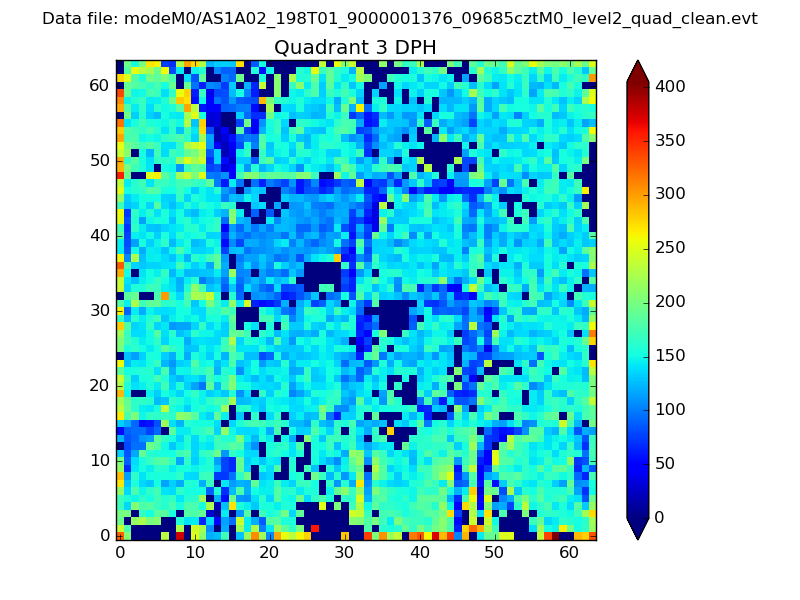 |
 |
Quadrant C |
| Plot type | Count rate plots | Images |
|---|---|---|
| Comparison with Poisson distribution Blue bars denote a histogram of data divided into 1 sec bins. Red curve is a Poisson curve with rate = median count rate of data. |
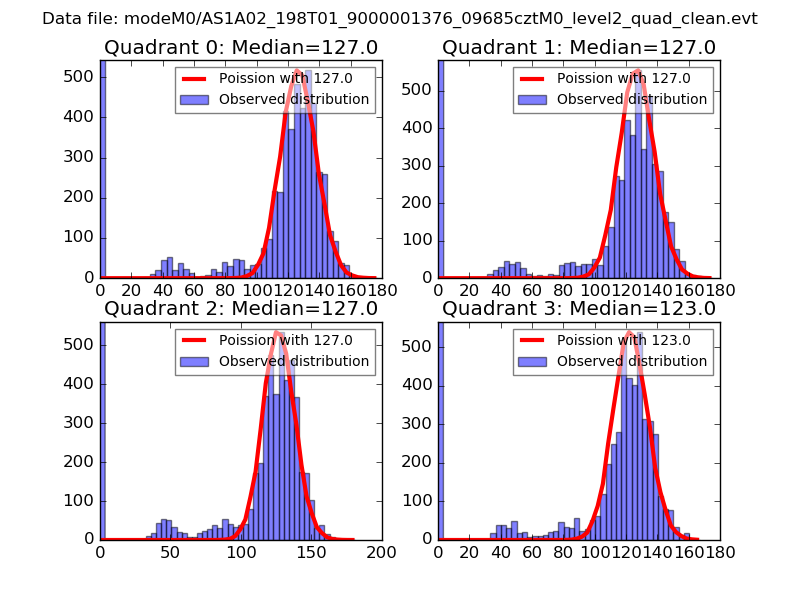 |
 |
| Quadrant-wise count rates Data is divided into 100 sec bins |
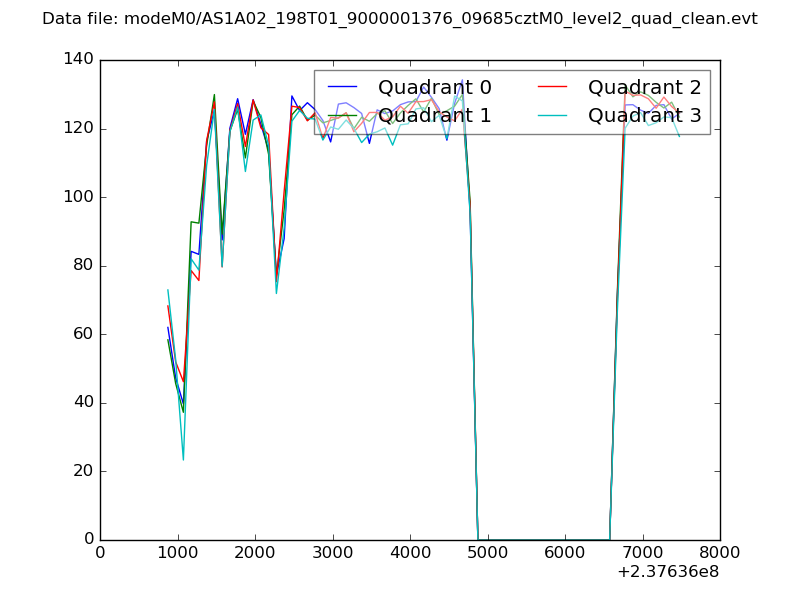 |
|
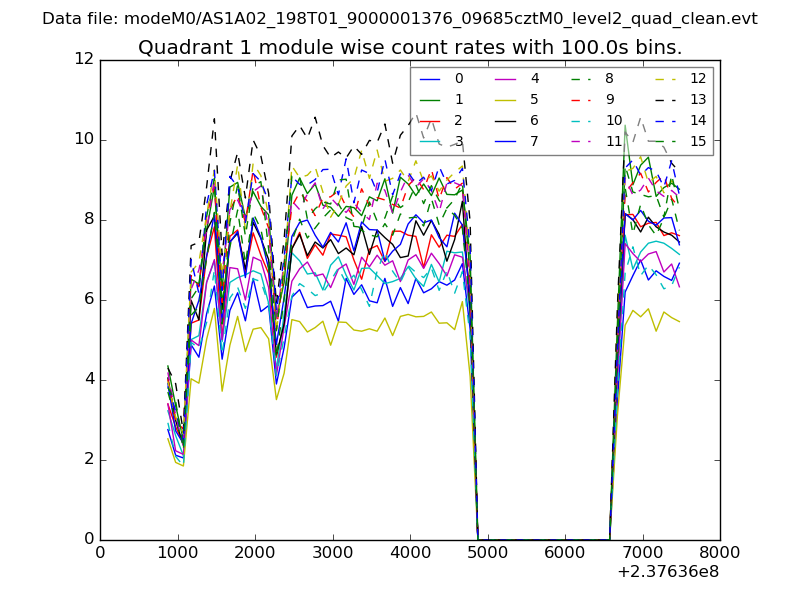
| Module-wise count rates for Quadrant A Data is divided into 100 sec bins |
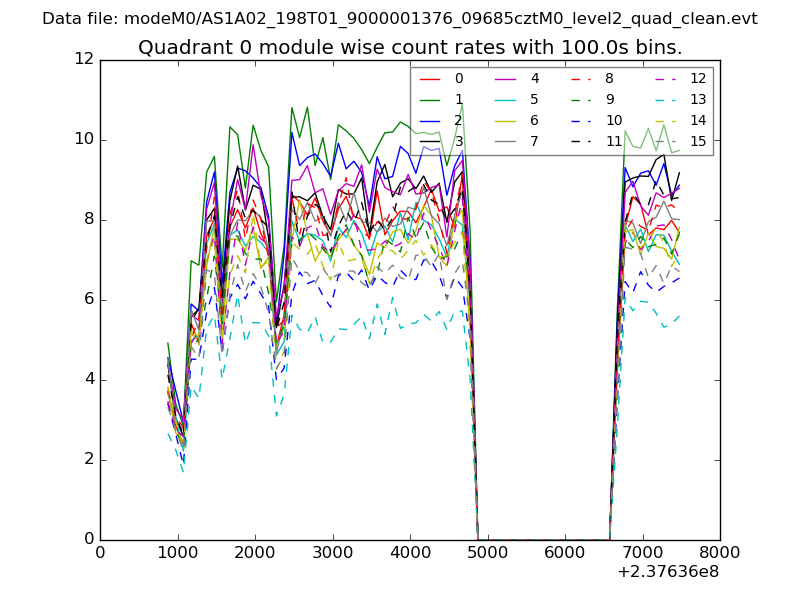 |
 |
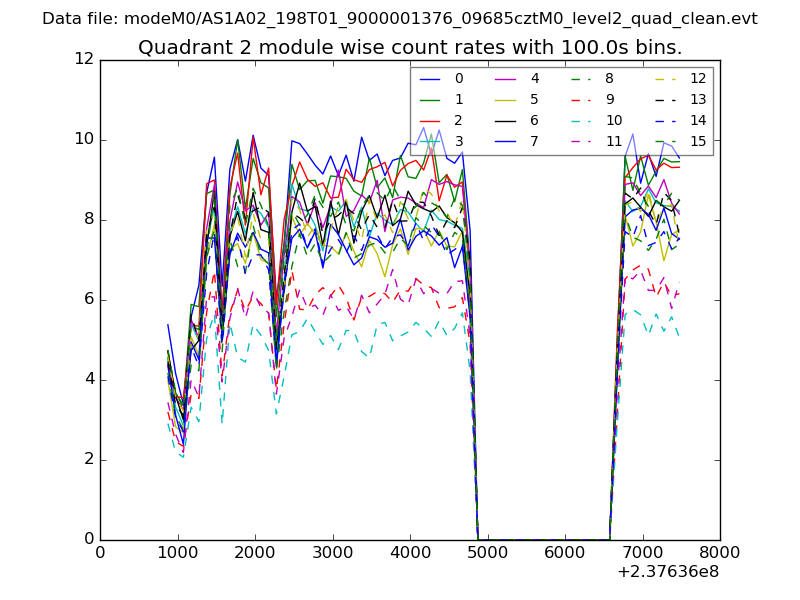
| Module-wise count rates for Quadrant B Data is divided into 100 sec bins |
 |
 |
| Module-wise count rates for Quadrant C Data is divided into 100 sec bins |
 |
 |
| Module-wise count rates for Quadrant D Data is divided into 100 sec bins |
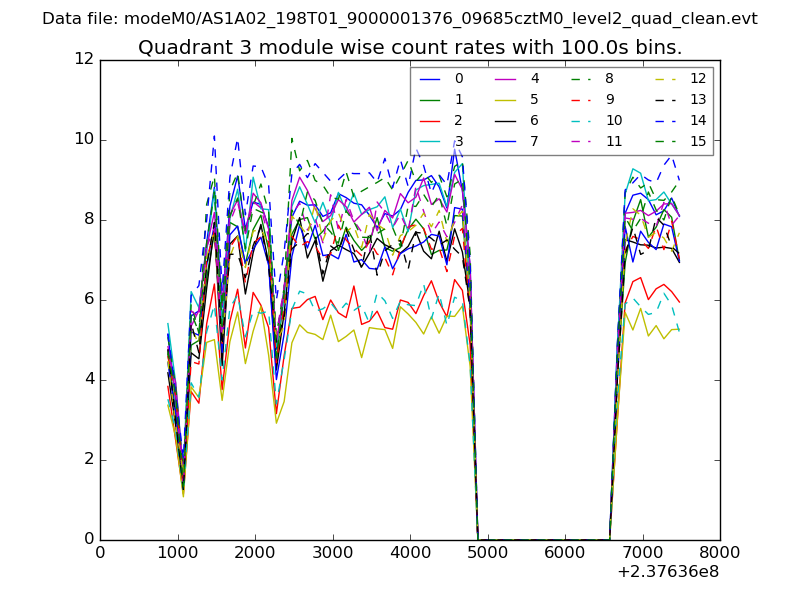 |
 |
| Parameter | Plot |
|---|---|
| CZT HV Monitor | 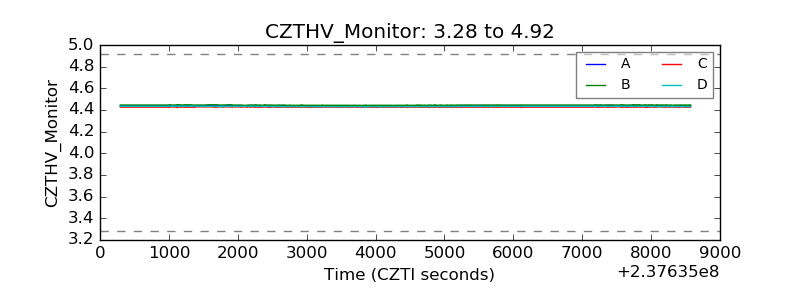 |
| D_VDD | 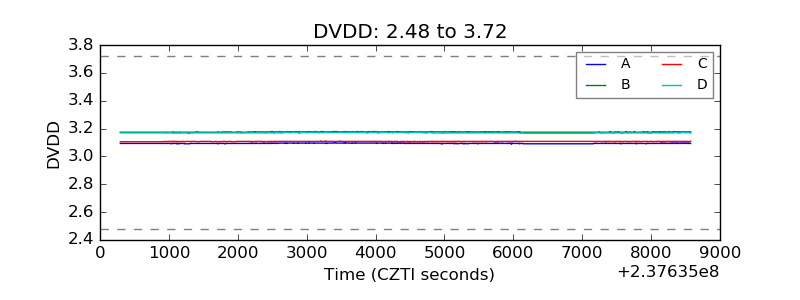 |
| Temperature 1 | 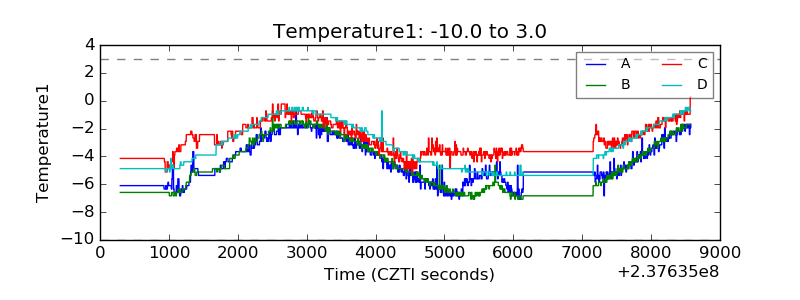 |
| Veto HV Monitor |  |
| Veto LLD | 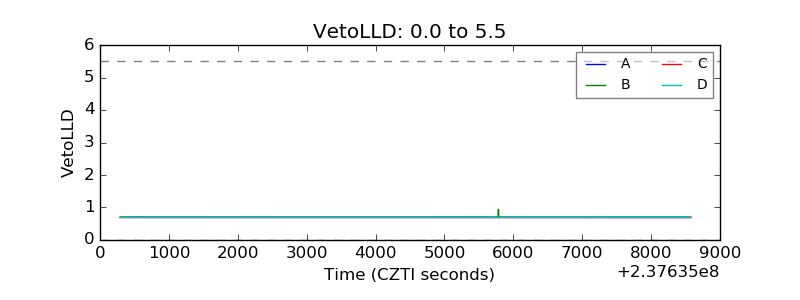 |
| Alpha Counter | 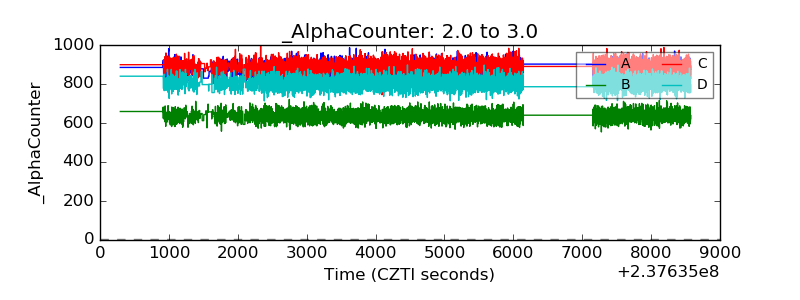 |
| _CPM_Rate | 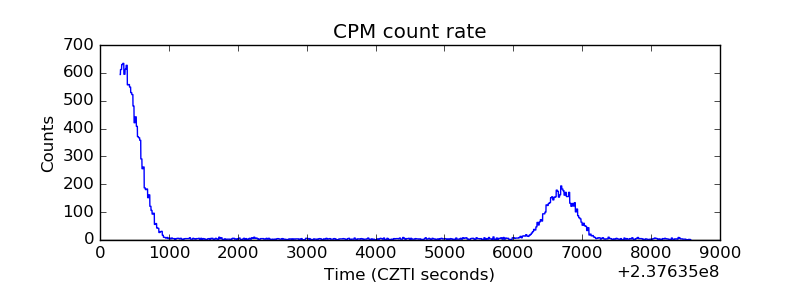 |
| CZT Counter | 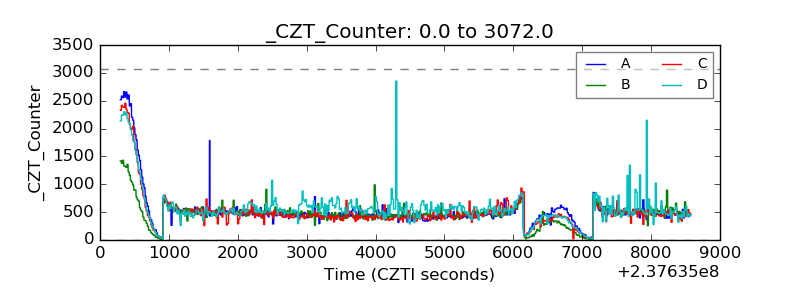 |
| +2.5 Volts monitor |  |
| +5 Volts monitor |  |
| _ROLL_ROT | 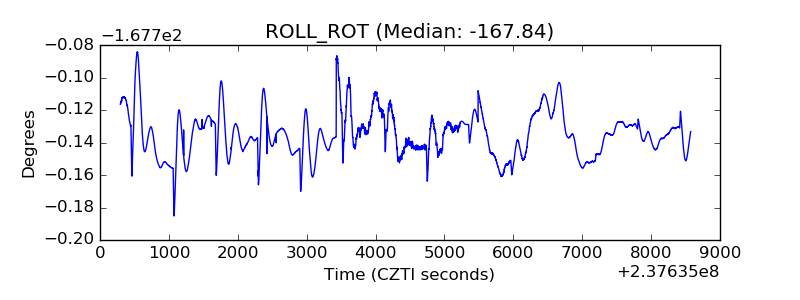 |
| _Roll_DEC | 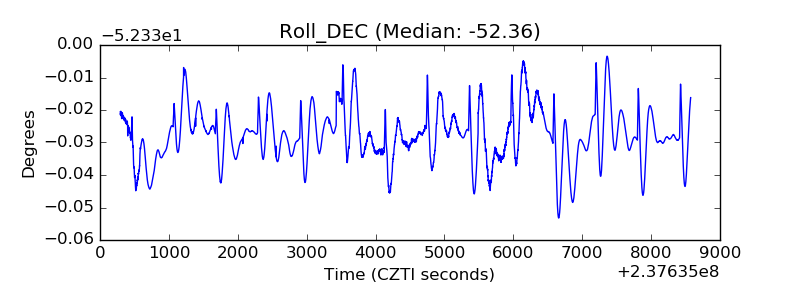 |
| _Roll_RA | 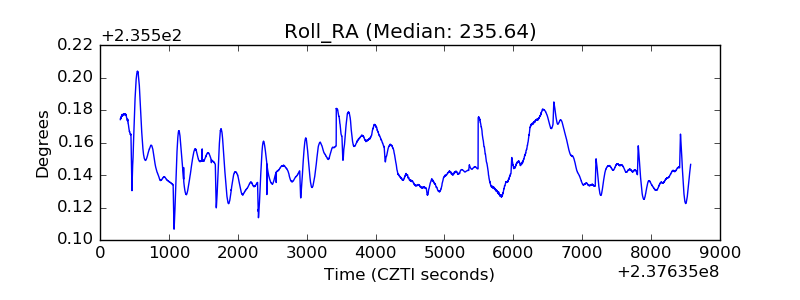 |
| Veto Counter | 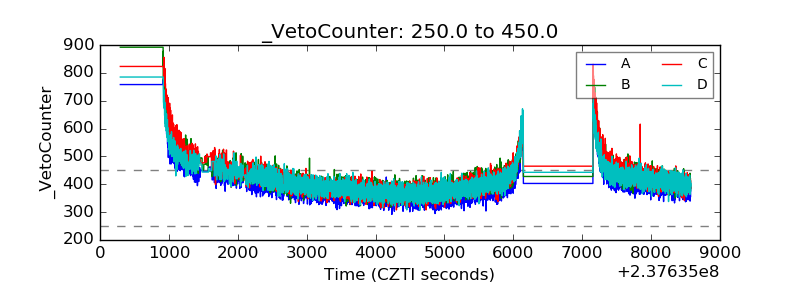 |