| Param | Original file | Final file |
|---|---|---|
| Filename | modeM0/AS1A02_198T01_9000001376_09686cztM0_level2.evt | modeM0/AS1A02_198T01_9000001376_09686cztM0_level2_quad_clean.evt |
| Size (bytes) | 482,117,760 | 119,854,080 |
| Size | 459.8 MB | 114.3 MB |
| Events in quadrant A | 3,283,636 | 789,522 |
| Events in quadrant B | 3,439,106 | 791,745 |
| Events in quadrant C | 3,214,535 | 791,641 |
| Events in quadrant D | 4,182,566 | 764,049 |
| Mode M9 | |||
|---|---|---|---|
| Quadrant | BADHDUFLAG | Total packets | Discarded packets |
| A | 0 | 10 | 0 |
| B | 0 | 10 | 0 |
| C | 0 | 10 | 0 |
| D | 0 | 10 | 0 |
| Mode SS | |||
|---|---|---|---|
| Quadrant | BADHDUFLAG | Total packets | Discarded packets |
| A | 0 | 144 | 0 |
| B | 0 | 144 | 2 |
| C | 0 | 144 | 0 |
| D | 0 | 144 | 0 |
| Mode M0 | |||
|---|---|---|---|
| Quadrant | BADHDUFLAG | Total packets | Discarded packets |
| A | 0 | 14483 | 33 |
| B | 0 | 14759 | 35 |
| C | 0 | 14609 | 25 |
| D | 0 | 17129 | 76 |
| Quadrant | Total seconds | Saturated seconds | Saturation percentage |
|---|---|---|---|
| A | 7085 | 72 | 1.016231% |
| B | 7085 | 77 | 1.086803% |
| C | 7089 | 47 | 0.662999% |
| D | 7074 | 98 | 1.385355% |
Noise dominated data is calculated using 1-second bins in cleaned event files. If a bin has >2000 counts, and if more than 50% of those come from <1% of pixels, then it is considered to be noise-dominated and hence unusable.
| Quadrant | # 1 sec bins | Bins with >0 counts | Bins with >2000 counts | High rate bins dominated by noise | Noise dominated (total time) | Noise dominated (detector-on time) | Marked lightcurve |
|---|---|---|---|---|---|---|---|
| A | 8111 | 7102 | 0 | 0 | 0.00% | 0.00% |  |
| B | 8111 | 7101 | 1 | 1 | 0.01% | 0.01% | 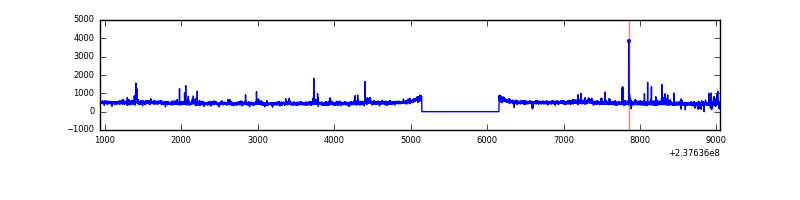 |
| C | 8111 | 7102 | 0 | 0 | 0.00% | 0.00% | 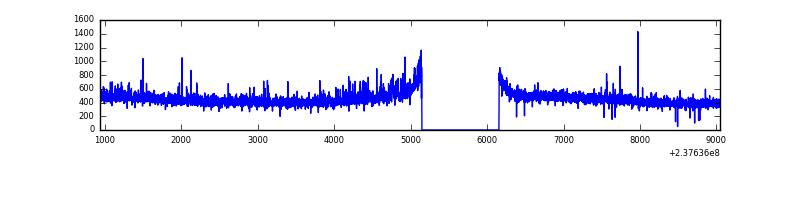 |
| D | 8111 | 7101 | 33 | 33 | 0.41% | 0.46% | 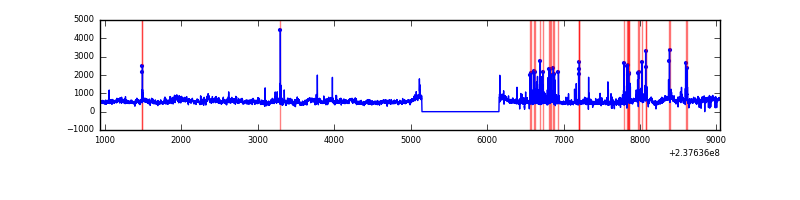 |
Top three noisy pixels from each quadrant. If the there are fewer than three noisy pixels in the level2.evt file, extra rows are filled as -1
| Pixel properties | Quadrant properties | ||||||
|---|---|---|---|---|---|---|---|
| Quadrant | DetID | PixID | Counts | Sigma | Mean | Median | Sigma |
| A | 15 | 174 | 23138 | 131.71 | 839 | 821 | 169.4 |
| A | 13 | 252 | 21626 | 122.78 | 839 | 821 | 169.4 |
| A | 0 | 226 | 7905 | 41.81 | 839 | 821 | 169.4 |
| B | 10 | 245 | 50550 | 316.56 | 832 | 814 | 157.1 |
| B | 0 | 229 | 47399 | 296.5 | 832 | 814 | 157.1 |
| B | 0 | 187 | 29343 | 181.58 | 832 | 814 | 157.1 |
| C | 9 | 68 | 64840 | 345.55 | 805 | 811 | 185.3 |
| C | 14 | 67 | 8836 | 43.31 | 805 | 811 | 185.3 |
| C | 13 | 61 | 6119 | 28.65 | 805 | 811 | 185.3 |
| D | 8 | 195 | 604054 | 3003.64 | 805 | 784 | 200.8 |
| D | 1 | 52 | 249372 | 1237.7 | 805 | 784 | 200.8 |
| D | 7 | 46 | 128429 | 635.54 | 805 | 784 | 200.8 |
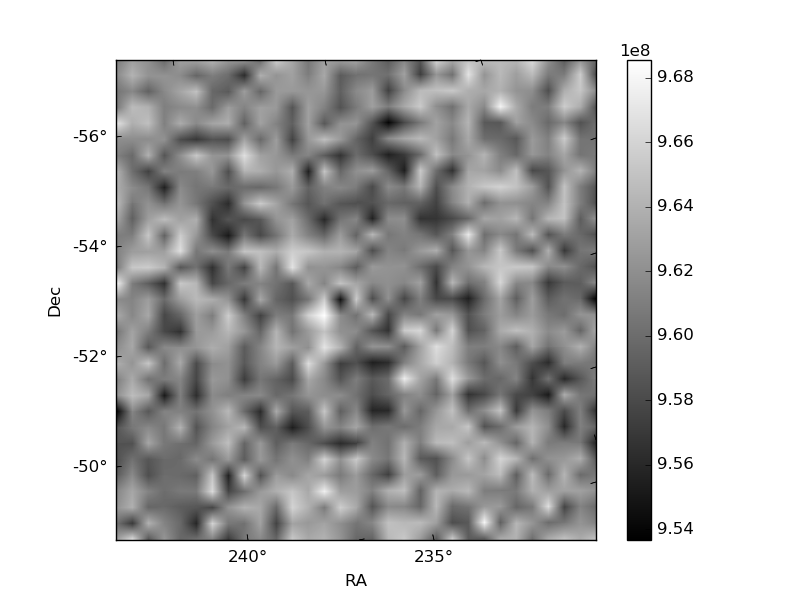
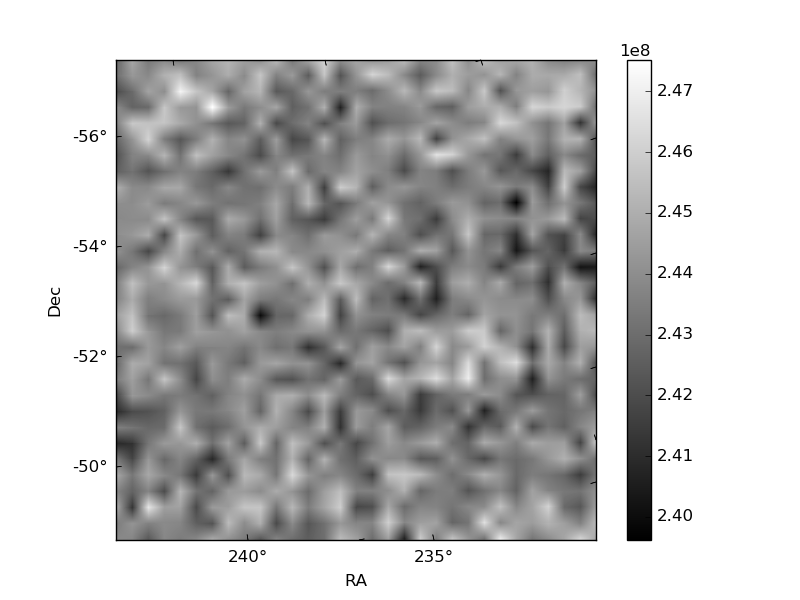
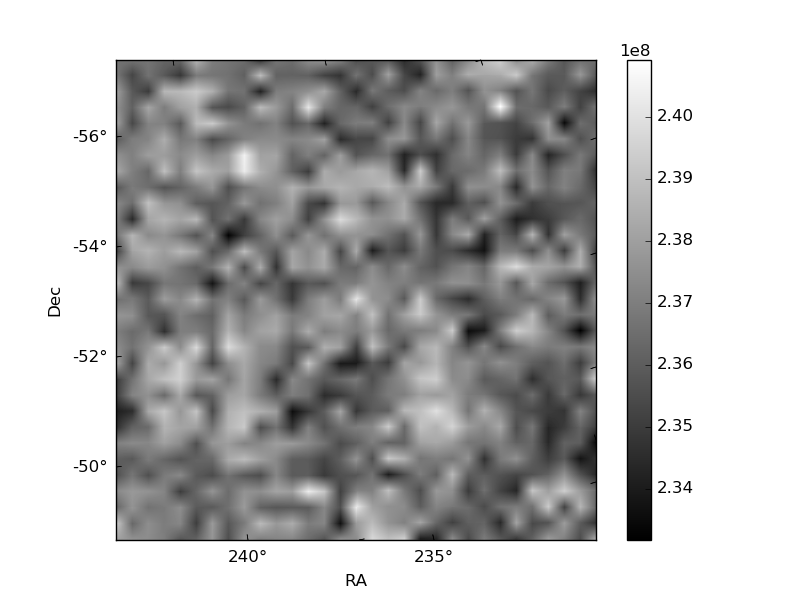
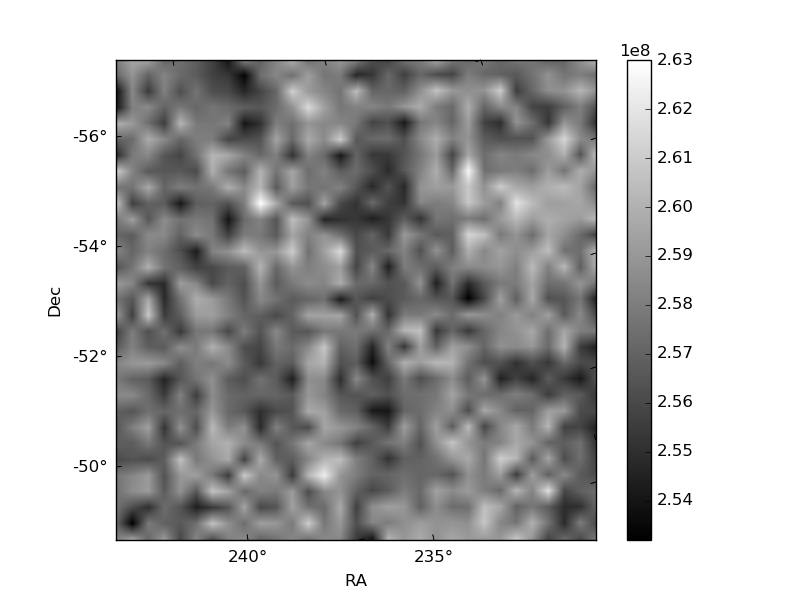
Histogram calculated using DETX and DETY for each event in the final _common_clean file
| Quadrant A | 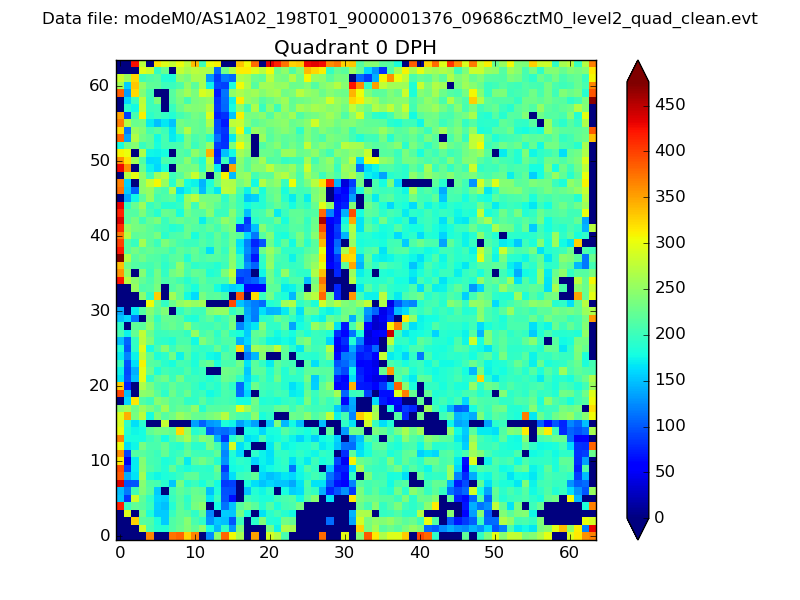 |
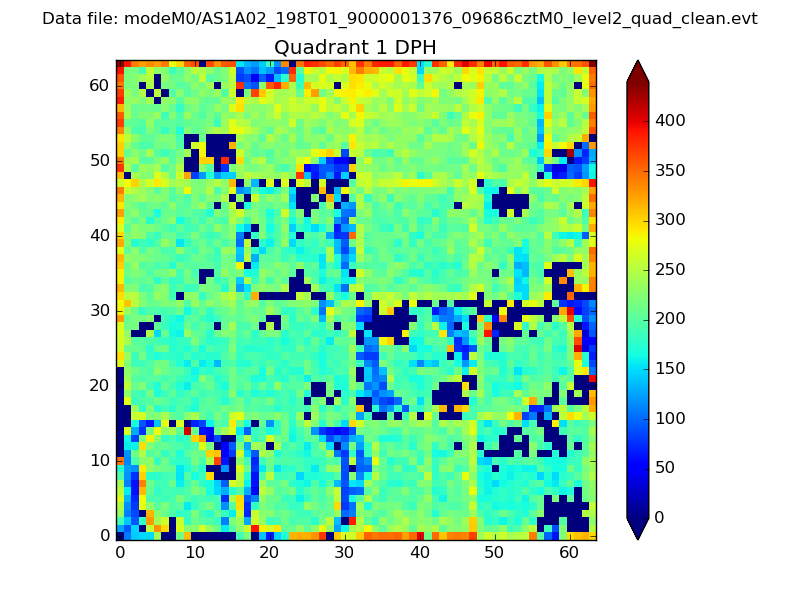 |
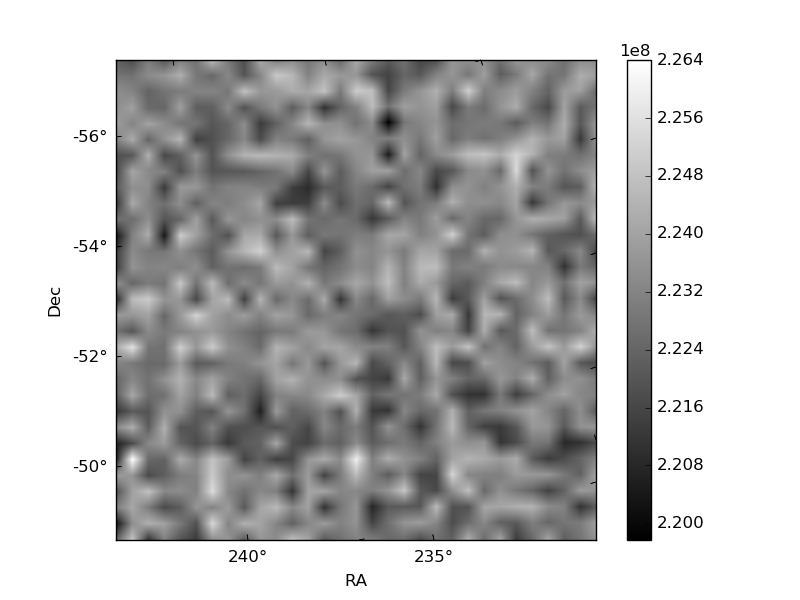
Quadrant B |
|---|---|---|---|
| Quadrant D | 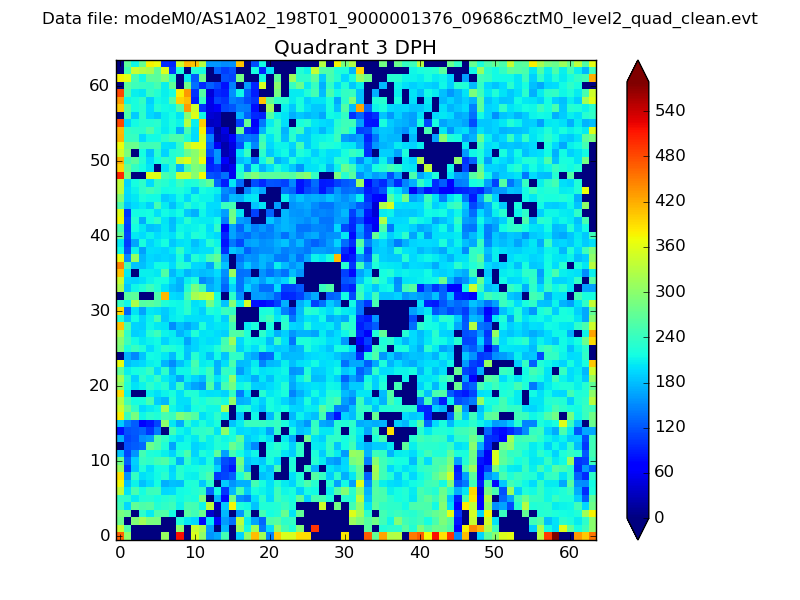 |
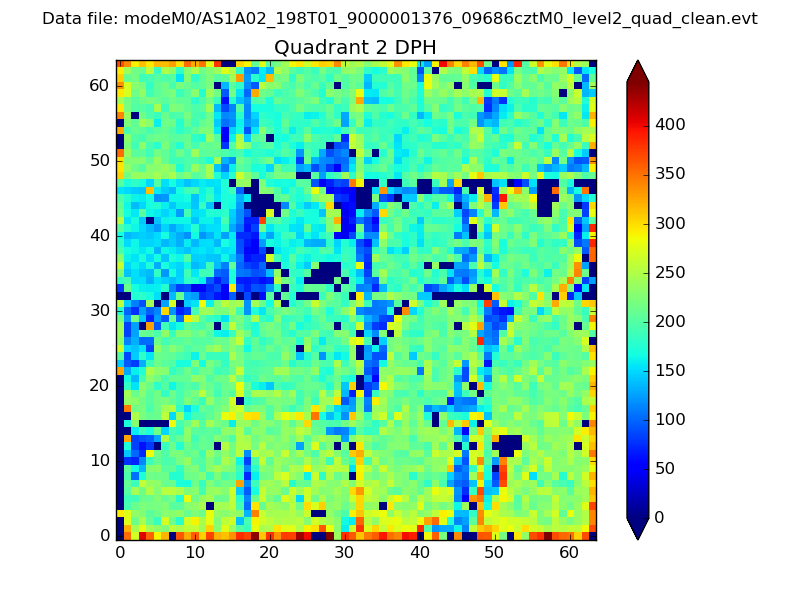 |
Quadrant C |
| Plot type | Count rate plots | Images |
|---|---|---|
| Comparison with Poisson distribution Blue bars denote a histogram of data divided into 1 sec bins. Red curve is a Poisson curve with rate = median count rate of data. |
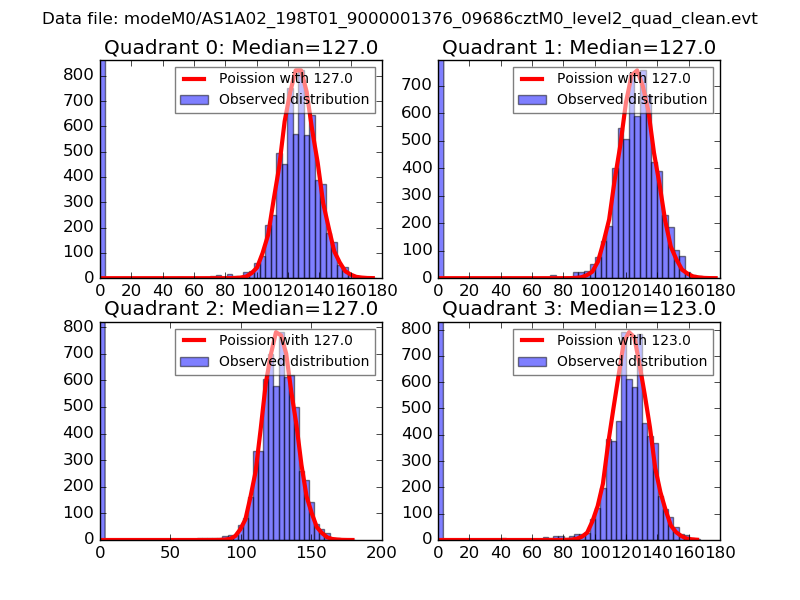 |
 |
| Quadrant-wise count rates Data is divided into 100 sec bins |
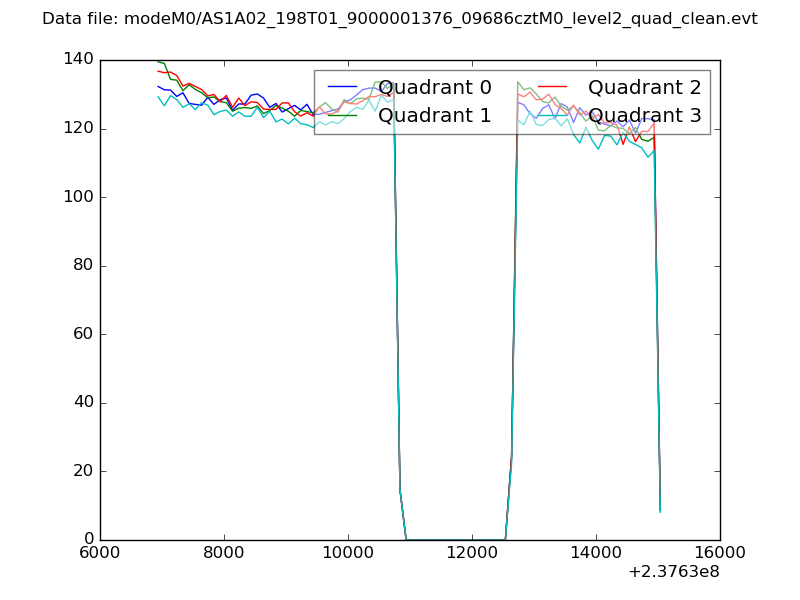 |
|
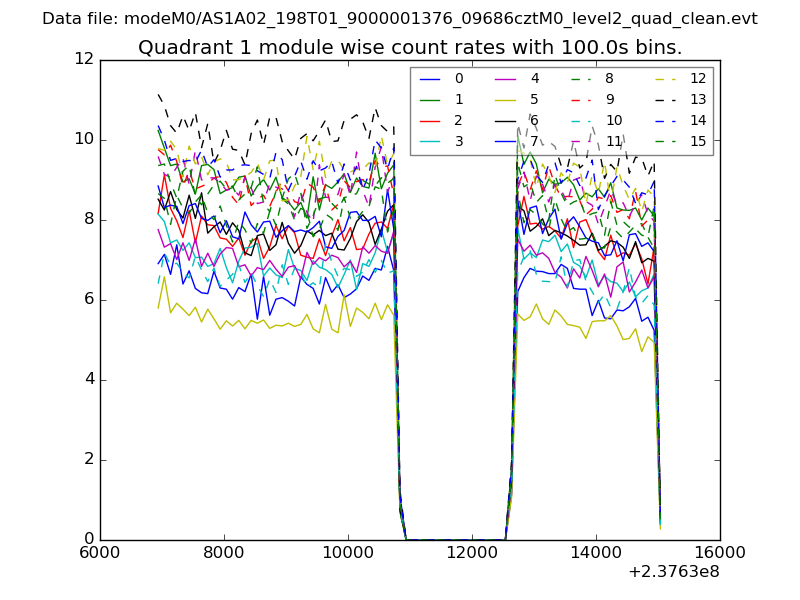
| Module-wise count rates for Quadrant A Data is divided into 100 sec bins |
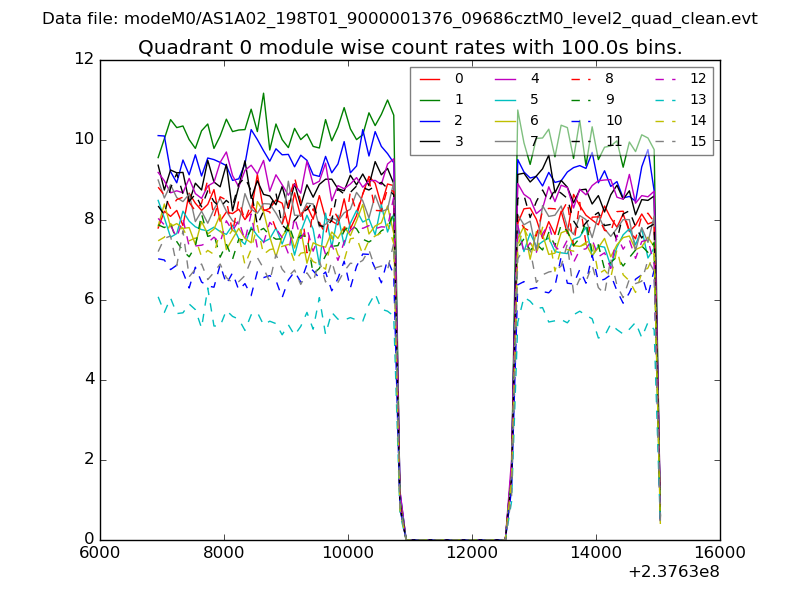 |
 |
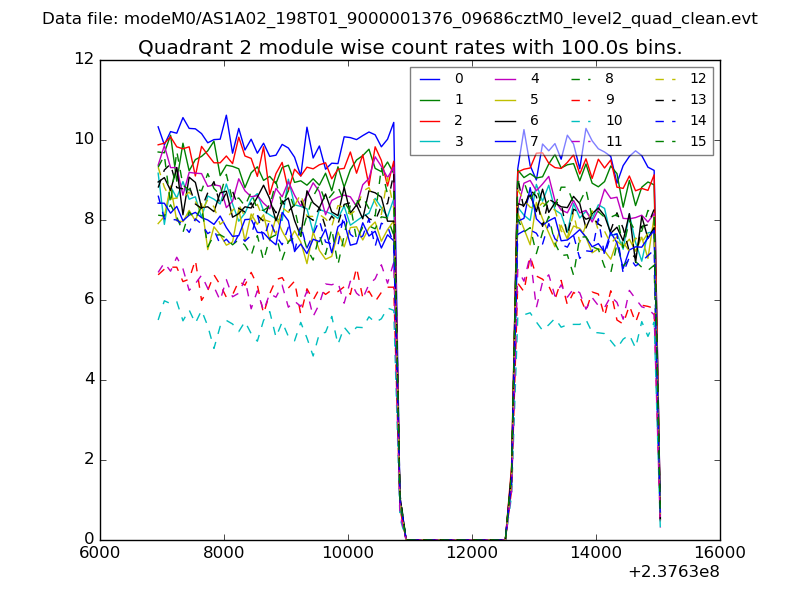
| Module-wise count rates for Quadrant B Data is divided into 100 sec bins |
 |
 |
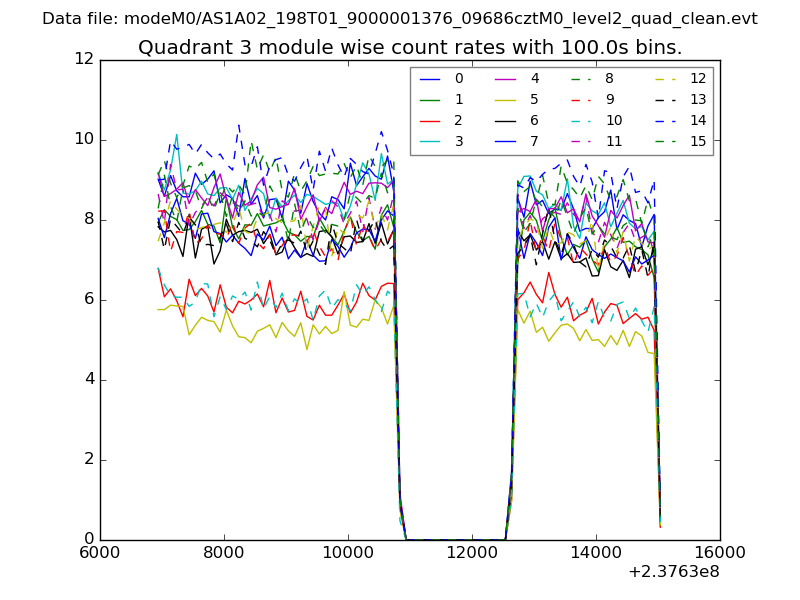
| Module-wise count rates for Quadrant C Data is divided into 100 sec bins |
 |
 |
| Module-wise count rates for Quadrant D Data is divided into 100 sec bins |
 |
 |
| Parameter | Plot |
|---|---|
| CZT HV Monitor |  |
| D_VDD | 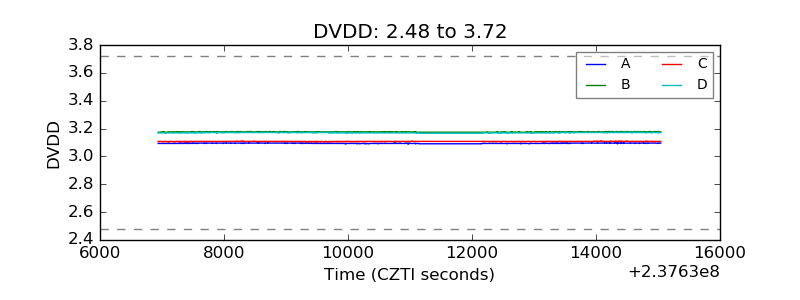 |
| Temperature 1 | 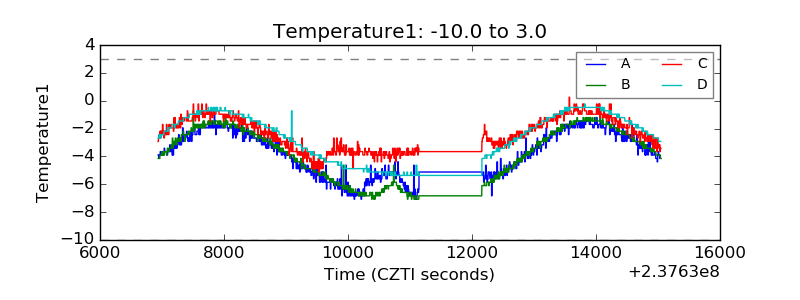 |
| Veto HV Monitor |  |
| Veto LLD | 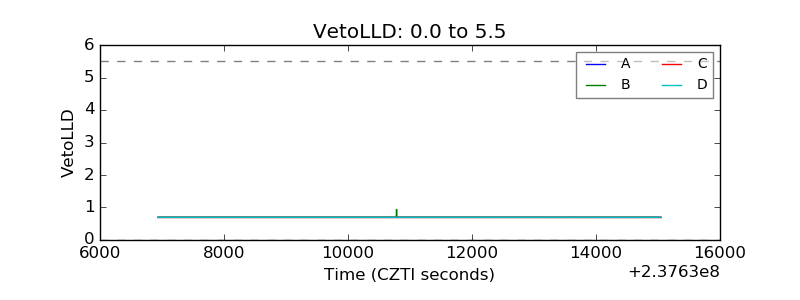 |
| Alpha Counter | 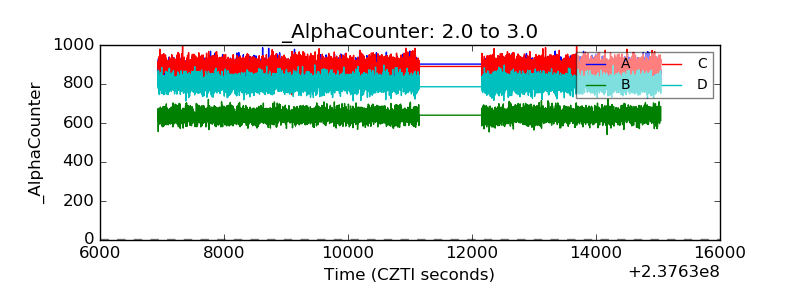 |
| _CPM_Rate | 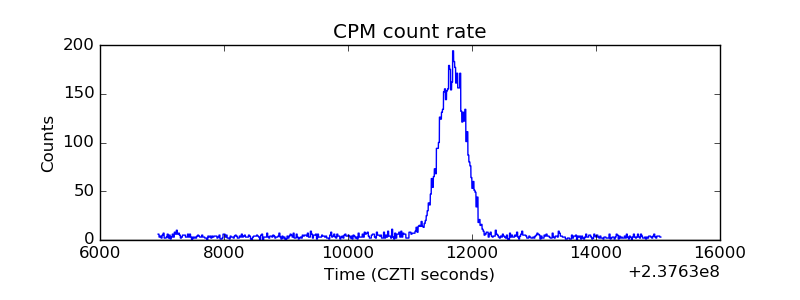 |
| CZT Counter | 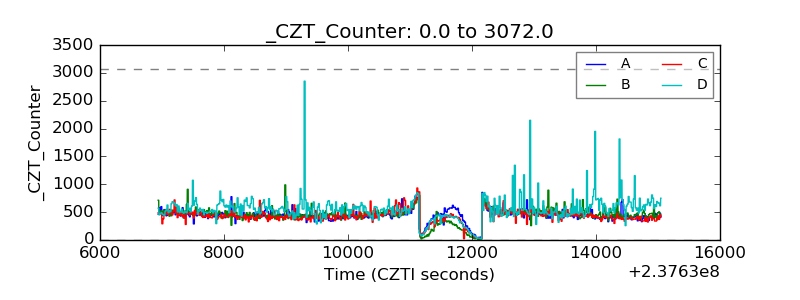 |
| +2.5 Volts monitor | 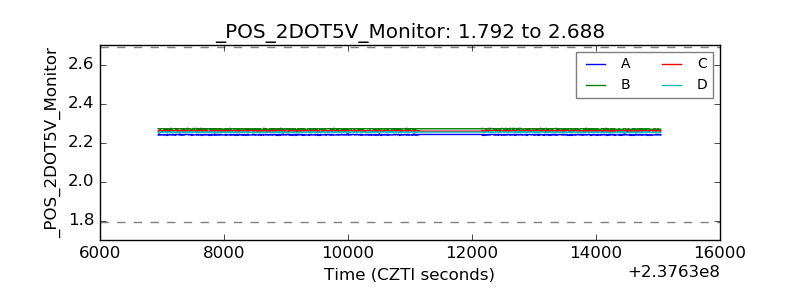 |
| +5 Volts monitor |  |
| _ROLL_ROT | 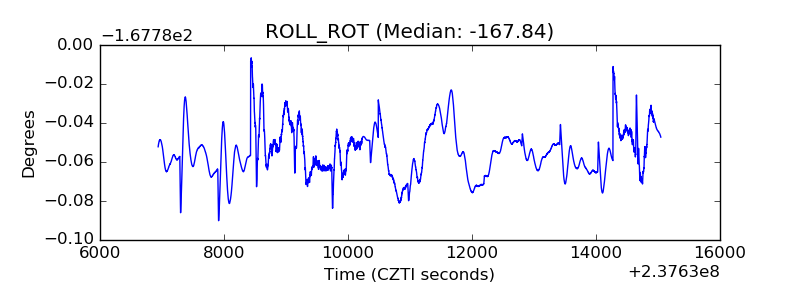 |
| _Roll_DEC | 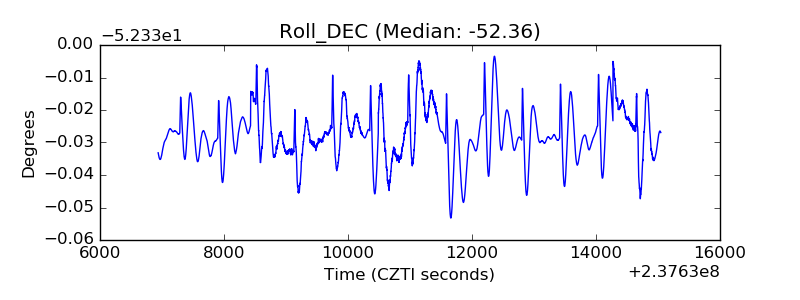 |
| _Roll_RA | 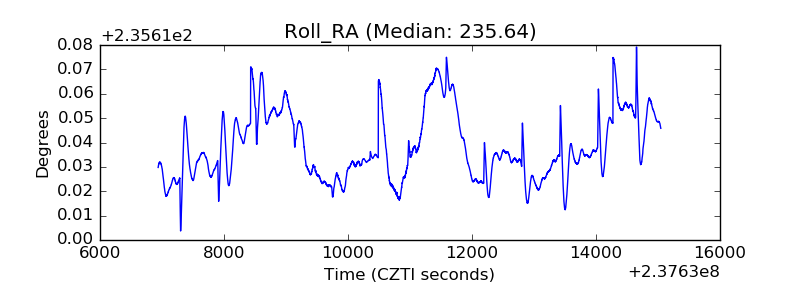 |
| Veto Counter | 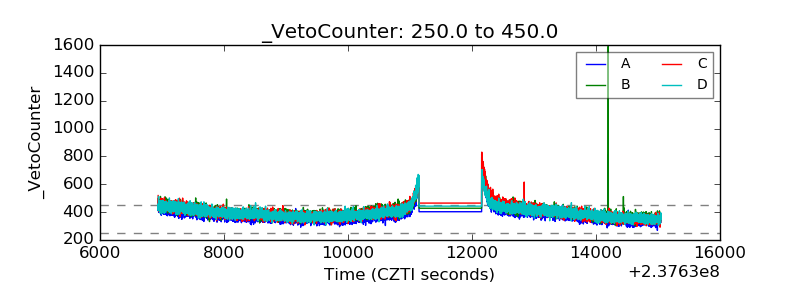 |