| Param | Original file | Final file |
|---|---|---|
| Filename | modeM0/AS1A03_068T01_9000001380_09691cztM0_level2.evt | modeM0/AS1A03_068T01_9000001380_09691cztM0_level2_quad_clean.evt |
| Size (bytes) | 984,024,000 | 168,909,120 |
| Size | 938.4 MB | 161.1 MB |
| Events in quadrant A | 6,827,434 | 1,032,575 |
| Events in quadrant B | 6,935,398 | 1,049,286 |
| Events in quadrant C | 6,950,386 | 1,021,273 |
| Events in quadrant D | 8,085,266 | 990,112 |
| Mode M9 | |||
|---|---|---|---|
| Quadrant | BADHDUFLAG | Total packets | Discarded packets |
| A | 0 | 17 | 1 |
| B | 0 | 17 | 0 |
| C | 0 | 17 | 0 |
| D | 0 | 17 | 0 |
| Mode SS | |||
|---|---|---|---|
| Quadrant | BADHDUFLAG | Total packets | Discarded packets |
| A | 0 | 304 | 2 |
| B | 0 | 304 | 0 |
| C | 0 | 304 | 0 |
| D | 0 | 304 | 4 |
| Mode M0 | |||
|---|---|---|---|
| Quadrant | BADHDUFLAG | Total packets | Discarded packets |
| A | 0 | 30621 | 199 |
| B | 0 | 30718 | 190 |
| C | 0 | 31142 | 185 |
| D | 0 | 34243 | 264 |
| Quadrant | Total seconds | Saturated seconds | Saturation percentage |
|---|---|---|---|
| A | 14804 | 140 | 0.945690% |
| B | 14811 | 201 | 1.357099% |
| C | 14807 | 174 | 1.175120% |
| D | 14790 | 216 | 1.460446% |
Noise dominated data is calculated using 1-second bins in cleaned event files. If a bin has >2000 counts, and if more than 50% of those come from <1% of pixels, then it is considered to be noise-dominated and hence unusable.
| Quadrant | # 1 sec bins | Bins with >0 counts | Bins with >2000 counts | High rate bins dominated by noise | Noise dominated (total time) | Noise dominated (detector-on time) | Marked lightcurve |
|---|---|---|---|---|---|---|---|
| A | 16621 | 14891 | 0 | 0 | 0.00% | 0.00% | 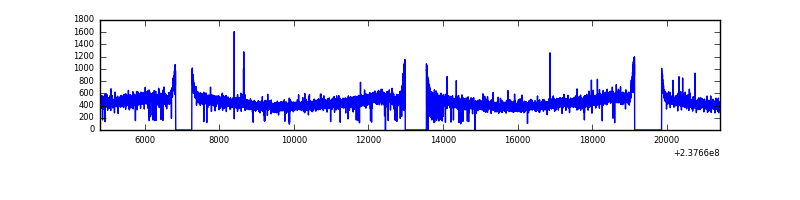 |
| B | 16621 | 14893 | 1 | 1 | 0.01% | 0.01% | 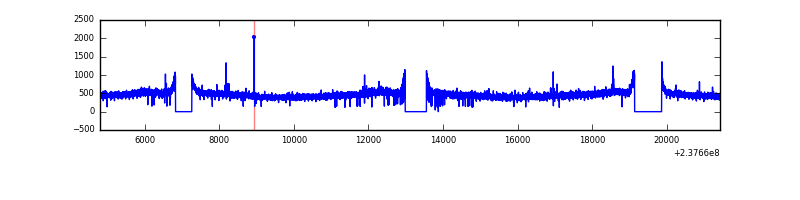 |
| C | 16621 | 14893 | 34 | 34 | 0.20% | 0.23% | 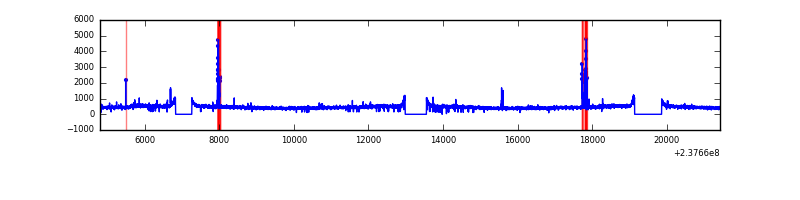 |
| D | 16621 | 14890 | 71 | 71 | 0.43% | 0.48% | 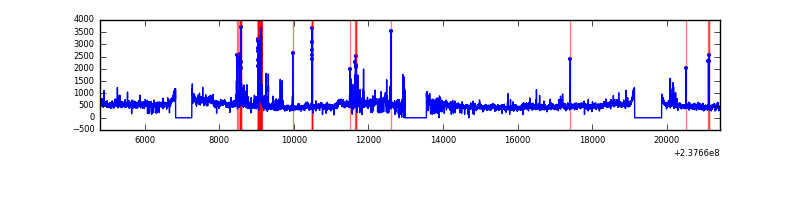 |
Top three noisy pixels from each quadrant. If the there are fewer than three noisy pixels in the level2.evt file, extra rows are filled as -1
| Pixel properties | Quadrant properties | ||||||
|---|---|---|---|---|---|---|---|
| Quadrant | DetID | PixID | Counts | Sigma | Mean | Median | Sigma |
| A | 0 | 226 | 16126 | 39.73 | 1772 | 1729 | 362.4 |
| A | 12 | 194 | 14307 | 34.71 | 1772 | 1729 | 362.4 |
| A | 13 | 251 | 10299 | 23.65 | 1772 | 1729 | 362.4 |
| B | 12 | 111 | 40675 | 113.36 | 1777 | 1732 | 343.5 |
| B | 11 | 111 | 33218 | 91.65 | 1777 | 1732 | 343.5 |
| B | 14 | 111 | 25717 | 69.82 | 1777 | 1732 | 343.5 |
| C | 14 | 234 | 160735 | 392.49 | 1726 | 1729 | 405.1 |
| C | 9 | 68 | 40168 | 94.88 | 1726 | 1729 | 405.1 |
| C | 10 | 22 | 16622 | 36.76 | 1726 | 1729 | 405.1 |
| D | 8 | 195 | 991930 | 2355.34 | 1709 | 1663 | 420.4 |
| D | 12 | 233 | 406139 | 962.04 | 1709 | 1663 | 420.4 |
| D | 1 | 52 | 60658 | 140.32 | 1709 | 1663 | 420.4 |
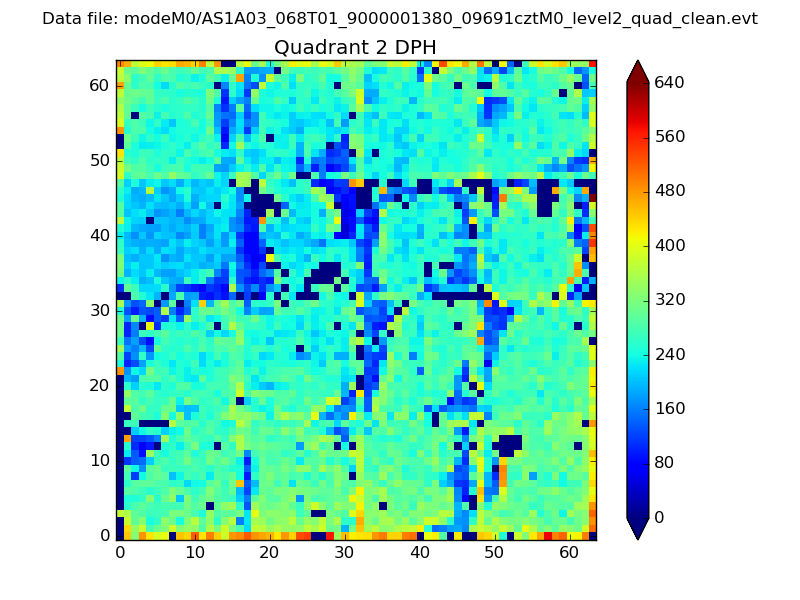
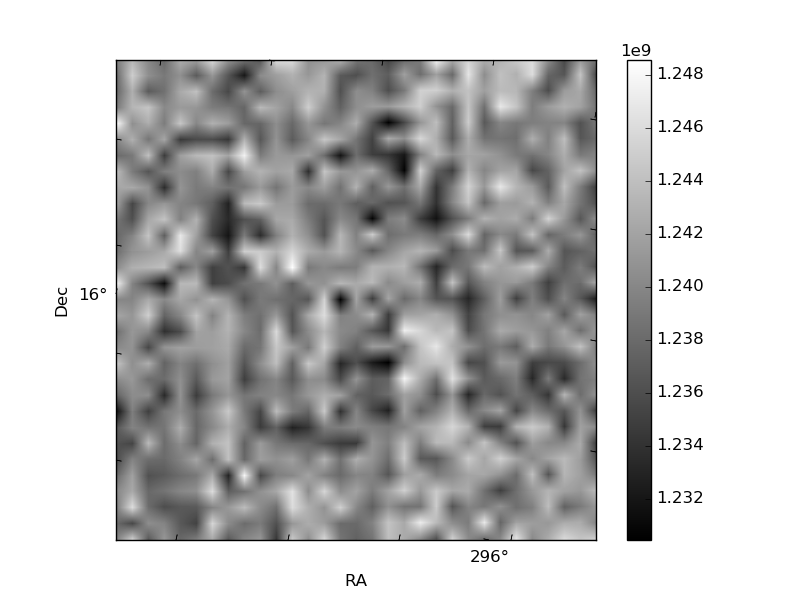
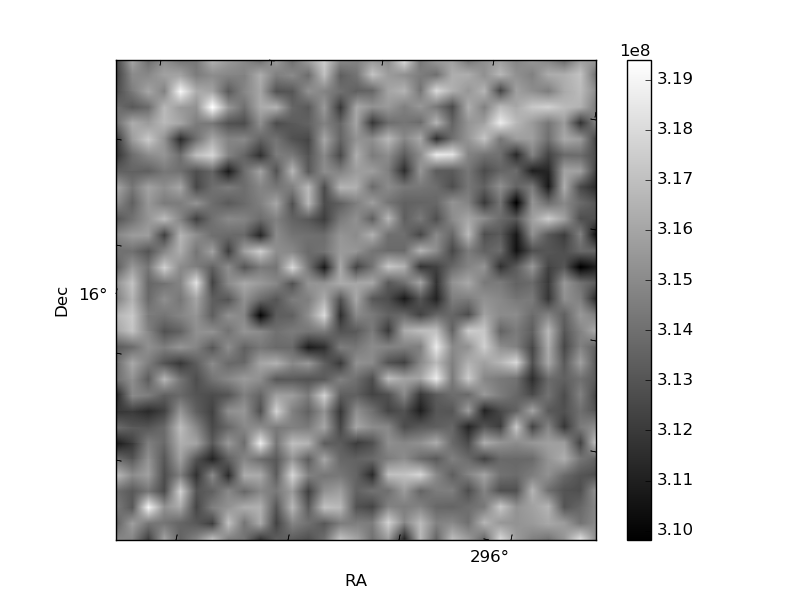
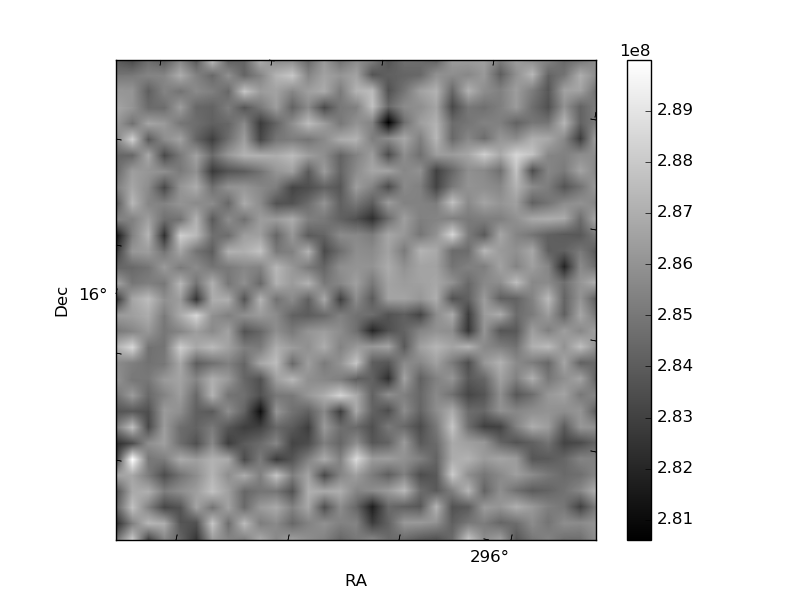
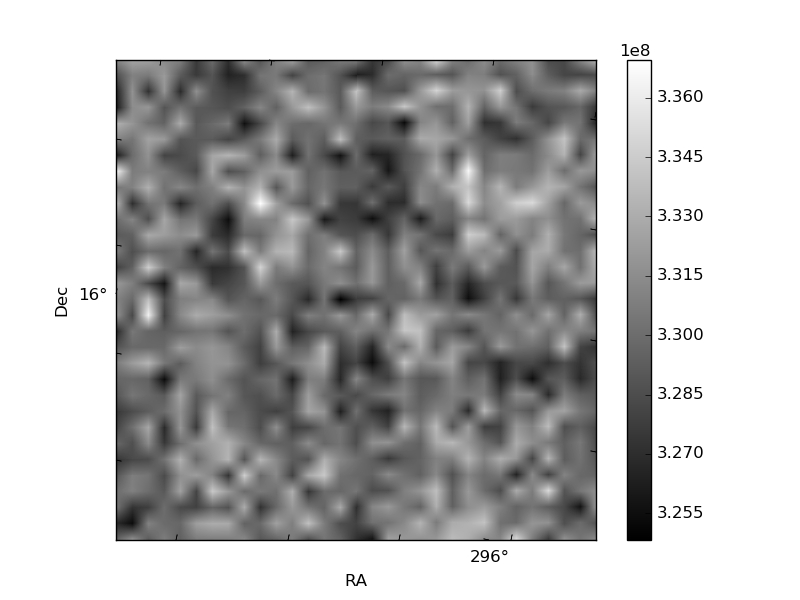
Histogram calculated using DETX and DETY for each event in the final _common_clean file
| Quadrant A | 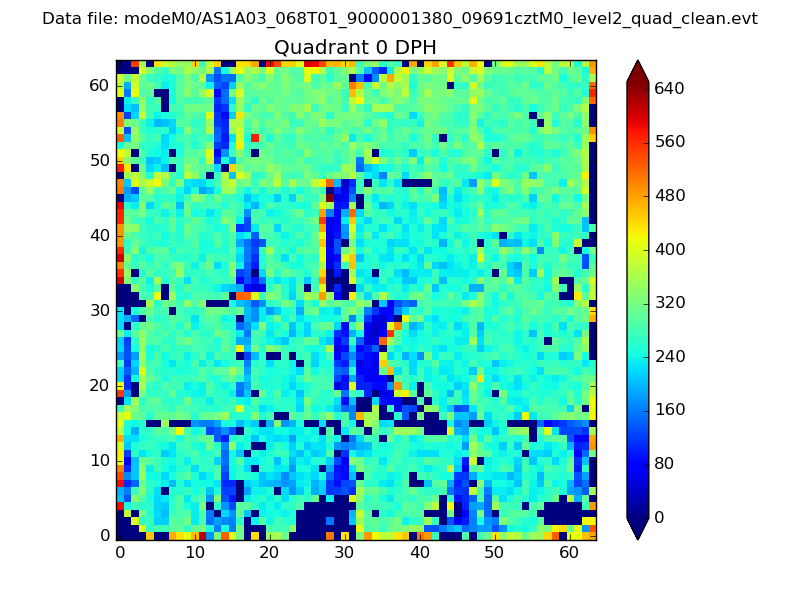 |
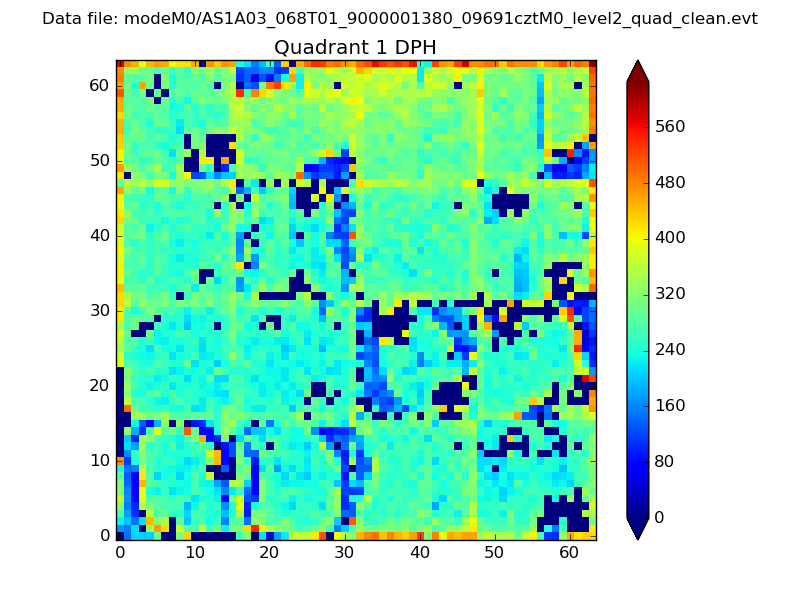 |
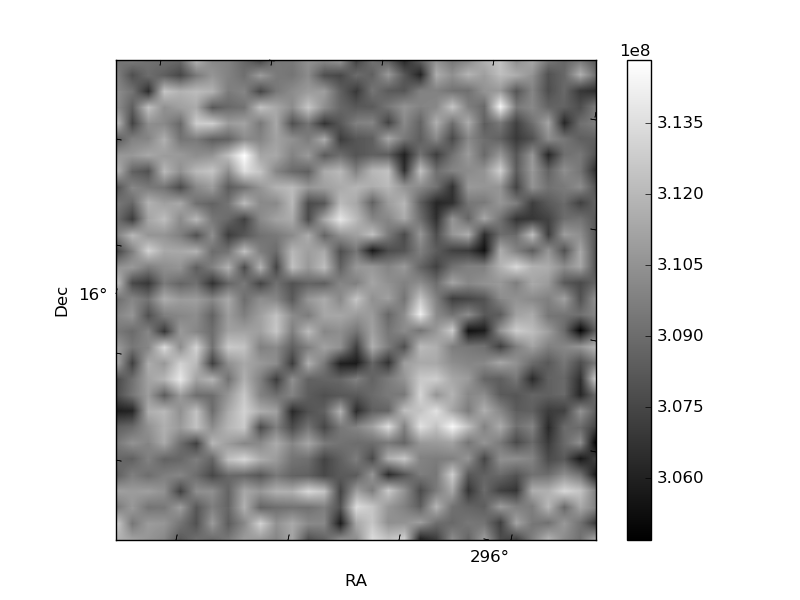
Quadrant B |
|---|---|---|---|
| Quadrant D | 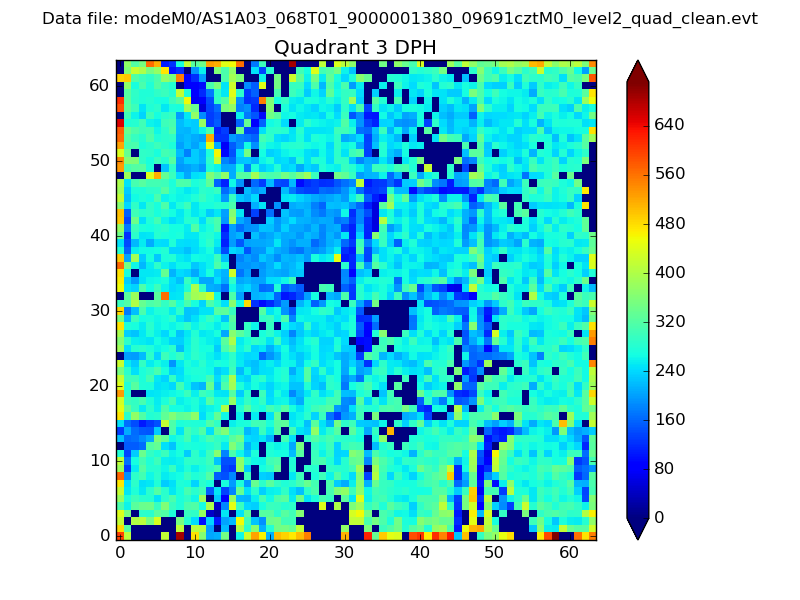 |
 |
Quadrant C |
| Plot type | Count rate plots | Images |
|---|---|---|
| Comparison with Poisson distribution Blue bars denote a histogram of data divided into 1 sec bins. Red curve is a Poisson curve with rate = median count rate of data. |
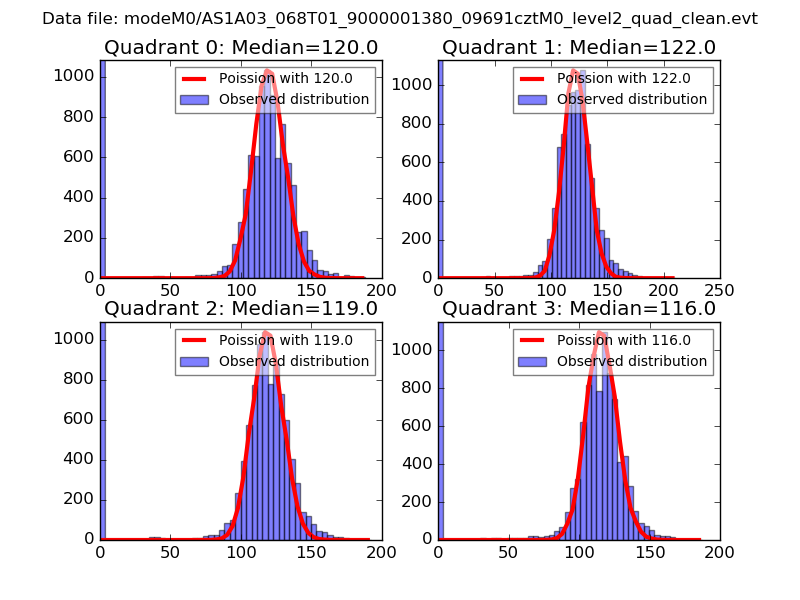 |
 |
| Quadrant-wise count rates Data is divided into 100 sec bins |
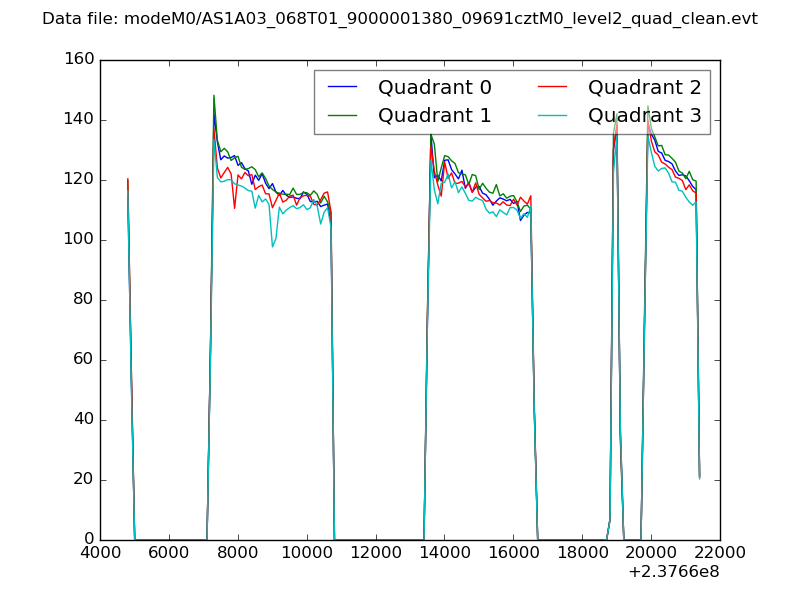 |
|
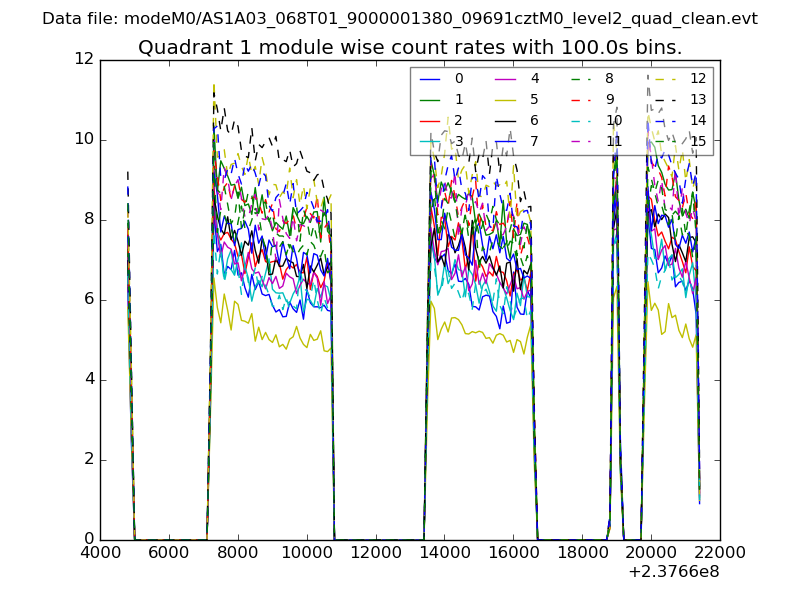
| Module-wise count rates for Quadrant A Data is divided into 100 sec bins |
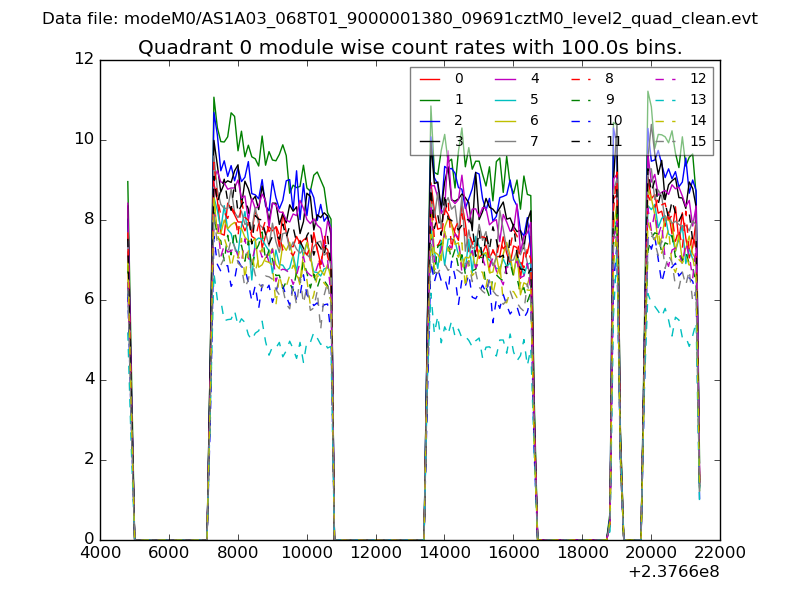 |
 |
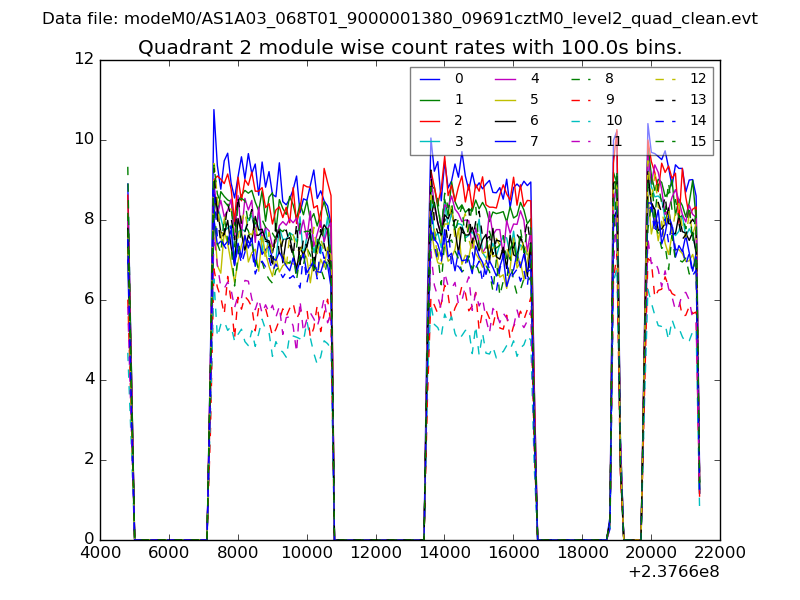
| Module-wise count rates for Quadrant B Data is divided into 100 sec bins |
 |
 |
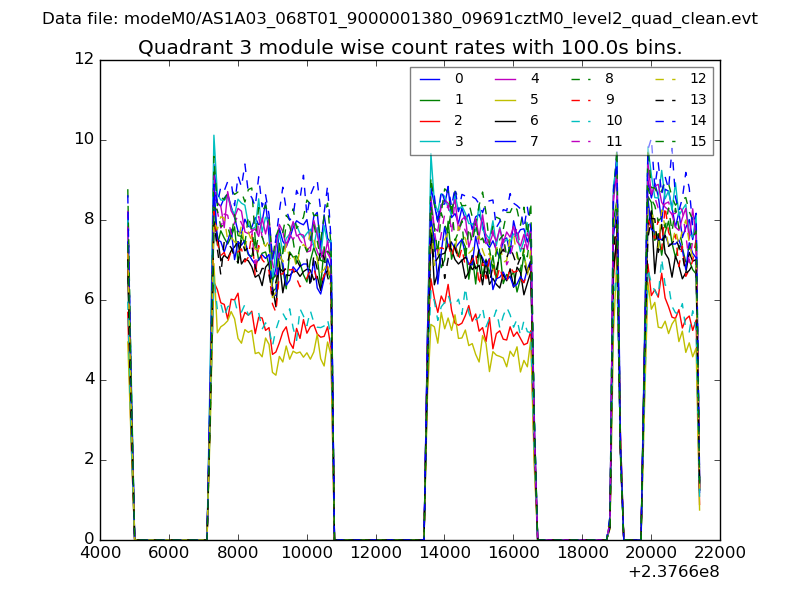
| Module-wise count rates for Quadrant C Data is divided into 100 sec bins |
 |
 |
| Module-wise count rates for Quadrant D Data is divided into 100 sec bins |
 |
 |
| Parameter | Plot |
|---|---|
| CZT HV Monitor | 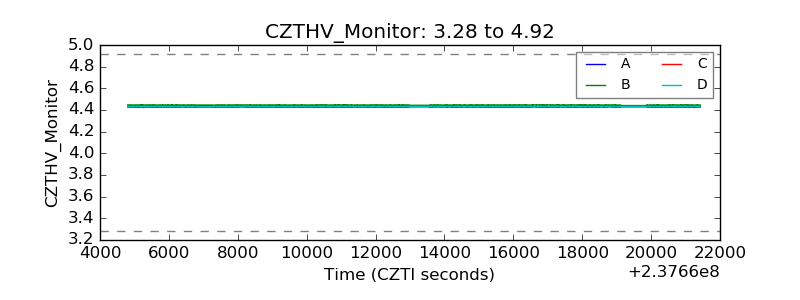 |
| D_VDD | 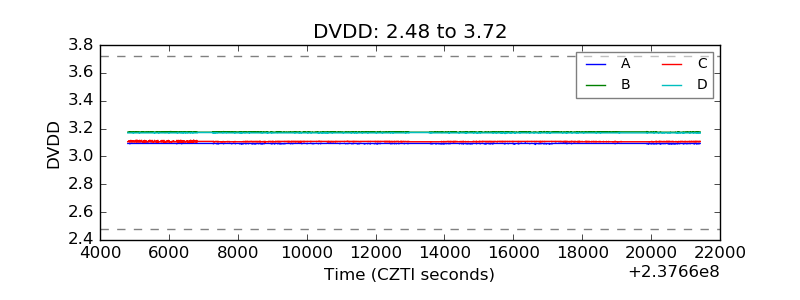 |
| Temperature 1 | 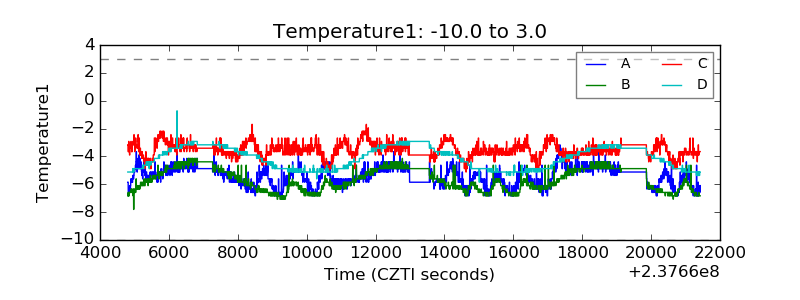 |
| Veto HV Monitor | 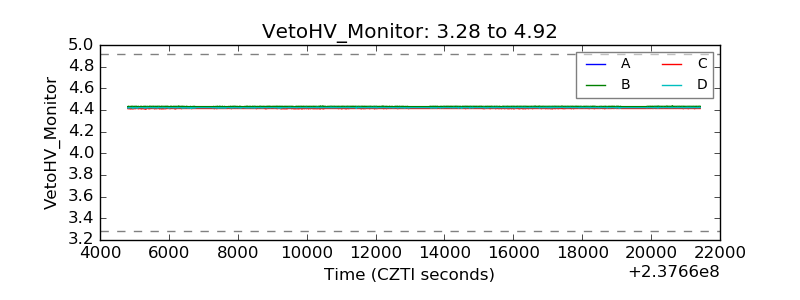 |
| Veto LLD | 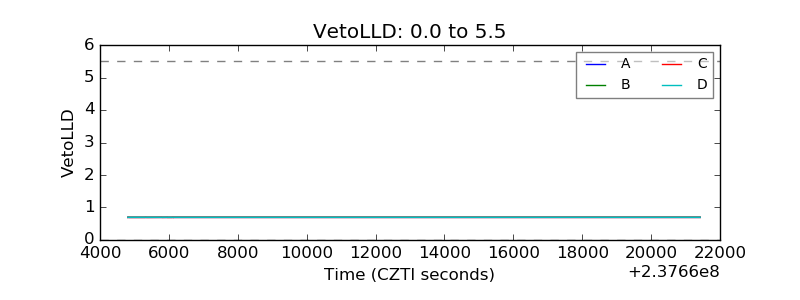 |
| Alpha Counter | 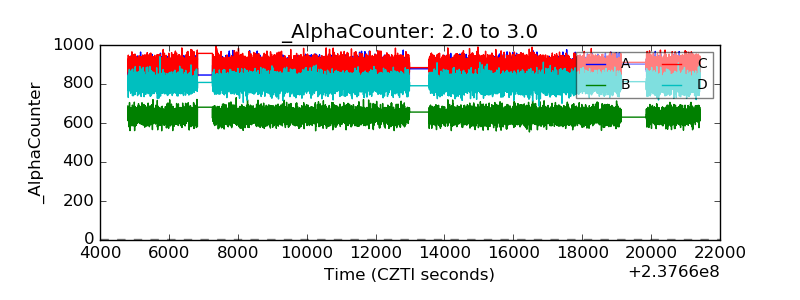 |
| _CPM_Rate | 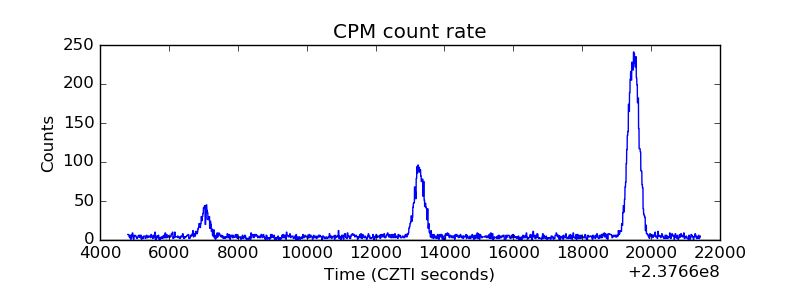 |
| CZT Counter | 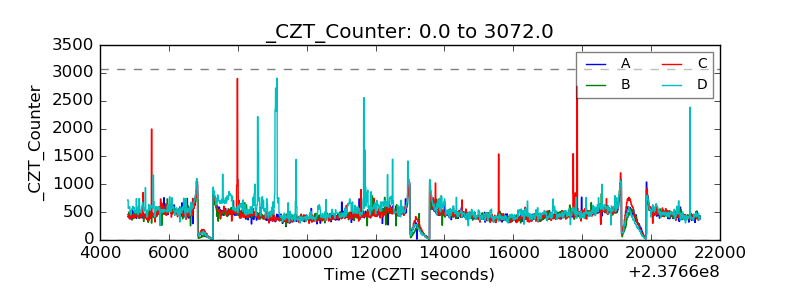 |
| +2.5 Volts monitor |  |
| +5 Volts monitor |  |
| _ROLL_ROT | 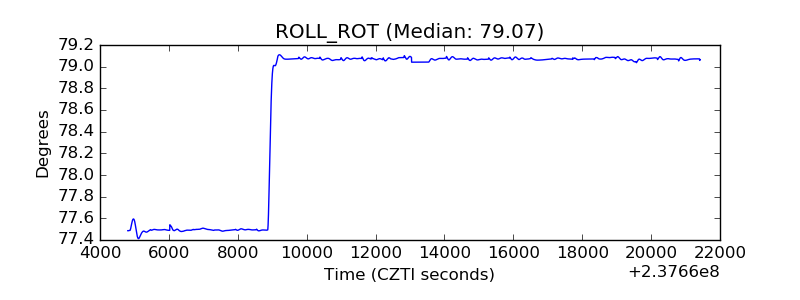 |
| _Roll_DEC | 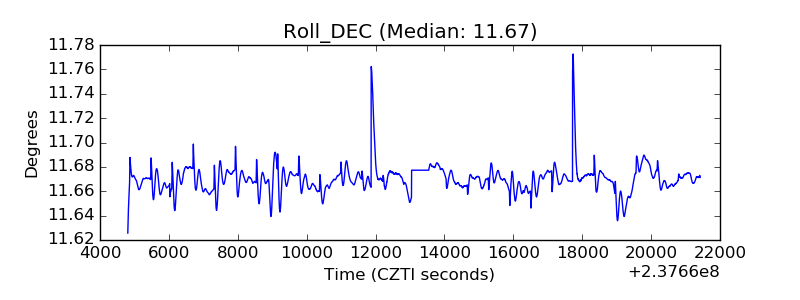 |
| _Roll_RA | 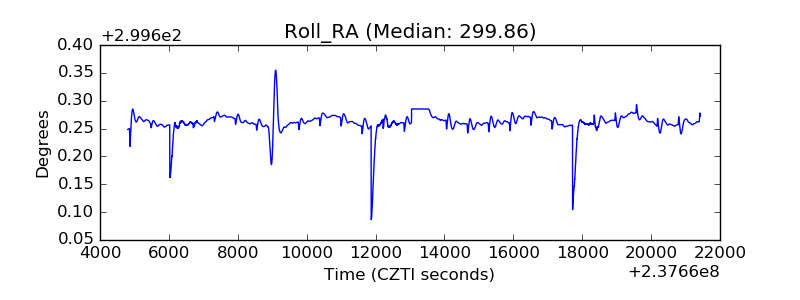 |
| Veto Counter | 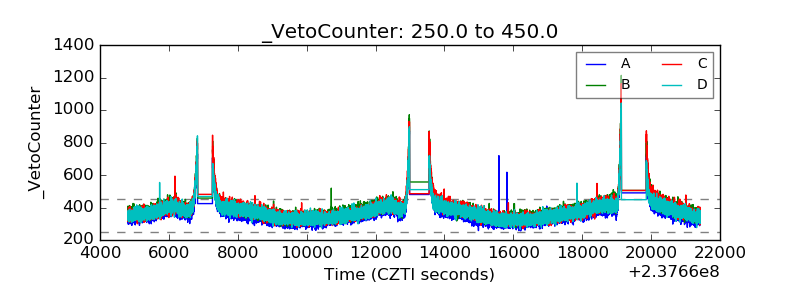 |