| Param | Original file | Final file |
|---|---|---|
| Filename | modeM0/AS1A03_068T01_9000001380_09692cztM0_level2.evt | modeM0/AS1A03_068T01_9000001380_09692cztM0_level2_quad_clean.evt |
| Size (bytes) | 440,542,080 | 91,468,800 |
| Size | 420.1 MB | 87.2 MB |
| Events in quadrant A | 3,162,527 | 578,193 |
| Events in quadrant B | 3,201,110 | 587,210 |
| Events in quadrant C | 3,245,821 | 570,406 |
| Events in quadrant D | 3,266,981 | 557,346 |
| Mode M9 | |||
|---|---|---|---|
| Quadrant | BADHDUFLAG | Total packets | Discarded packets |
| A | 0 | 16 | 0 |
| B | 0 | 16 | 0 |
| C | 0 | 16 | 0 |
| D | 0 | 16 | 0 |
| Mode SS | |||
|---|---|---|---|
| Quadrant | BADHDUFLAG | Total packets | Discarded packets |
| A | 0 | 142 | 2 |
| B | 0 | 142 | 0 |
| C | 0 | 142 | 0 |
| D | 0 | 142 | 0 |
| Mode M0 | |||
|---|---|---|---|
| Quadrant | BADHDUFLAG | Total packets | Discarded packets |
| A | 0 | 14125 | 11 |
| B | 0 | 14148 | 18 |
| C | 0 | 14474 | 14 |
| D | 0 | 14478 | 14 |
| Quadrant | Total seconds | Saturated seconds | Saturation percentage |
|---|---|---|---|
| A | 6843 | 77 | 1.125237% |
| B | 6840 | 105 | 1.535088% |
| C | 6841 | 107 | 1.564099% |
| D | 6841 | 71 | 1.037860% |
Noise dominated data is calculated using 1-second bins in cleaned event files. If a bin has >2000 counts, and if more than 50% of those come from <1% of pixels, then it is considered to be noise-dominated and hence unusable.
| Quadrant | # 1 sec bins | Bins with >0 counts | Bins with >2000 counts | High rate bins dominated by noise | Noise dominated (total time) | Noise dominated (detector-on time) | Marked lightcurve |
|---|---|---|---|---|---|---|---|
| A | 8467 | 6849 | 0 | 0 | 0.00% | 0.00% |  |
| B | 8466 | 6845 | 0 | 0 | 0.00% | 0.00% |  |
| C | 8465 | 6847 | 15 | 15 | 0.18% | 0.22% |  |
| D | 8465 | 6847 | 5 | 5 | 0.06% | 0.07% | 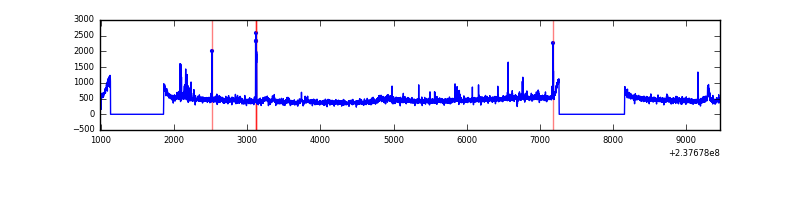 |
Top three noisy pixels from each quadrant. If the there are fewer than three noisy pixels in the level2.evt file, extra rows are filled as -1
| Pixel properties | Quadrant properties | ||||||
|---|---|---|---|---|---|---|---|
| Quadrant | DetID | PixID | Counts | Sigma | Mean | Median | Sigma |
| A | 0 | 226 | 7343 | 38.96 | 821 | 804 | 167.8 |
| A | 12 | 194 | 6720 | 35.25 | 821 | 804 | 167.8 |
| A | 3 | 137 | 3931 | 18.63 | 821 | 804 | 167.8 |
| B | 12 | 111 | 18703 | 111.88 | 823 | 802 | 160.0 |
| B | 11 | 111 | 15430 | 91.43 | 823 | 802 | 160.0 |
| B | 14 | 111 | 12142 | 70.88 | 823 | 802 | 160.0 |
| C | 14 | 234 | 123371 | 652.17 | 799 | 803 | 187.9 |
| C | 13 | 61 | 5881 | 27.02 | 799 | 803 | 187.9 |
| C | 14 | 67 | 3874 | 16.34 | 799 | 803 | 187.9 |
| D | 8 | 195 | 112713 | 554.31 | 794 | 773 | 201.9 |
| D | 1 | 52 | 58836 | 287.52 | 794 | 773 | 201.9 |
| D | 7 | 71 | 37241 | 180.58 | 794 | 773 | 201.9 |
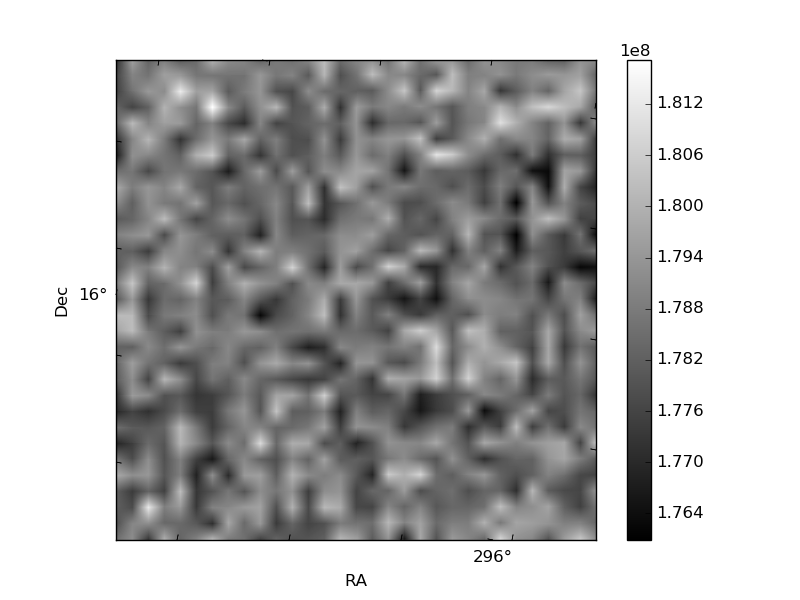
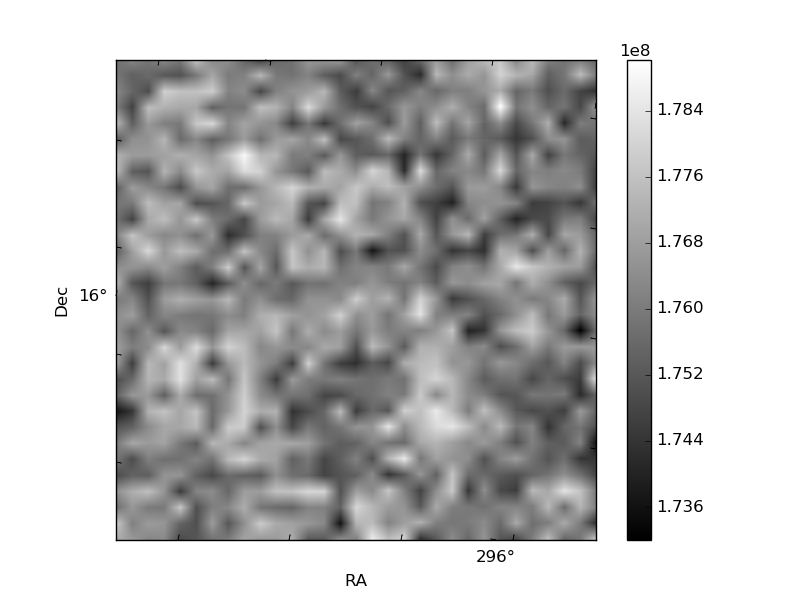
Histogram calculated using DETX and DETY for each event in the final _common_clean file
| Quadrant A | 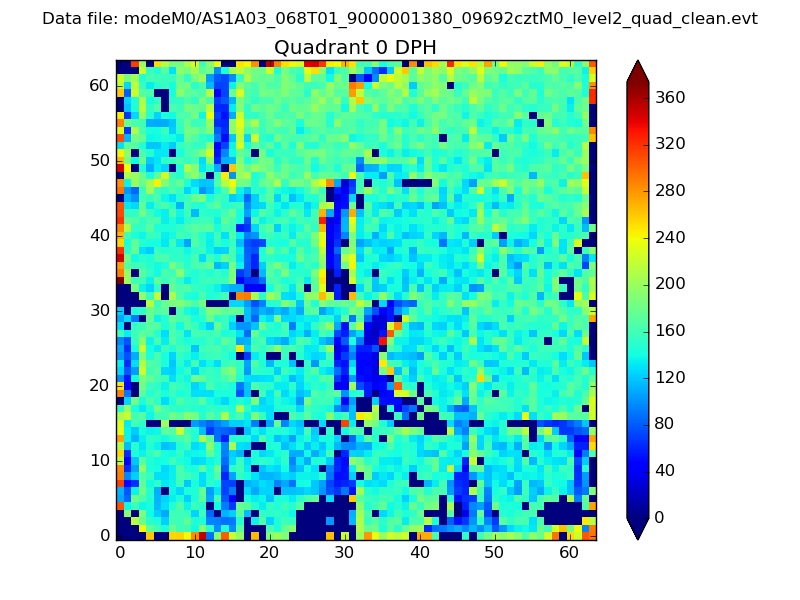 |
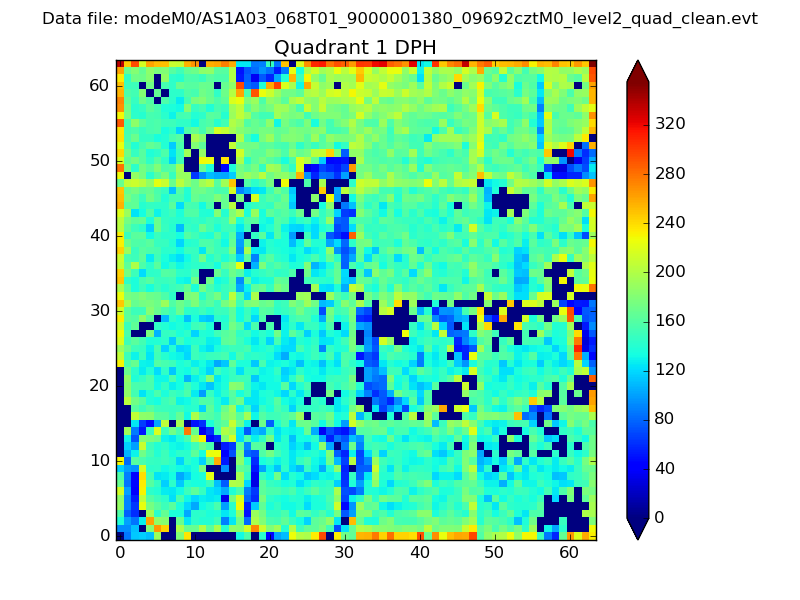 |
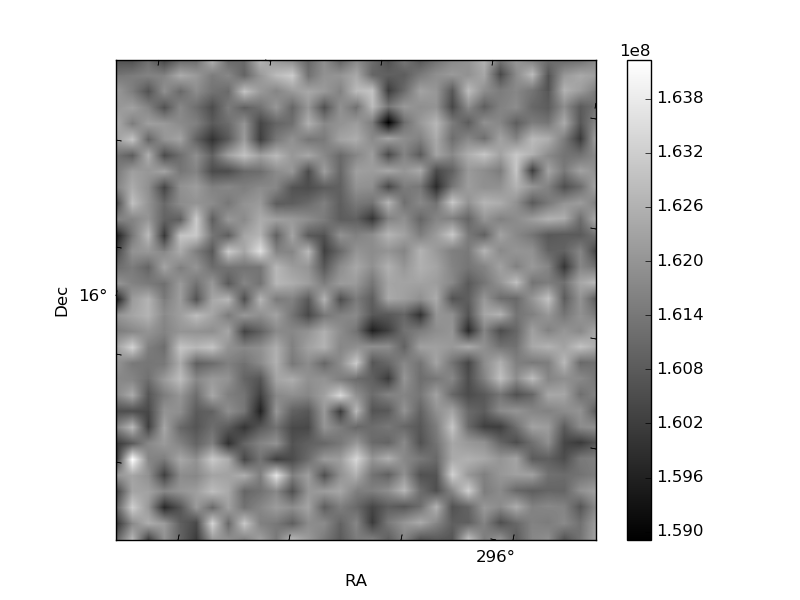
Quadrant B |
|---|---|---|---|
| Quadrant D | 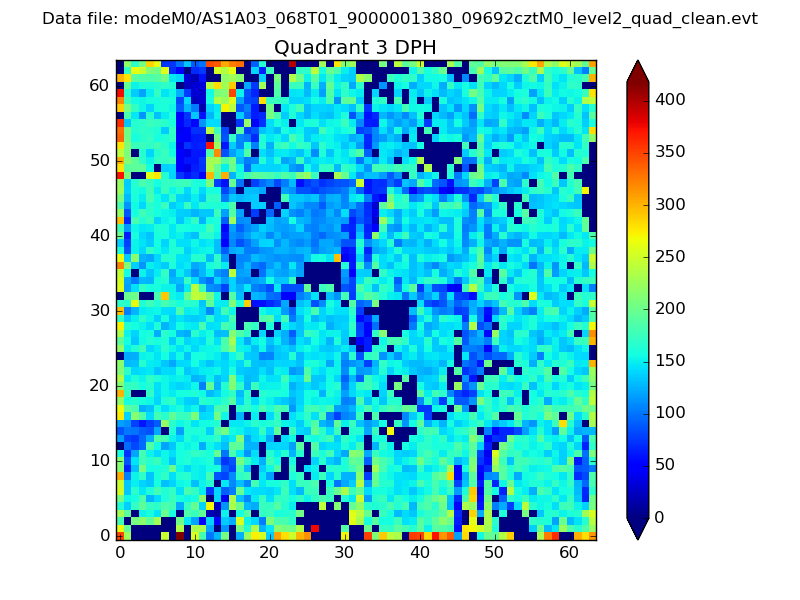 |
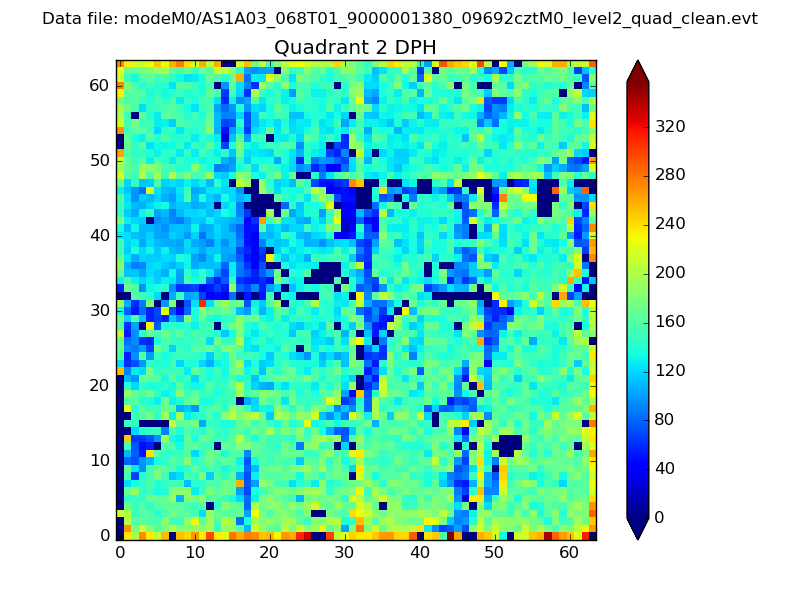 |
Quadrant C |
| Plot type | Count rate plots | Images |
|---|---|---|
| Comparison with Poisson distribution Blue bars denote a histogram of data divided into 1 sec bins. Red curve is a Poisson curve with rate = median count rate of data. |
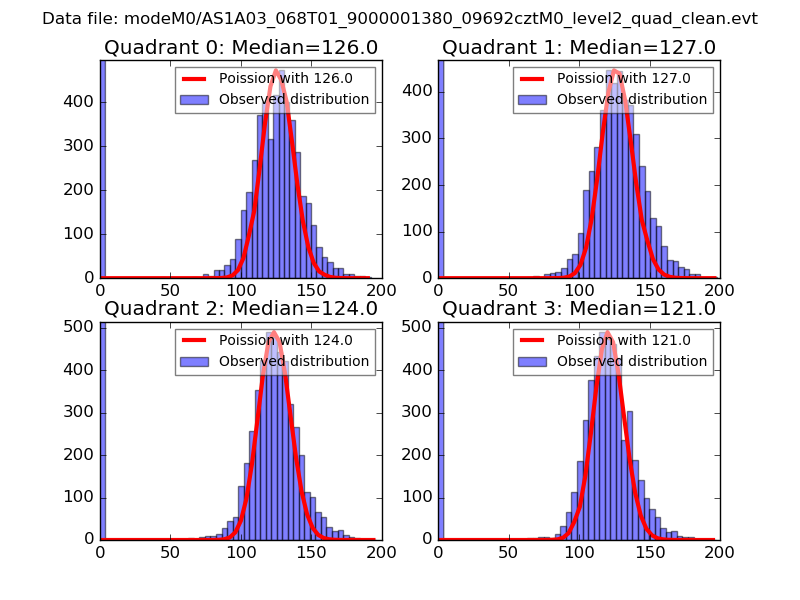 |
 |
| Quadrant-wise count rates Data is divided into 100 sec bins |
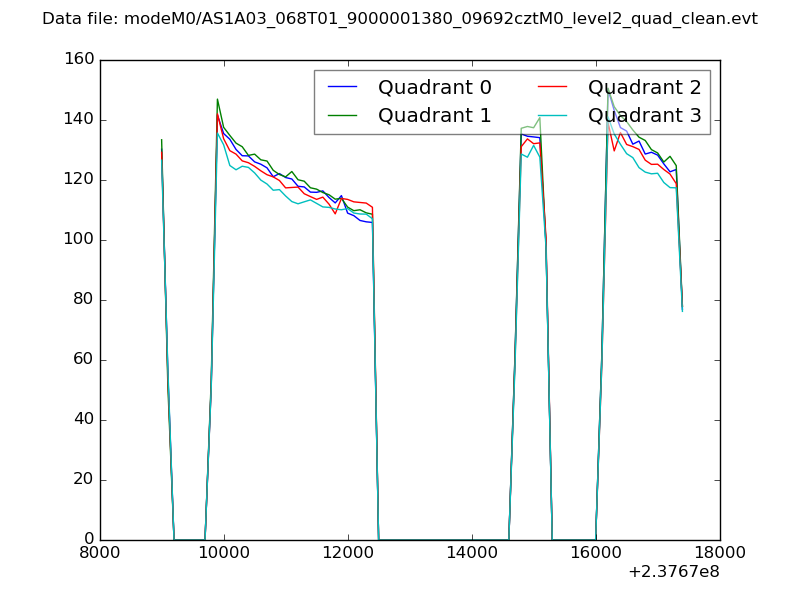 |
|
| Module-wise count rates for Quadrant A Data is divided into 100 sec bins |
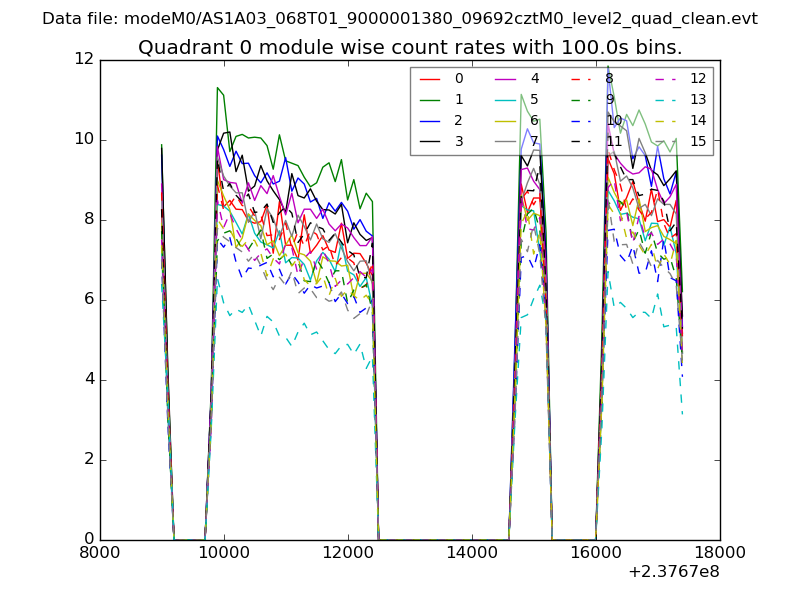 |
 |
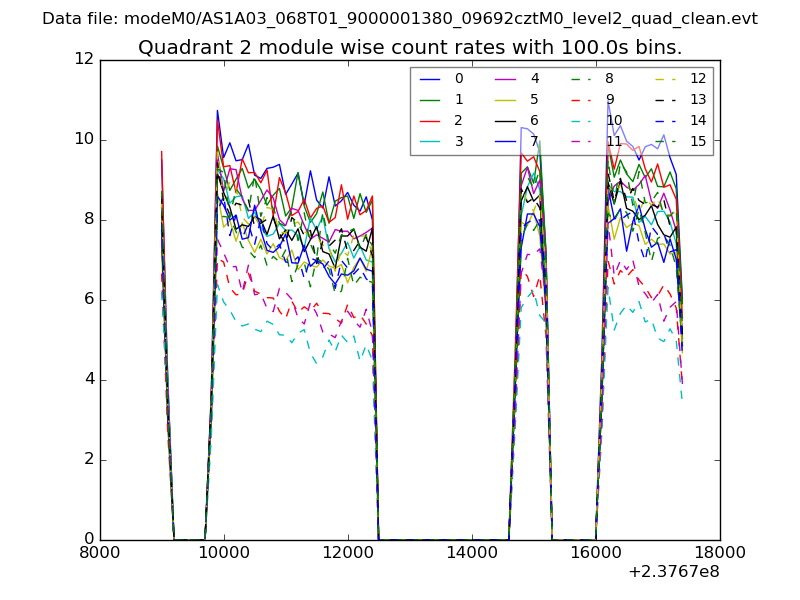
| Module-wise count rates for Quadrant B Data is divided into 100 sec bins |
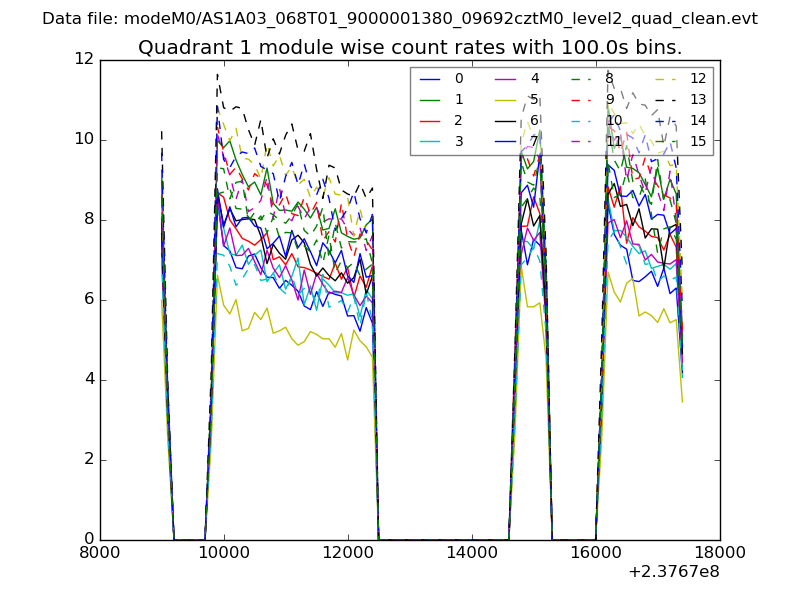 |
 |
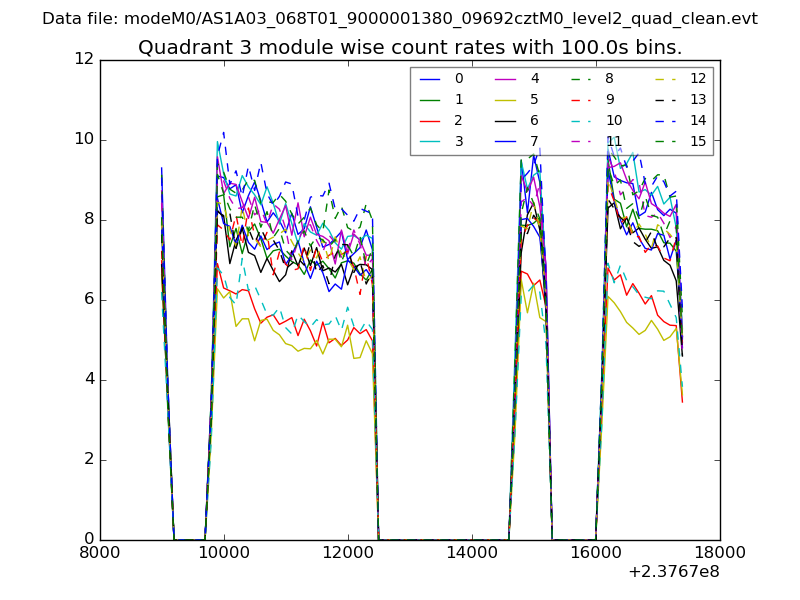
| Module-wise count rates for Quadrant C Data is divided into 100 sec bins |
 |
 |
| Module-wise count rates for Quadrant D Data is divided into 100 sec bins |
 |
 |
| Parameter | Plot |
|---|---|
| CZT HV Monitor | 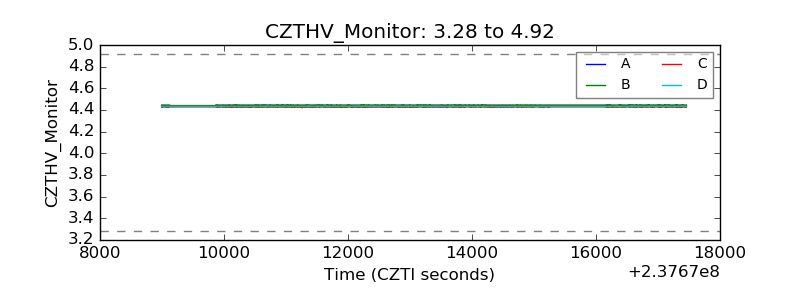 |
| D_VDD | 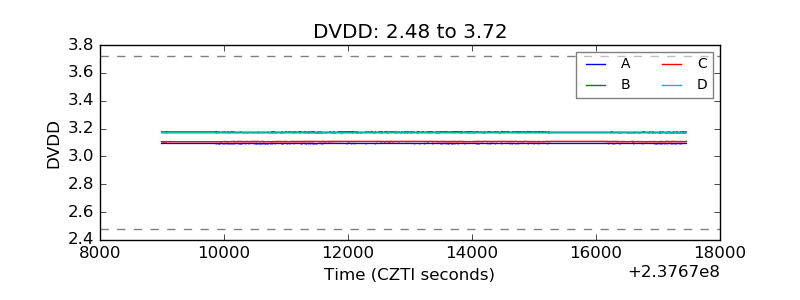 |
| Temperature 1 | 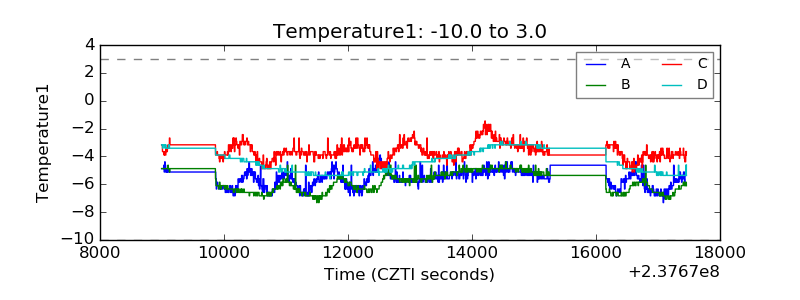 |
| Veto HV Monitor | 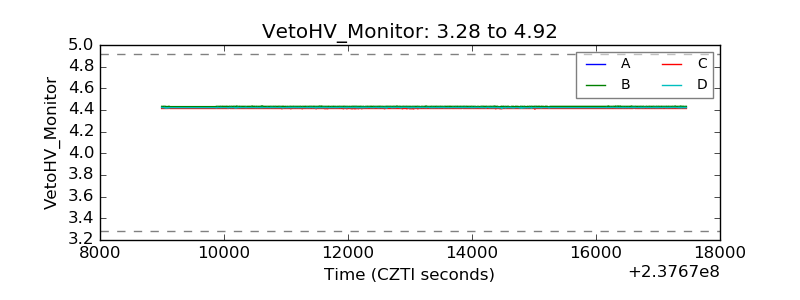 |
| Veto LLD | 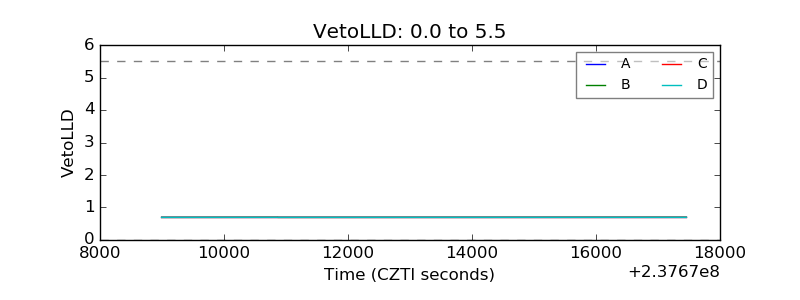 |
| Alpha Counter | 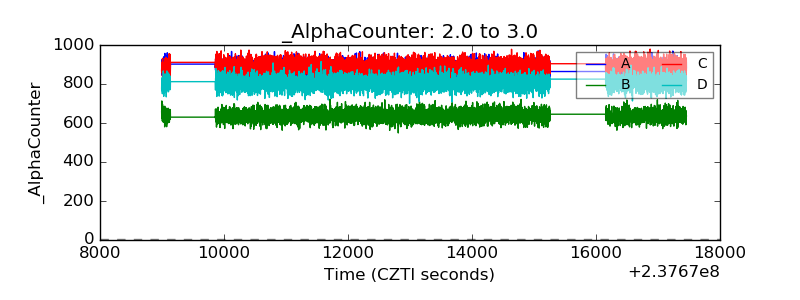 |
| _CPM_Rate | 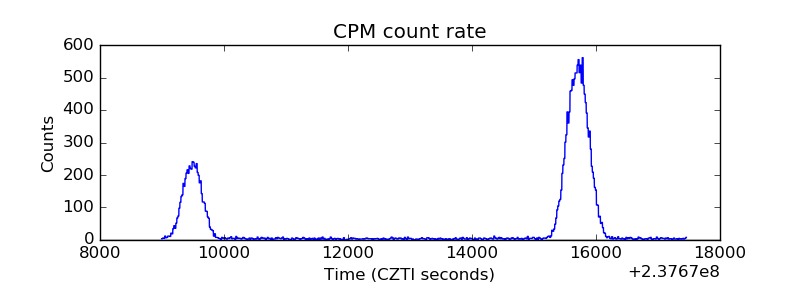 |
| CZT Counter | 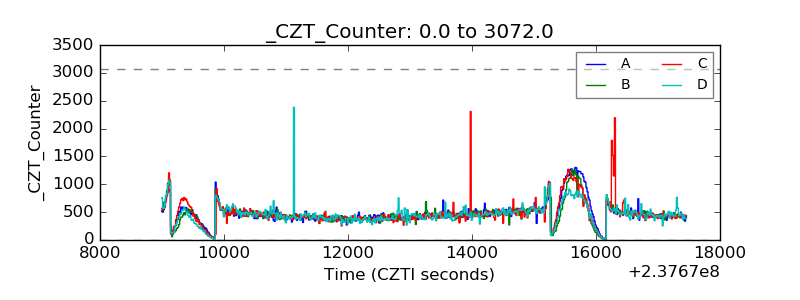 |
| +2.5 Volts monitor |  |
| +5 Volts monitor |  |
| _ROLL_ROT | 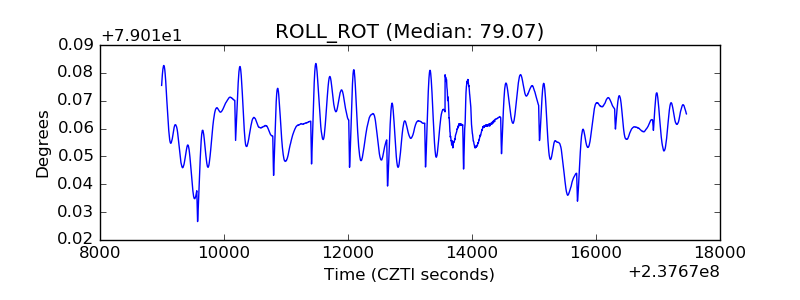 |
| _Roll_DEC | 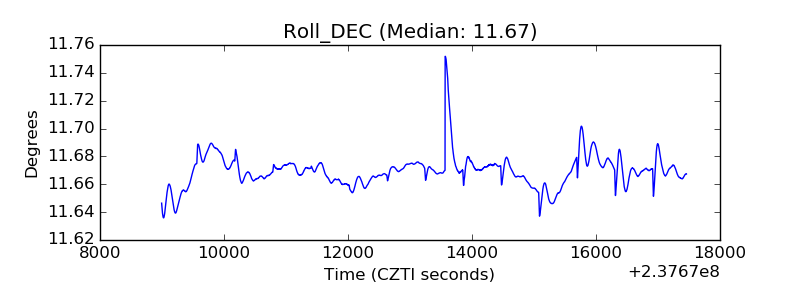 |
| _Roll_RA | 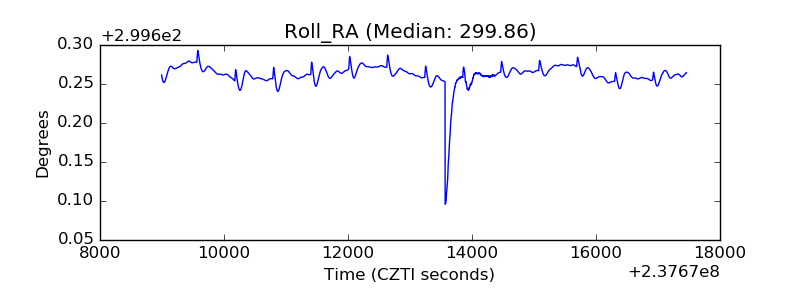 |
| Veto Counter | 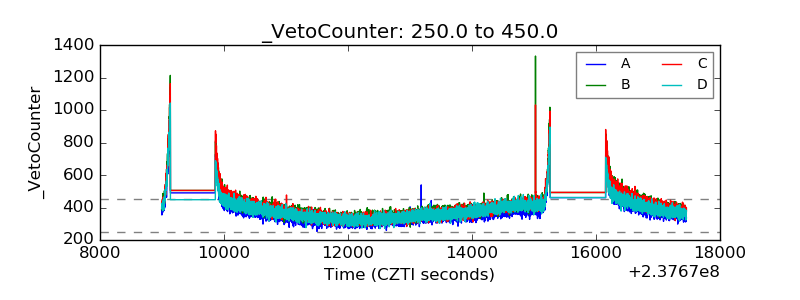 |