| Param | Original file | Final file |
|---|---|---|
| Filename | modeM0/AS1A03_068T01_9000001380_09695cztM0_level2.evt | modeM0/AS1A03_068T01_9000001380_09695cztM0_level2_quad_clean.evt |
| Size (bytes) | 470,744,640 | 89,049,600 |
| Size | 448.9 MB | 84.9 MB |
| Events in quadrant A | 3,026,178 | 576,012 |
| Events in quadrant B | 3,077,721 | 591,203 |
| Events in quadrant C | 3,643,349 | 545,537 |
| Events in quadrant D | 4,076,062 | 538,907 |
| Mode M9 | |||
|---|---|---|---|
| Quadrant | BADHDUFLAG | Total packets | Discarded packets |
| A | 0 | 15 | 0 |
| B | 0 | 15 | 0 |
| C | 0 | 15 | 0 |
| D | 0 | 16 | 0 |
| Mode SS | |||
|---|---|---|---|
| Quadrant | BADHDUFLAG | Total packets | Discarded packets |
| A | 0 | 128 | 0 |
| B | 0 | 128 | 0 |
| C | 0 | 128 | 0 |
| D | 0 | 128 | 0 |
| Mode M0 | |||
|---|---|---|---|
| Quadrant | BADHDUFLAG | Total packets | Discarded packets |
| A | 0 | 13064 | 5 |
| B | 0 | 13133 | 2 |
| C | 0 | 15196 | 2 |
| D | 0 | 16259 | 10 |
| Quadrant | Total seconds | Saturated seconds | Saturation percentage |
|---|---|---|---|
| A | 6382 | 30 | 0.470072% |
| B | 6383 | 47 | 0.736331% |
| C | 6383 | 268 | 4.198653% |
| D | 6382 | 211 | 3.306174% |
Noise dominated data is calculated using 1-second bins in cleaned event files. If a bin has >2000 counts, and if more than 50% of those come from <1% of pixels, then it is considered to be noise-dominated and hence unusable.
| Quadrant | # 1 sec bins | Bins with >0 counts | Bins with >2000 counts | High rate bins dominated by noise | Noise dominated (total time) | Noise dominated (detector-on time) | Marked lightcurve |
|---|---|---|---|---|---|---|---|
| A | 7543 | 6384 | 0 | 0 | 0.00% | 0.00% | 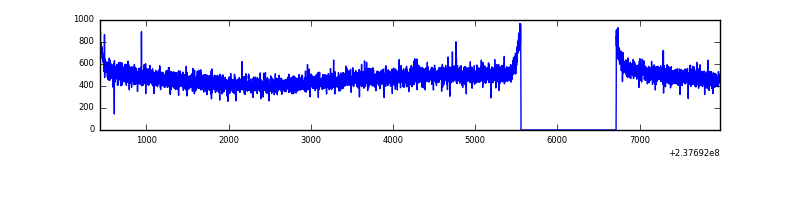 |
| B | 7543 | 6384 | 0 | 0 | 0.00% | 0.00% | 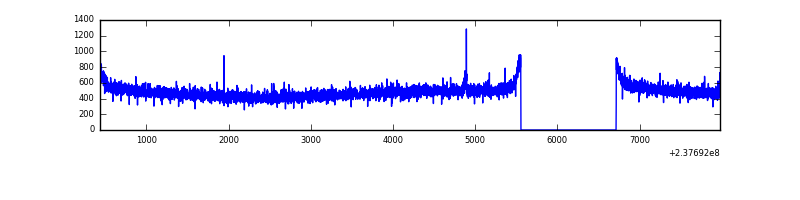 |
| C | 7543 | 6384 | 194 | 194 | 2.57% | 3.04% |  |
| D | 7543 | 6384 | 188 | 188 | 2.49% | 2.94% | 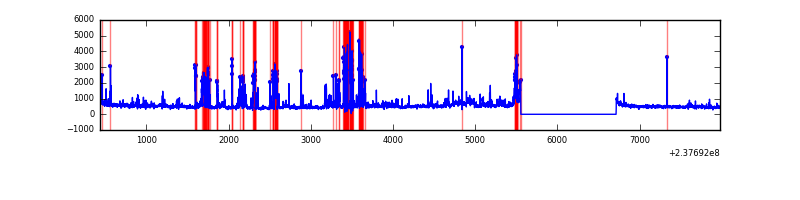 |
Top three noisy pixels from each quadrant. If the there are fewer than three noisy pixels in the level2.evt file, extra rows are filled as -1
| Pixel properties | Quadrant properties | ||||||
|---|---|---|---|---|---|---|---|
| Quadrant | DetID | PixID | Counts | Sigma | Mean | Median | Sigma |
| A | 0 | 226 | 7171 | 40.27 | 785 | 768 | 159.0 |
| A | 12 | 194 | 6316 | 34.89 | 785 | 768 | 159.0 |
| A | 3 | 1 | 4762 | 25.12 | 785 | 768 | 159.0 |
| B | 12 | 111 | 17404 | 110.27 | 790 | 774 | 150.8 |
| B | 11 | 111 | 13969 | 87.49 | 790 | 774 | 150.8 |
| B | 14 | 111 | 11823 | 73.26 | 790 | 774 | 150.8 |
| C | 14 | 234 | 734154 | 4289.33 | 742 | 745 | 171.0 |
| C | 9 | 68 | 12270 | 67.4 | 742 | 745 | 171.0 |
| C | 13 | 61 | 5572 | 28.23 | 742 | 745 | 171.0 |
| D | 1 | 52 | 1021892 | 5275.34 | 738 | 723 | 193.6 |
| D | 8 | 195 | 148475 | 763.28 | 738 | 723 | 193.6 |
| D | 2 | 152 | 45983 | 233.81 | 738 | 723 | 193.6 |
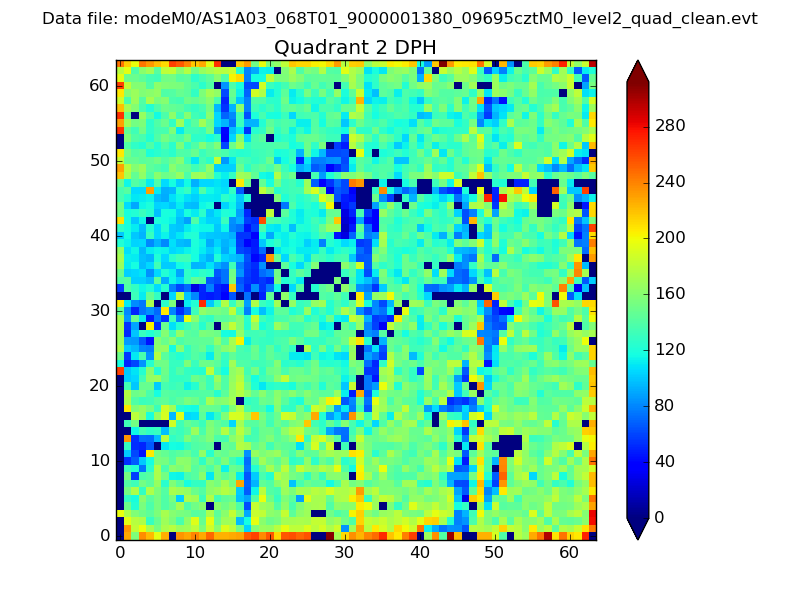
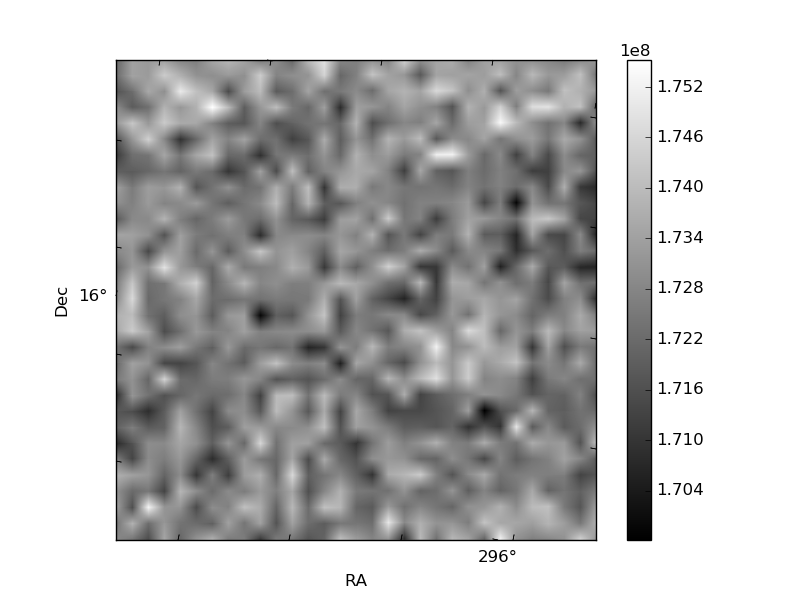
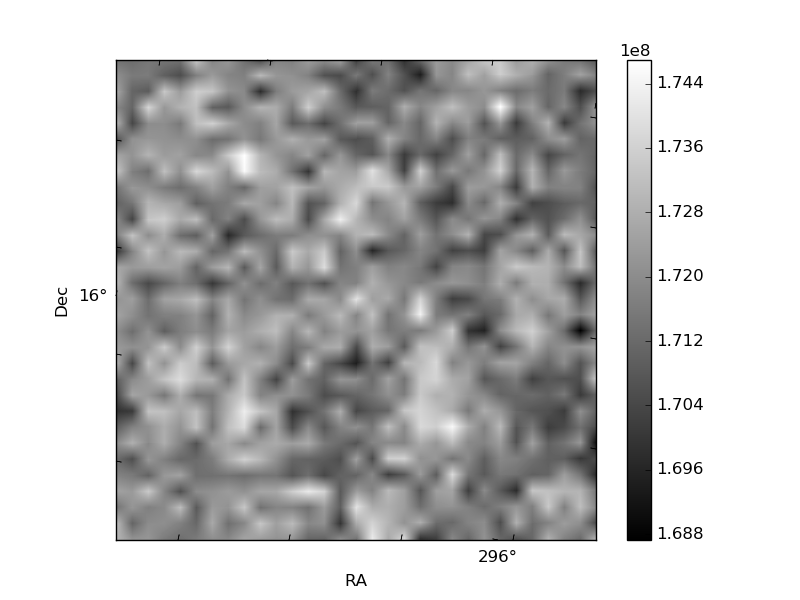
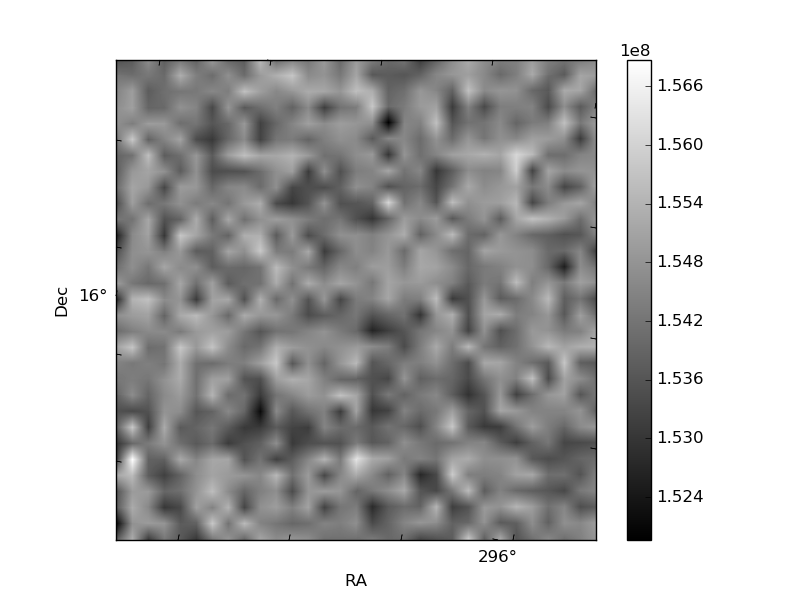
Histogram calculated using DETX and DETY for each event in the final _common_clean file
| Quadrant A | 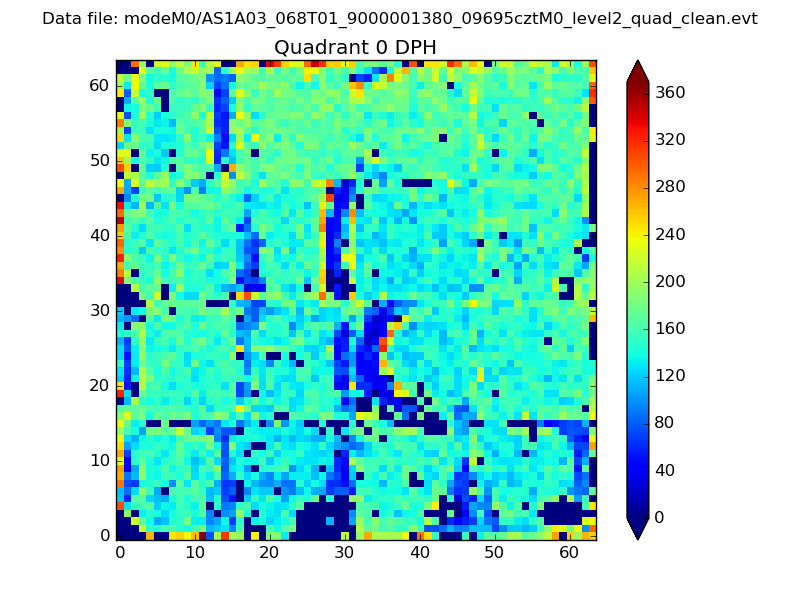 |
 |
Quadrant B |
|---|---|---|---|
| Quadrant D | 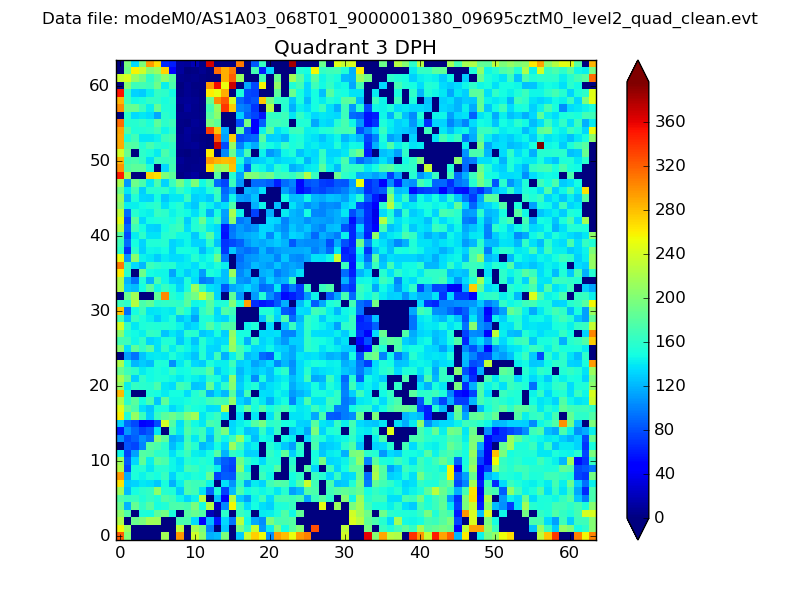 |
 |
Quadrant C |
| Plot type | Count rate plots | Images |
|---|---|---|
| Comparison with Poisson distribution Blue bars denote a histogram of data divided into 1 sec bins. Red curve is a Poisson curve with rate = median count rate of data. |
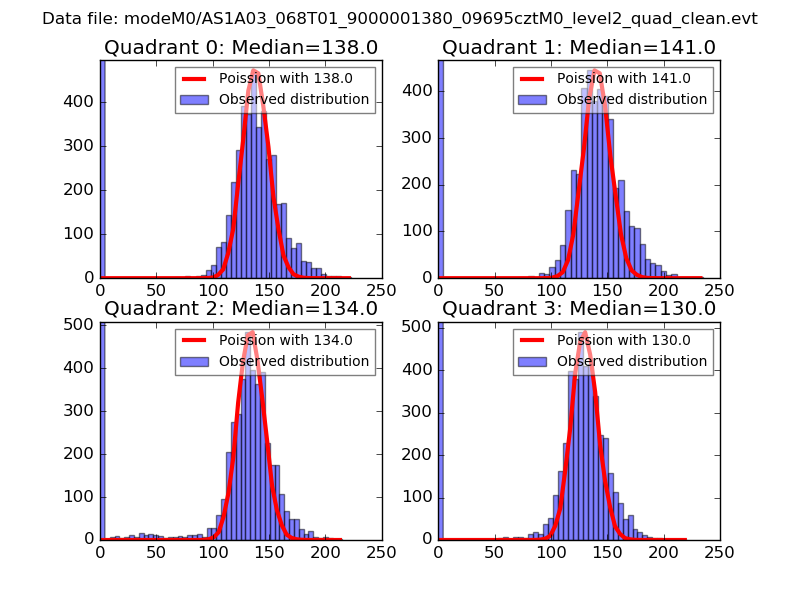 |
 |
| Quadrant-wise count rates Data is divided into 100 sec bins |
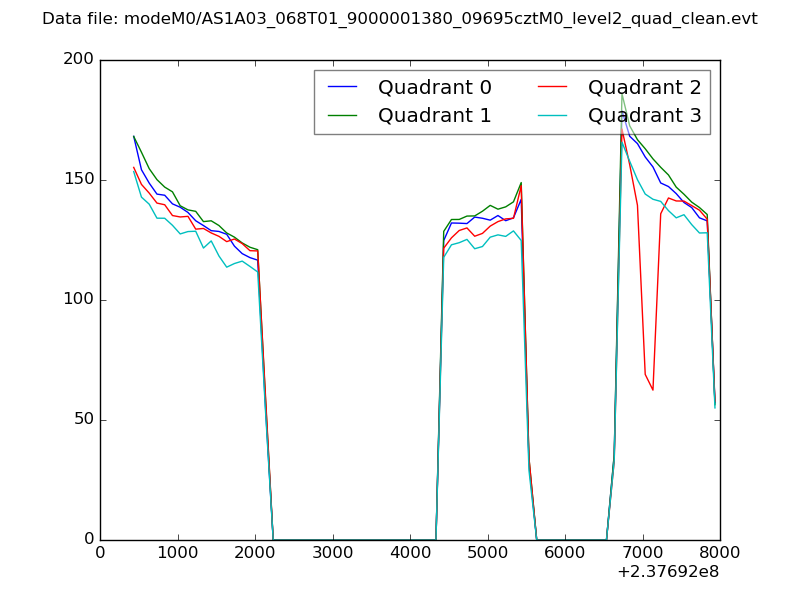 |
|
| Module-wise count rates for Quadrant A Data is divided into 100 sec bins |
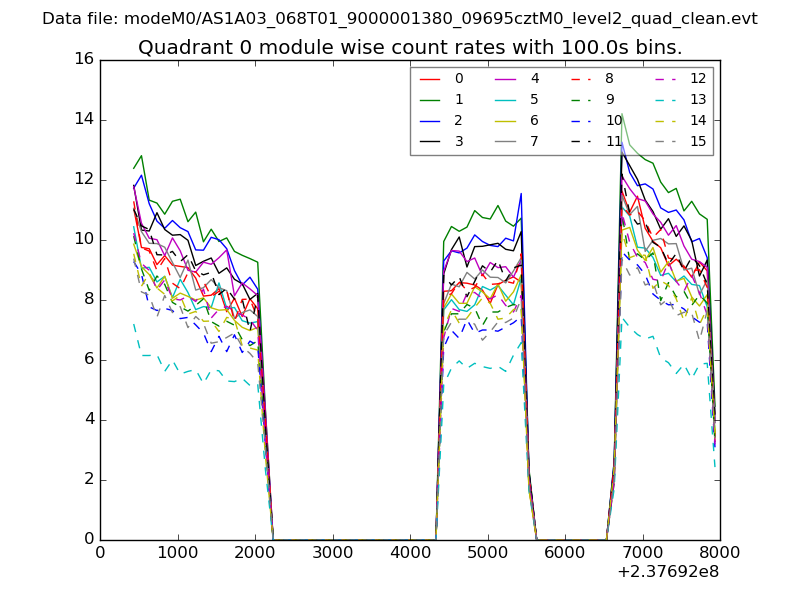 |
 |
| Module-wise count rates for Quadrant B Data is divided into 100 sec bins |
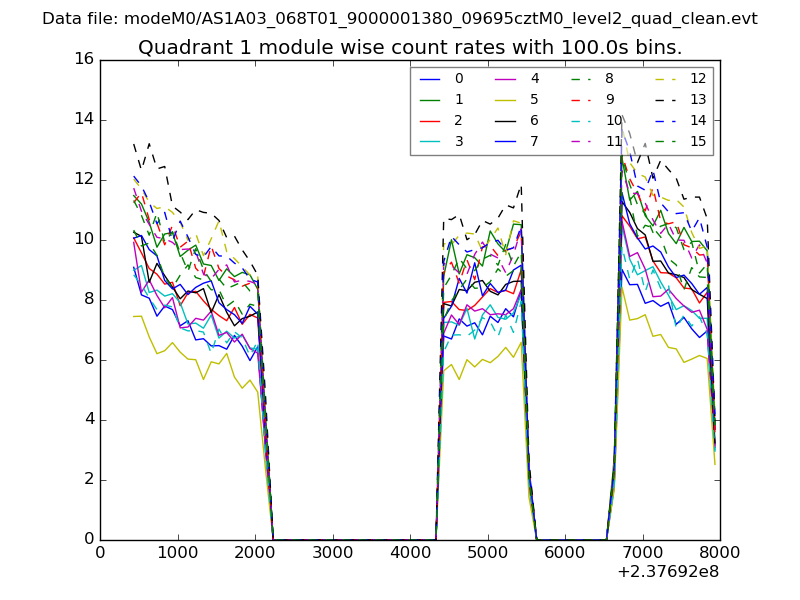 |
 |
| Module-wise count rates for Quadrant C Data is divided into 100 sec bins |
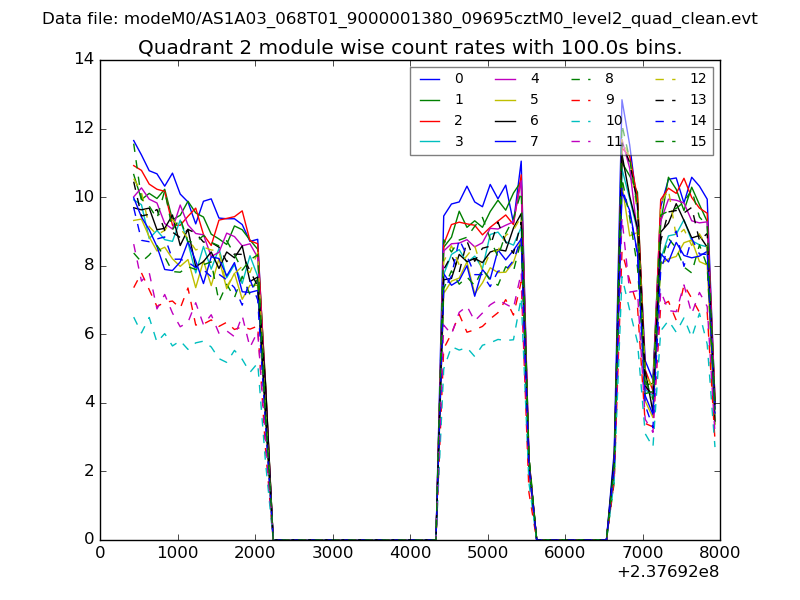 |
 |
| Module-wise count rates for Quadrant D Data is divided into 100 sec bins |
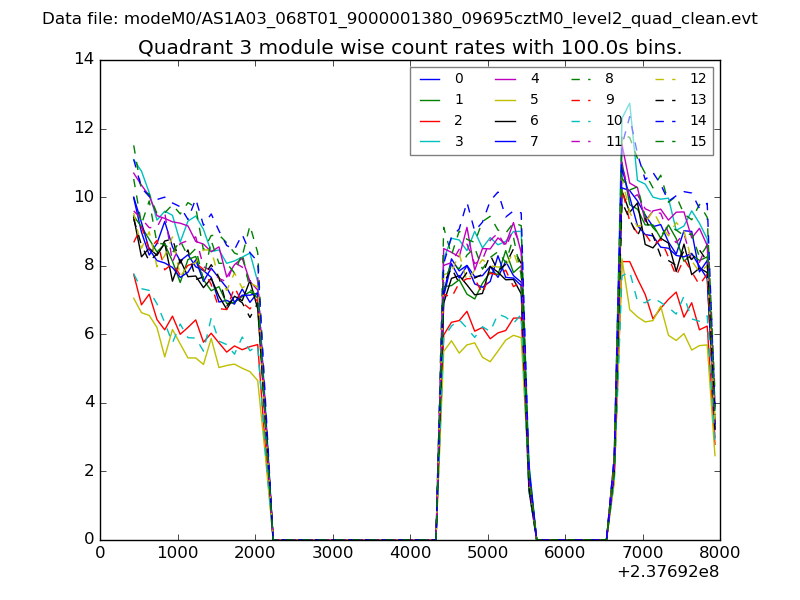 |
 |
| Parameter | Plot |
|---|---|
| CZT HV Monitor | 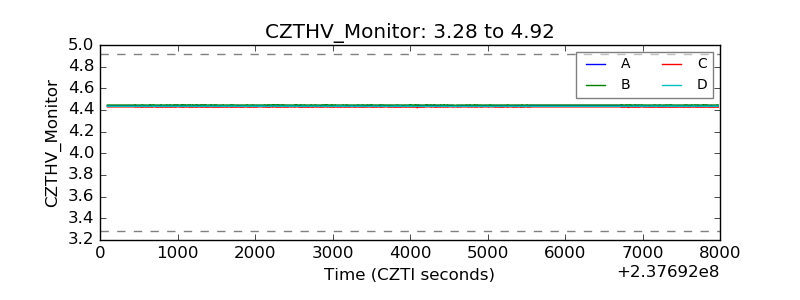 |
| D_VDD | 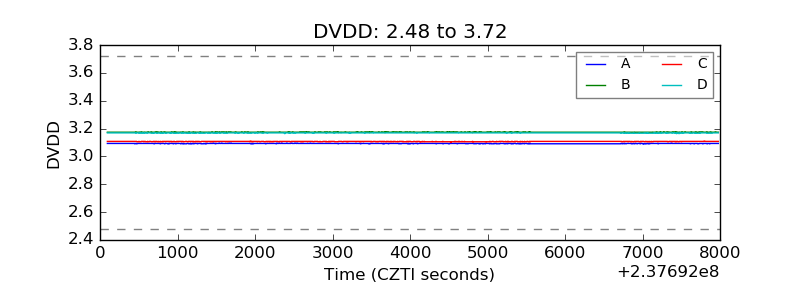 |
| Temperature 1 | 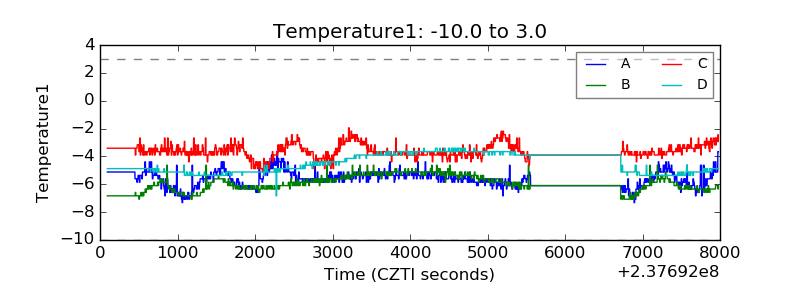 |
| Veto HV Monitor | 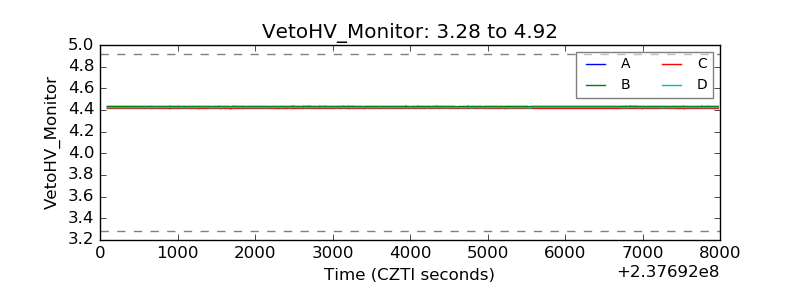 |
| Veto LLD | 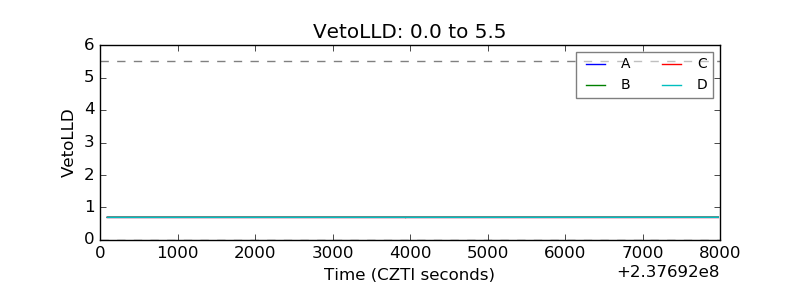 |
| Alpha Counter | 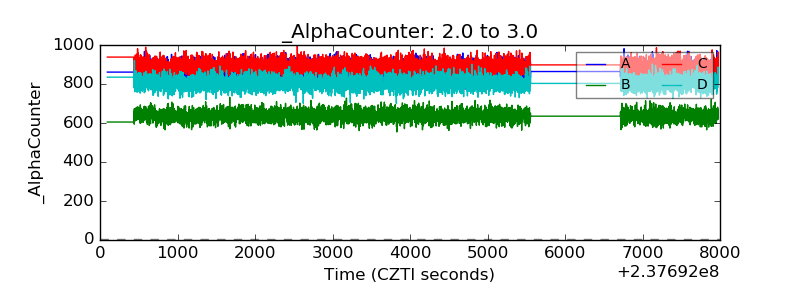 |
| _CPM_Rate | 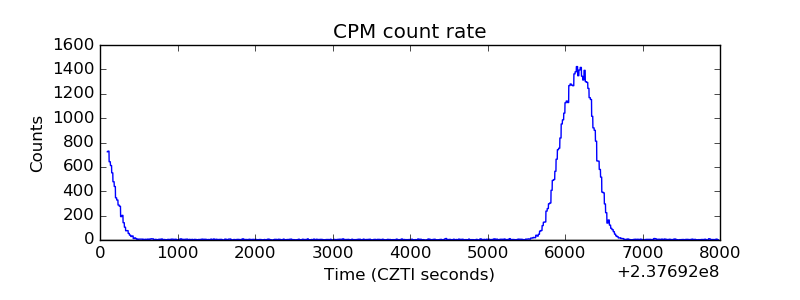 |
| CZT Counter | 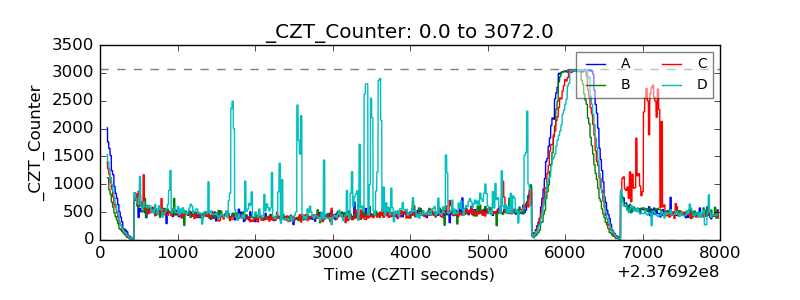 |
| +2.5 Volts monitor |  |
| +5 Volts monitor |  |
| _ROLL_ROT |  |
| _Roll_DEC | 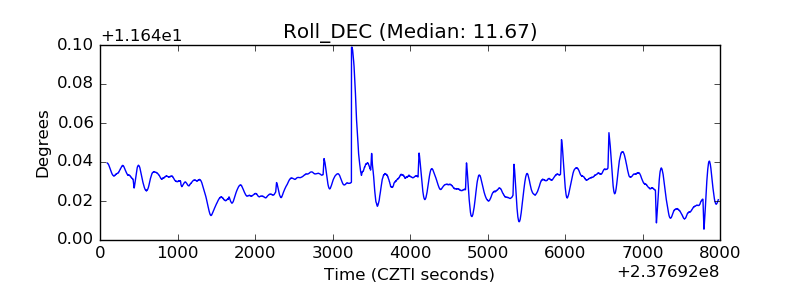 |
| _Roll_RA |  |
| Veto Counter | 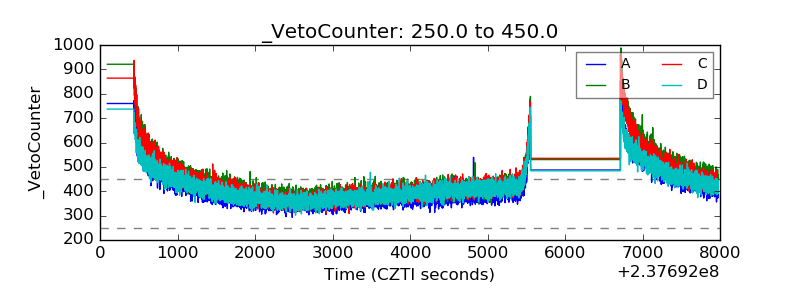 |