| Param | Original file | Final file |
|---|---|---|
| Filename | modeM0/AS1A03_068T01_9000001380_09697cztM0_level2.evt | modeM0/AS1A03_068T01_9000001380_09697cztM0_level2_quad_clean.evt |
| Size (bytes) | 66,660,480 | 10,699,200 |
| Size | 63.6 MB | 10.2 MB |
| Events in quadrant A | 510,745 | 70,246 |
| Events in quadrant B | 500,647 | 69,438 |
| Events in quadrant C | 499,256 | 67,590 |
| Events in quadrant D | 438,140 | 40,996 |
| Mode M9 | |||
|---|---|---|---|
| Quadrant | BADHDUFLAG | Total packets | Discarded packets |
| A | 0 | 17 | 12 |
| B | 0 | 17 | 13 |
| C | 0 | 17 | 13 |
| D | 0 | 19 | 14 |
| Mode SS | |||
|---|---|---|---|
| Quadrant | BADHDUFLAG | Total packets | Discarded packets |
| A | 0 | 123 | 107 |
| B | 0 | 122 | 97 |
| C | 0 | 123 | 99 |
| D | 0 | 125 | 95 |
| Mode M0 | |||
|---|---|---|---|
| Quadrant | BADHDUFLAG | Total packets | Discarded packets |
| A | 0 | 12839 | 10718 |
| B | 0 | 12822 | 10744 |
| C | 0 | 13469 | 11332 |
| D | 0 | 20045 | 18303 |
| Quadrant | Total seconds | Saturated seconds | Saturation percentage |
|---|---|---|---|
| A | 1042 | 12 | 1.151631% |
| B | 1019 | 12 | 1.177625% |
| C | 1044 | 8 | 0.766284% |
| D | 716 | 26 | 3.631285% |
Noise dominated data is calculated using 1-second bins in cleaned event files. If a bin has >2000 counts, and if more than 50% of those come from <1% of pixels, then it is considered to be noise-dominated and hence unusable.
| Quadrant | # 1 sec bins | Bins with >0 counts | Bins with >2000 counts | High rate bins dominated by noise | Noise dominated (total time) | Noise dominated (detector-on time) | Marked lightcurve |
|---|---|---|---|---|---|---|---|
| A | 7079 | 1719 | 0 | 0 | 0.00% | 0.00% |  |
| B | 7225 | 1691 | 0 | 0 | 0.00% | 0.00% | 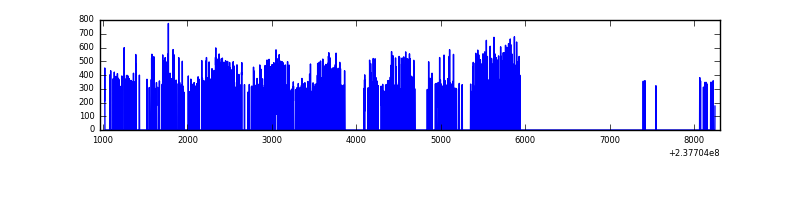 |
| C | 7246 | 1712 | 0 | 0 | 0.00% | 0.00% |  |
| D | 7288 | 1231 | 1 | 1 | 0.01% | 0.08% | 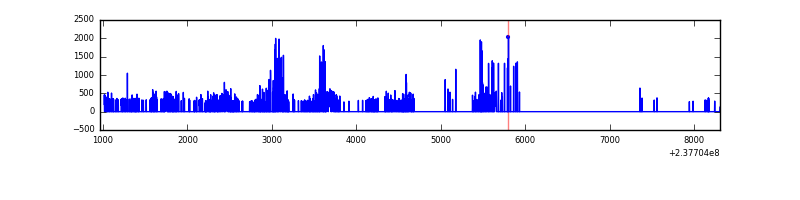 |
Top three noisy pixels from each quadrant. If the there are fewer than three noisy pixels in the level2.evt file, extra rows are filled as -1
| Pixel properties | Quadrant properties | ||||||
|---|---|---|---|---|---|---|---|
| Quadrant | DetID | PixID | Counts | Sigma | Mean | Median | Sigma |
| A | 0 | 226 | 1164 | 35.6 | 132 | 130 | 29.0 |
| A | 12 | 194 | 1053 | 31.77 | 132 | 130 | 29.0 |
| A | 3 | 137 | 625 | 17.04 | 132 | 130 | 29.0 |
| B | 12 | 111 | 2869 | 103.37 | 128 | 126 | 26.5 |
| B | 11 | 111 | 2303 | 82.04 | 128 | 126 | 26.5 |
| B | 14 | 111 | 1881 | 66.13 | 128 | 126 | 26.5 |
| C | 14 | 234 | 8508 | 270.68 | 125 | 125 | 31.0 |
| C | 13 | 61 | 987 | 27.83 | 125 | 125 | 31.0 |
| C | 14 | 238 | 466 | 11.01 | 125 | 125 | 31.0 |
| D | 1 | 52 | 115034 | 4896.05 | 84 | 82 | 23.5 |
| D | 2 | 234 | 2276 | 93.45 | 84 | 82 | 23.5 |
| D | 8 | 195 | 2104 | 86.12 | 84 | 82 | 23.5 |
Histogram calculated using DETX and DETY for each event in the final _common_clean file
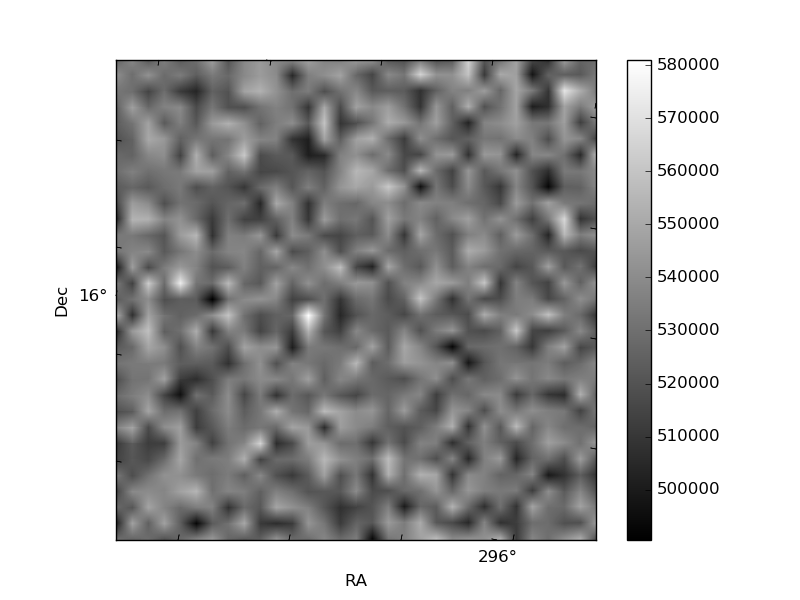
| Quadrant A | 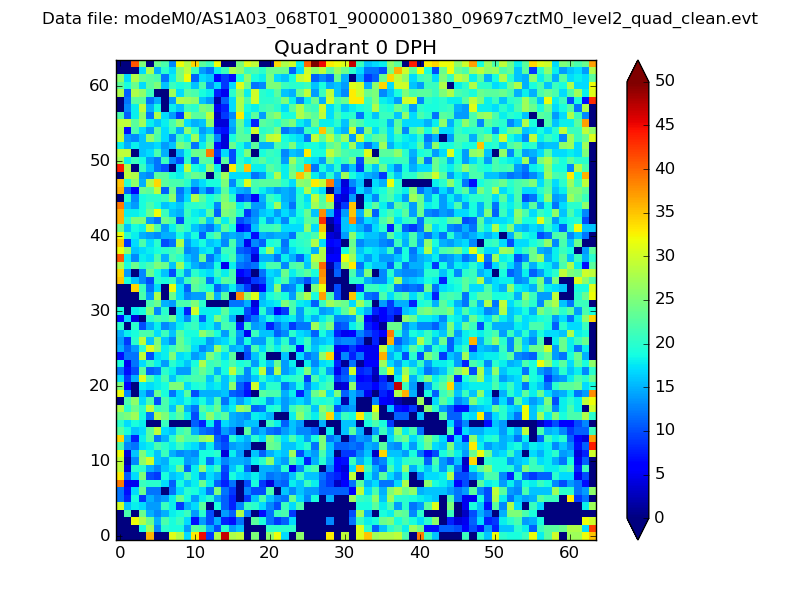 |
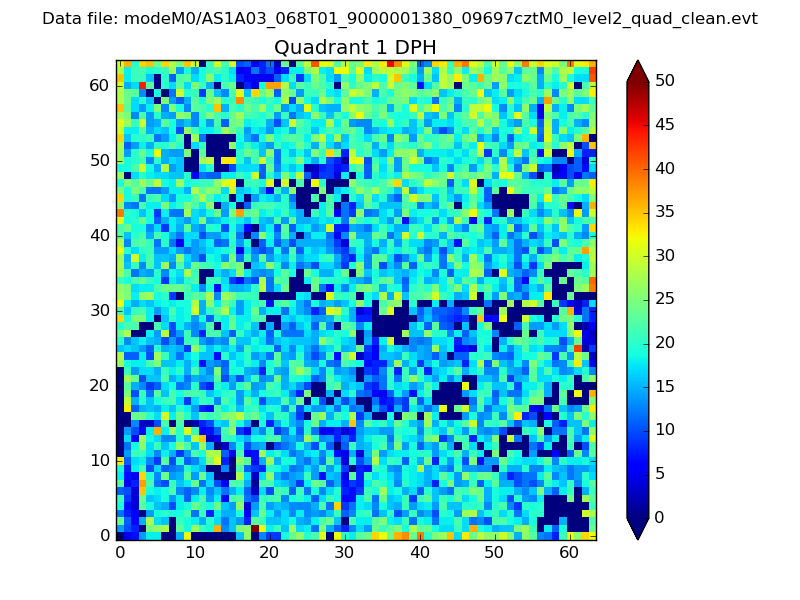 |
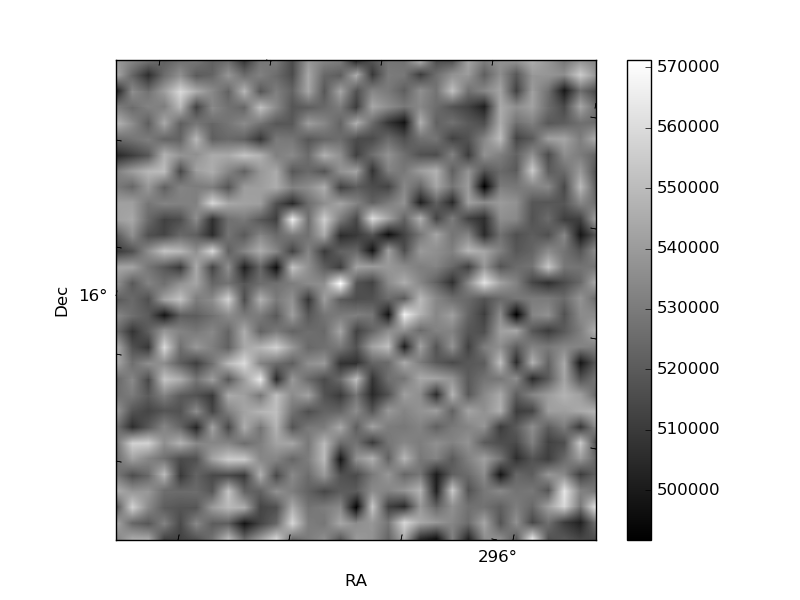
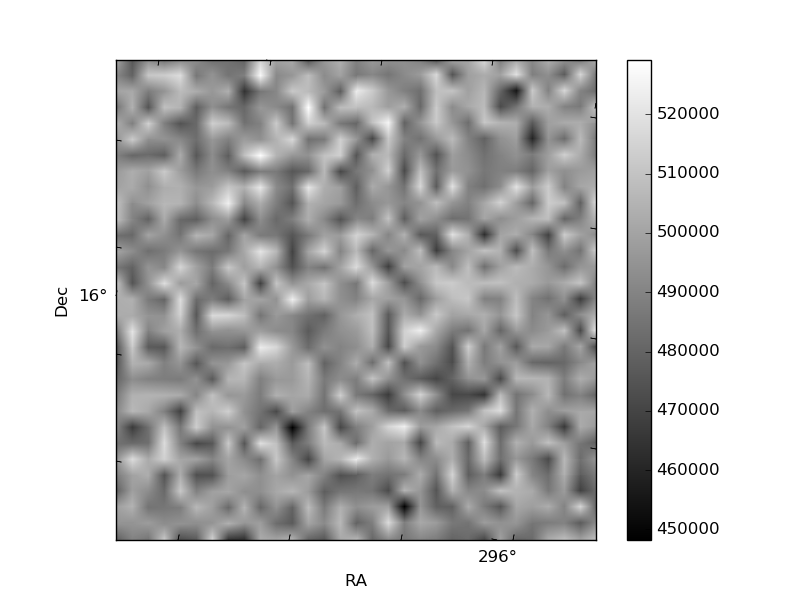
Quadrant B |
|---|---|---|---|
| Quadrant D |  |
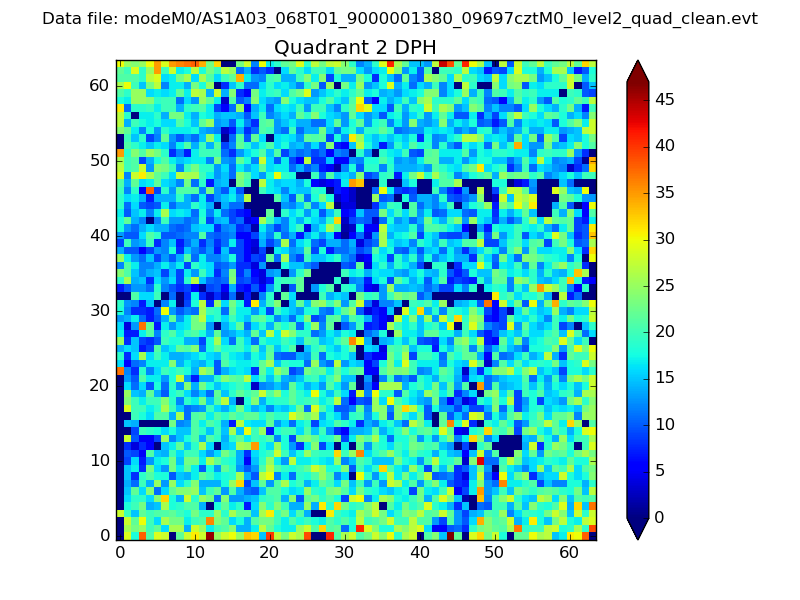 |
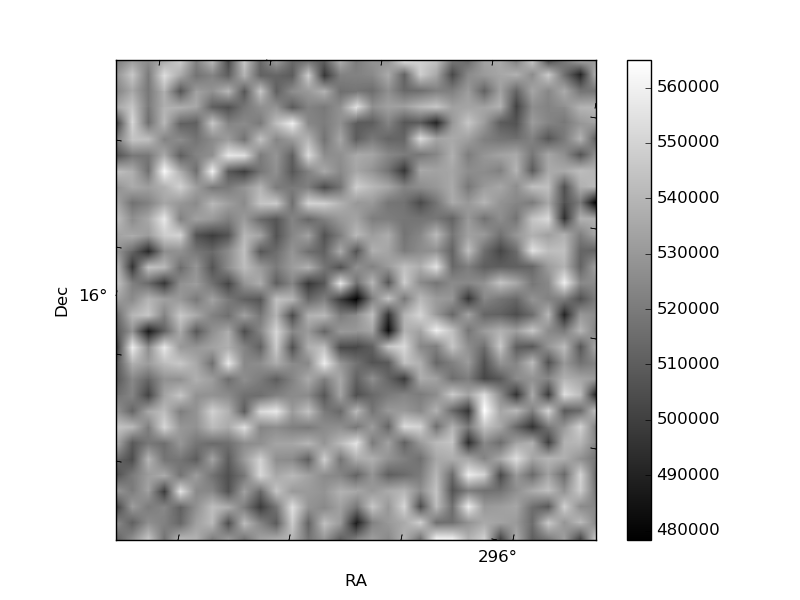
Quadrant C |
| Plot type | Count rate plots | Images |
|---|---|---|
| Comparison with Poisson distribution Blue bars denote a histogram of data divided into 1 sec bins. Red curve is a Poisson curve with rate = median count rate of data. |
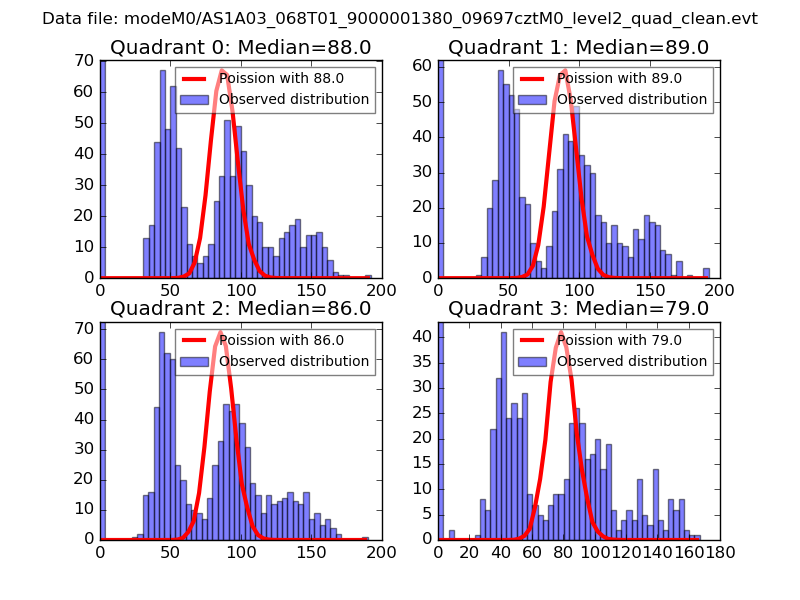 |
 |
| Quadrant-wise count rates Data is divided into 100 sec bins |
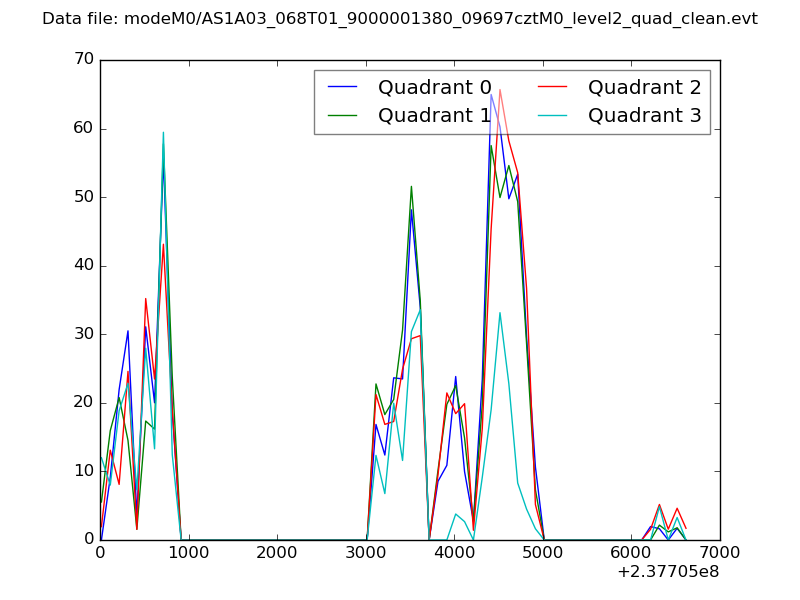 |
|
| Module-wise count rates for Quadrant A Data is divided into 100 sec bins |
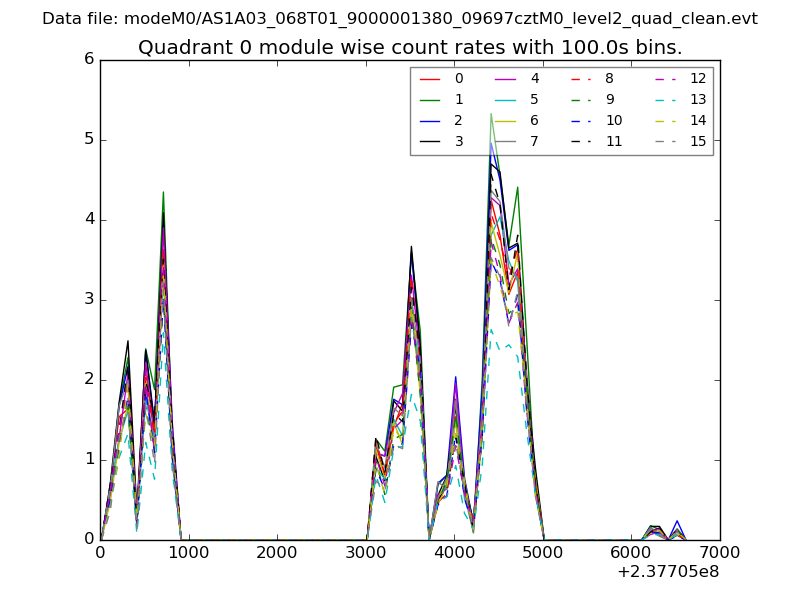 |
 |
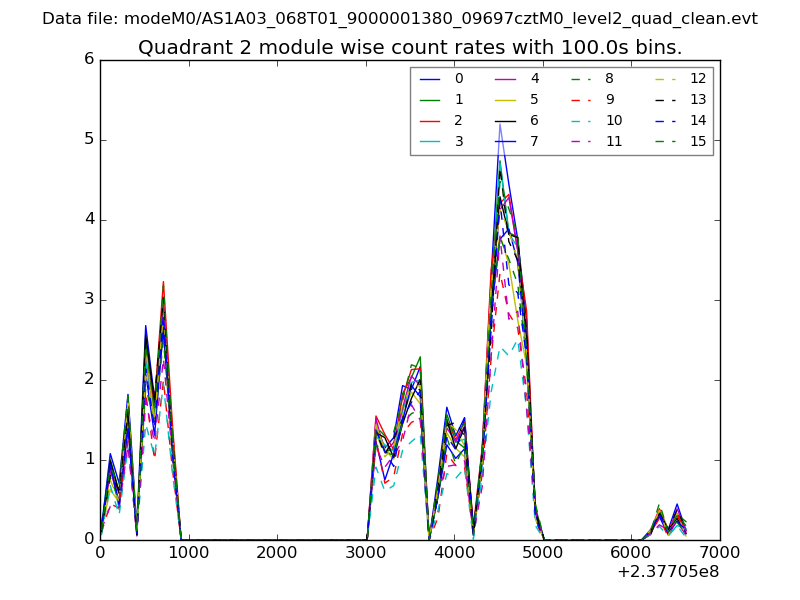
| Module-wise count rates for Quadrant B Data is divided into 100 sec bins |
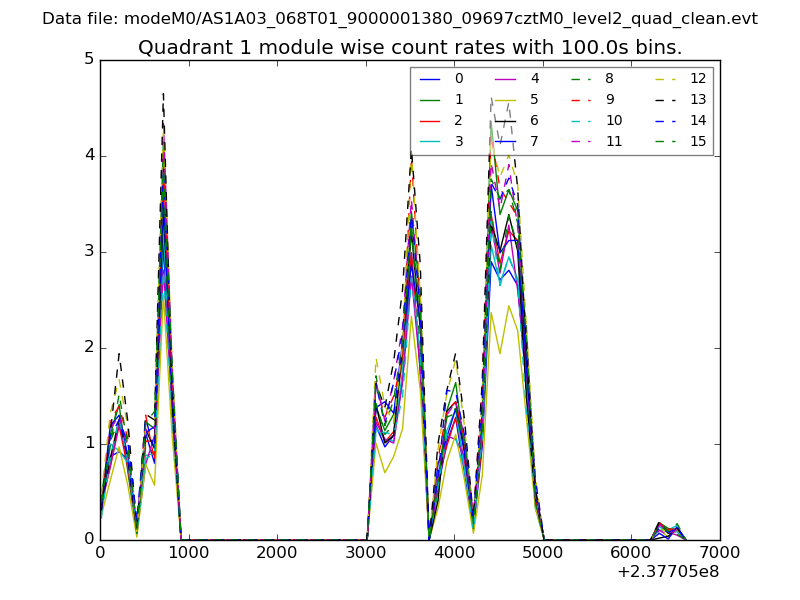 |
 |
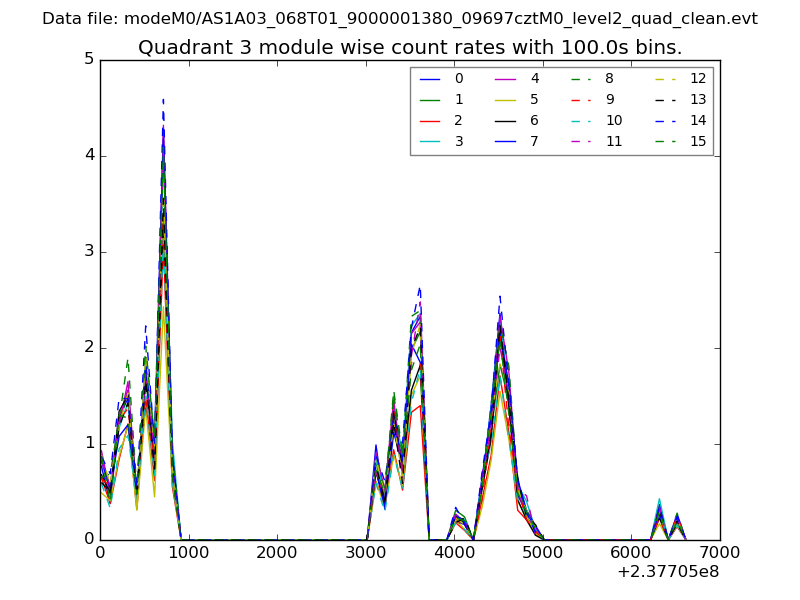
| Module-wise count rates for Quadrant C Data is divided into 100 sec bins |
 |
 |
| Module-wise count rates for Quadrant D Data is divided into 100 sec bins |
 |
 |
| Parameter | Plot |
|---|---|
| CZT HV Monitor | 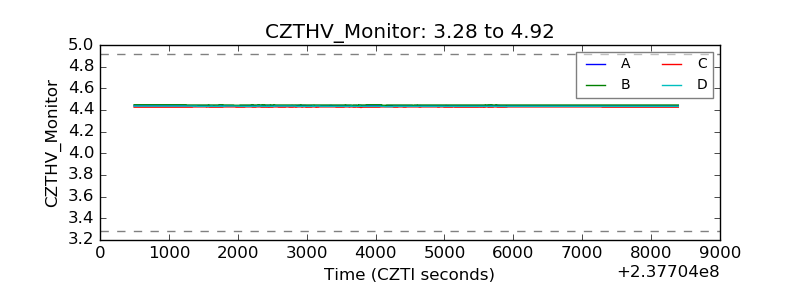 |
| D_VDD | 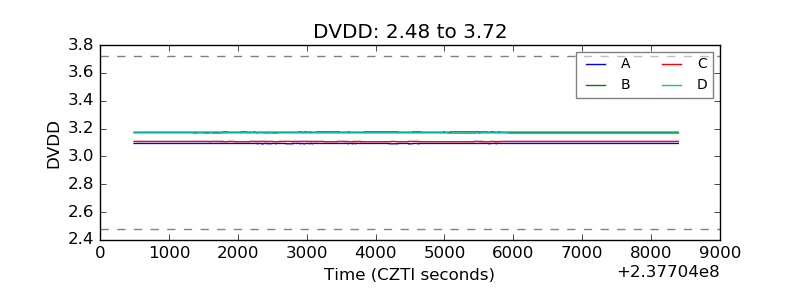 |
| Temperature 1 | 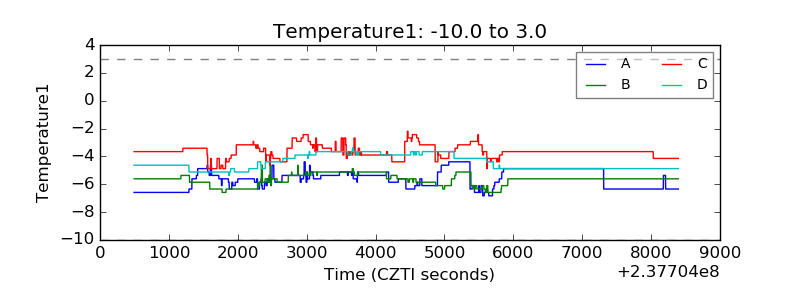 |
| Veto HV Monitor | 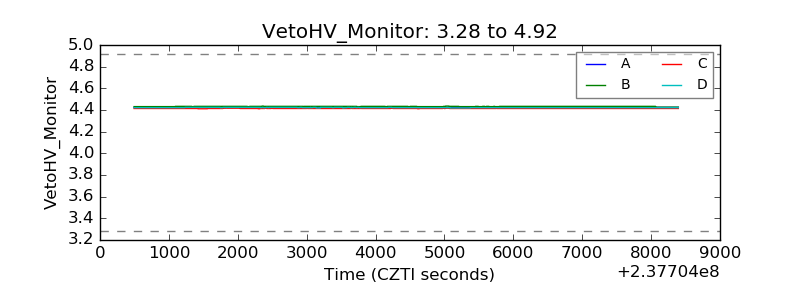 |
| Veto LLD | 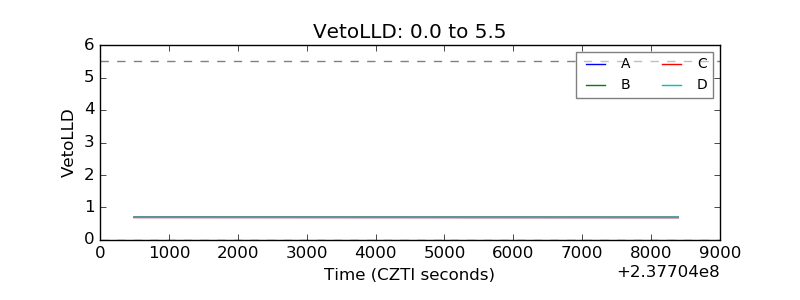 |
| Alpha Counter | 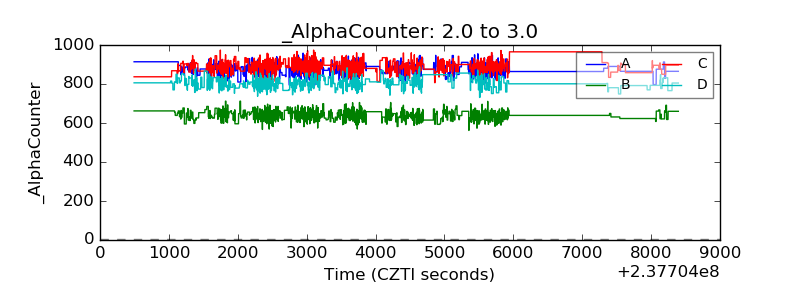 |
| _CPM_Rate | 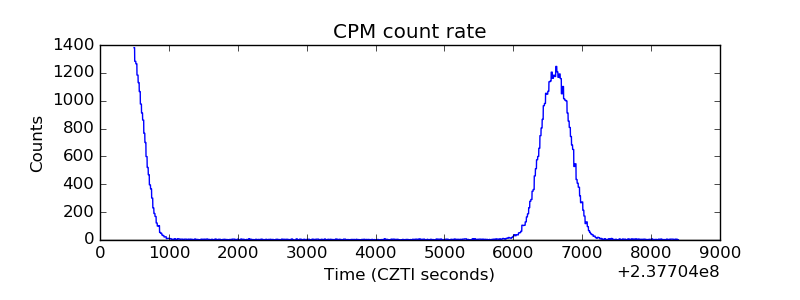 |
| CZT Counter |  |
| +2.5 Volts monitor |  |
| +5 Volts monitor |  |
| _ROLL_ROT | 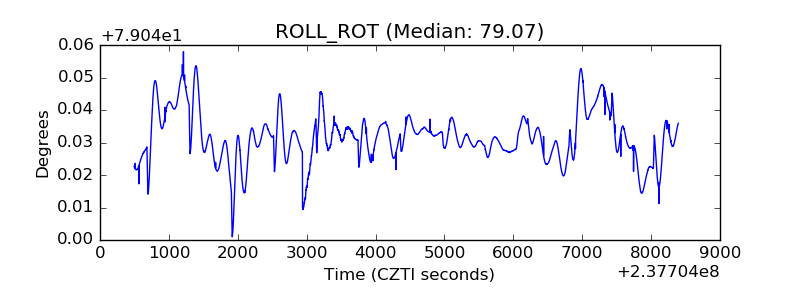 |
| _Roll_DEC | 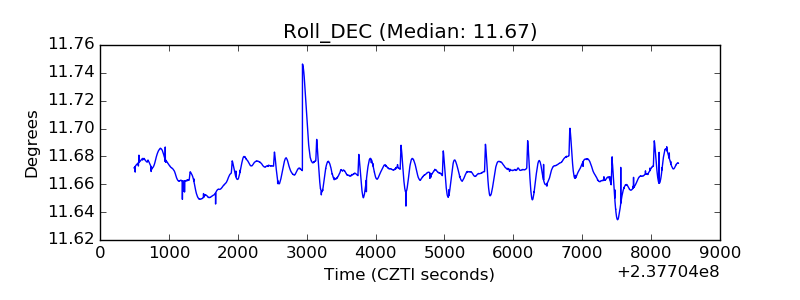 |
| _Roll_RA | 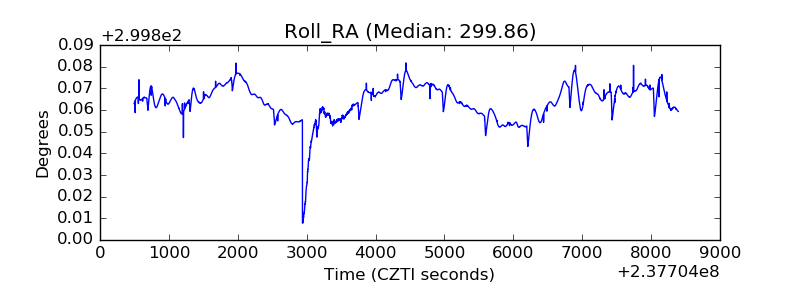 |
| Veto Counter | 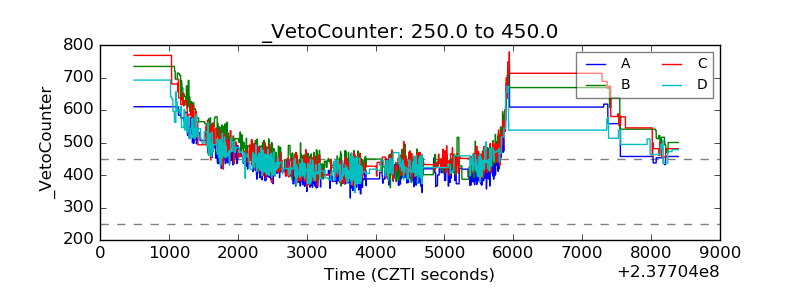 |