| Param | Original file | Final file |
|---|---|---|
| Filename | modeM0/AS1T01_176T01_9000001378cztM0_level2.fits | modeM0/AS1T01_176T01_9000001378cztM0_level2_quad_clean.evt |
| Size (bytes) | 157,086,720 | 154,892,160 |
| Size | 149.8 MB | 147.7 MB |
| Events in quadrant A | 947,296 | 926,352 |
| Events in quadrant B | 909,310 | 919,119 |
| Events in quadrant C | 931,902 | 878,795 |
| Events in quadrant D | 807,450 | 805,105 |
| Mode M0 | |||
|---|---|---|---|
| Quadrant | BADHDUFLAG | Total packets | Discarded packets |
| A | 0 | 35001 | 0 |
| B | 0 | 36264 | 0 |
| C | 0 | 37755 | 0 |
| D | 0 | 42153 | 0 |
| Mode SS | |||
|---|---|---|---|
| Quadrant | BADHDUFLAG | Total packets | Discarded packets |
| A | 0 | 344 | 0 |
| B | 0 | 344 | 0 |
| C | 0 | 342 | 0 |
| D | 0 | 344 | 0 |
| Mode M9 | |||
|---|---|---|---|
| Quadrant | BADHDUFLAG | Total packets | Discarded packets |
| A | 0 | 11 | 0 |
| B | 0 | 11 | 0 |
| C | 0 | 11 | 0 |
| D | 0 | 11 | 0 |
| Quadrant | Total seconds | Saturated seconds | Saturation percentage |
|---|---|---|---|
| A | 16841 | 456 | 2.707678% |
| B | 16842 | 483 | 2.867830% |
| C | 16833 | 281 | 1.669340% |
| D | 16831 | 416 | 2.471630% |
Noise dominated data is calculated using 1-second bins in cleaned event files. If a bin has >2000 counts, and if more than 50% of those come from <1% of pixels, then it is considered to be noise-dominated and hence unusable.
| Quadrant | # 1 sec bins | Bins with >0 counts | Bins with >2000 counts | High rate bins dominated by noise | Noise dominated (total time) | Noise dominated (detector-on time) | Marked lightcurve |
|---|---|---|---|---|---|---|---|
| A | 17980 | 16881 | 0 | 0 | 0.00% | 0.00% | 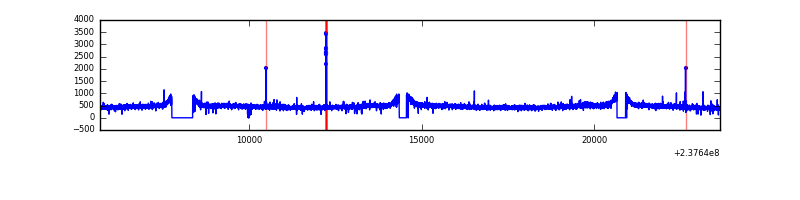 |
| B | 17980 | 16881 | 0 | 0 | 0.00% | 0.00% | 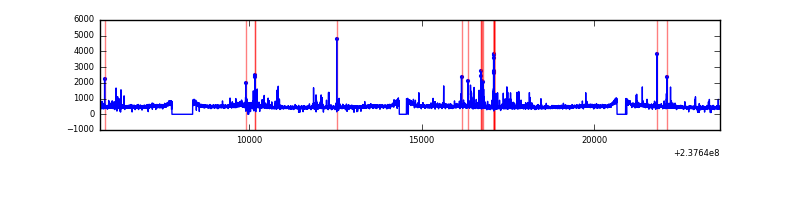 |
| C | 17980 | 16884 | 0 | 0 | 0.00% | 0.00% | 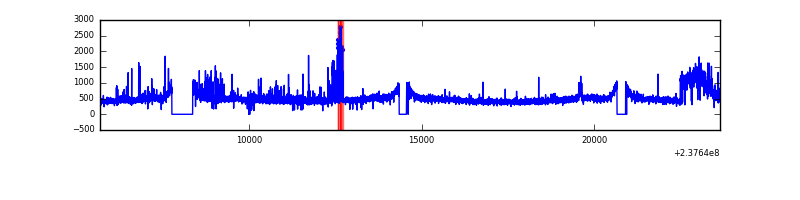 |
| D | 17980 | 16882 | 0 | 0 | 0.00% | 0.00% | 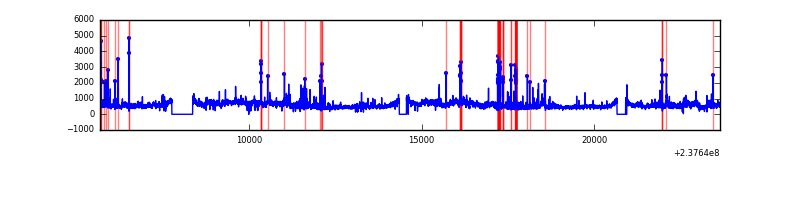 |
Top three noisy pixels from each quadrant. If the there are fewer than three noisy pixels in the level2.evt file, extra rows are filled as -1
| Pixel properties | Quadrant properties | ||||||
|---|---|---|---|---|---|---|---|
| Quadrant | DetID | PixID | Counts | Sigma | Mean | Median | Sigma |
| A | 14 | 188 | 964 | 11.2 | 246 | 229 | 65.6 |
| A | 0 | 29 | 912 | 10.41 | 246 | 229 | 65.6 |
| A | 7 | 110 | 812 | 8.89 | 246 | 229 | 65.6 |
| B | 2 | 9 | 762 | 10.76 | 239 | 228 | 49.6 |
| B | 3 | 17 | 658 | 8.67 | 239 | 228 | 49.6 |
| B | 14 | 254 | 617 | 7.84 | 239 | 228 | 49.6 |
| C | 1 | 81 | 779 | 8.32 | 246 | 226 | 66.5 |
| C | 1 | 80 | 744 | 7.79 | 246 | 226 | 66.5 |
| C | 12 | 241 | 650 | 6.38 | 246 | 226 | 66.5 |
| D | 3 | 14 | 603 | 6.22 | 229 | 208 | 63.5 |
| D | 6 | 231 | 584 | 5.92 | 229 | 208 | 63.5 |
| D | 1 | 19 | 575 | 5.78 | 229 | 208 | 63.5 |
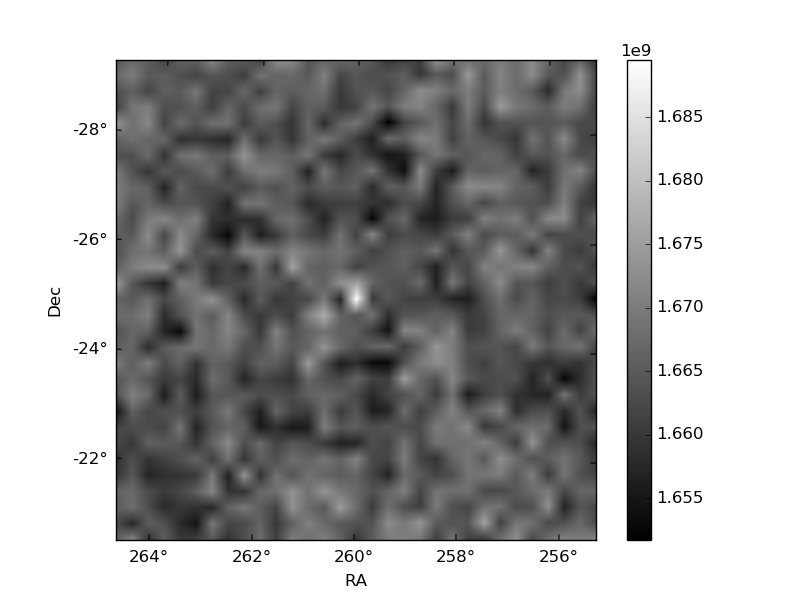
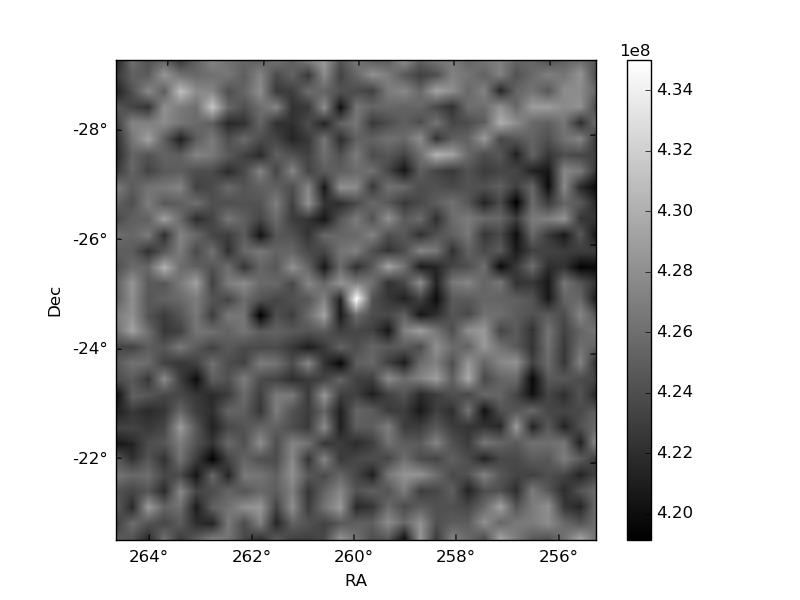
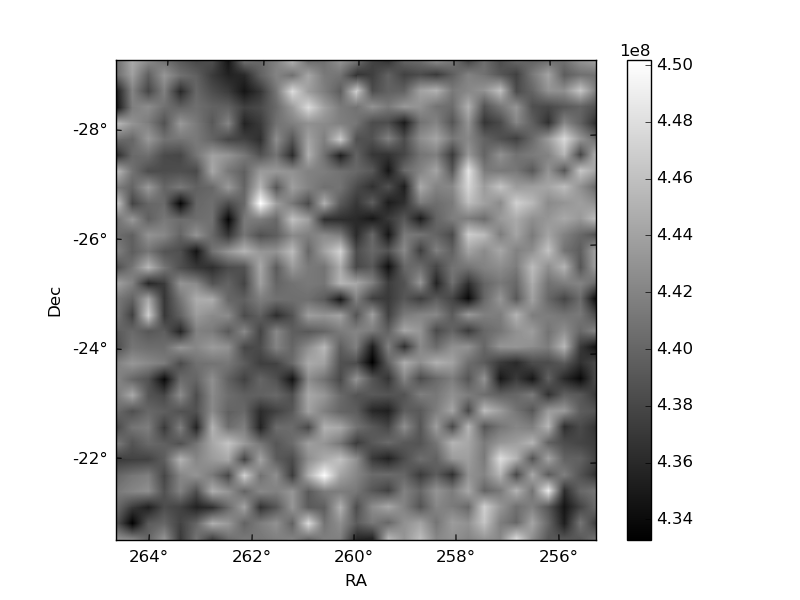
Histogram calculated using DETX and DETY for each event in the final _common_clean file
| Quadrant A | 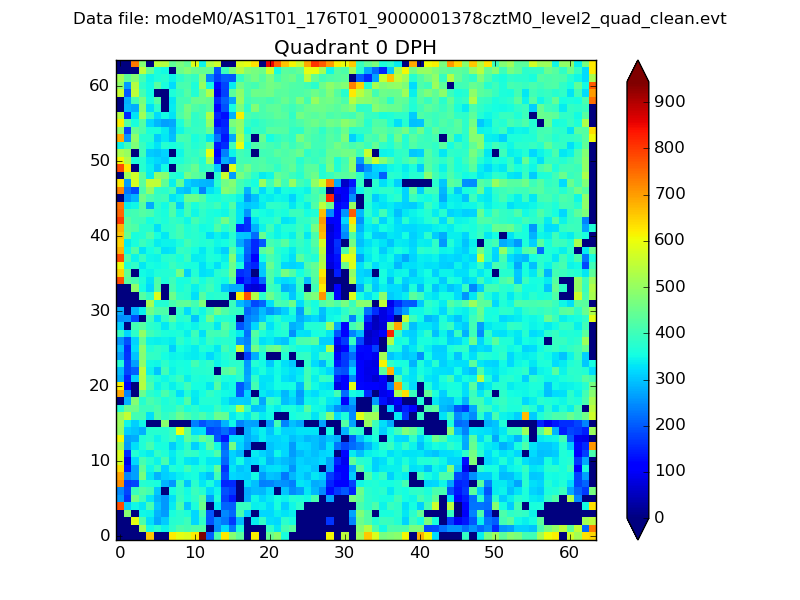 |
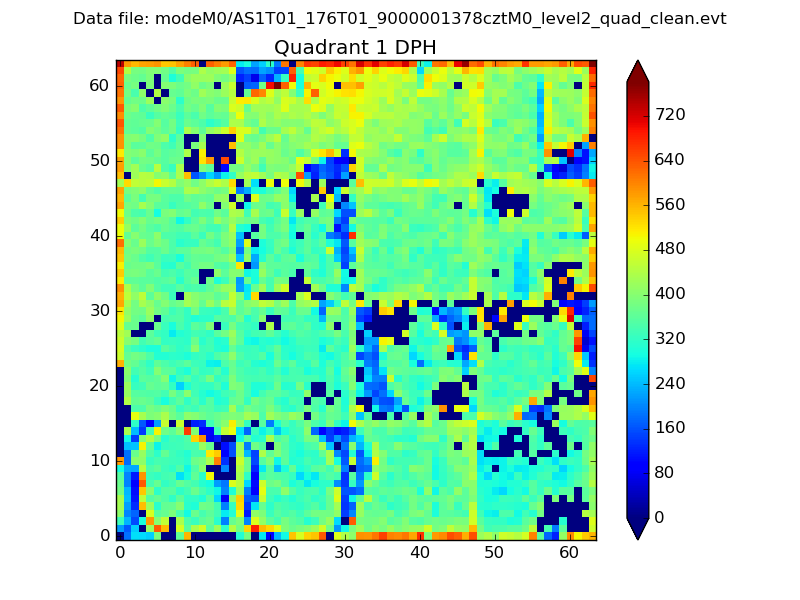 |
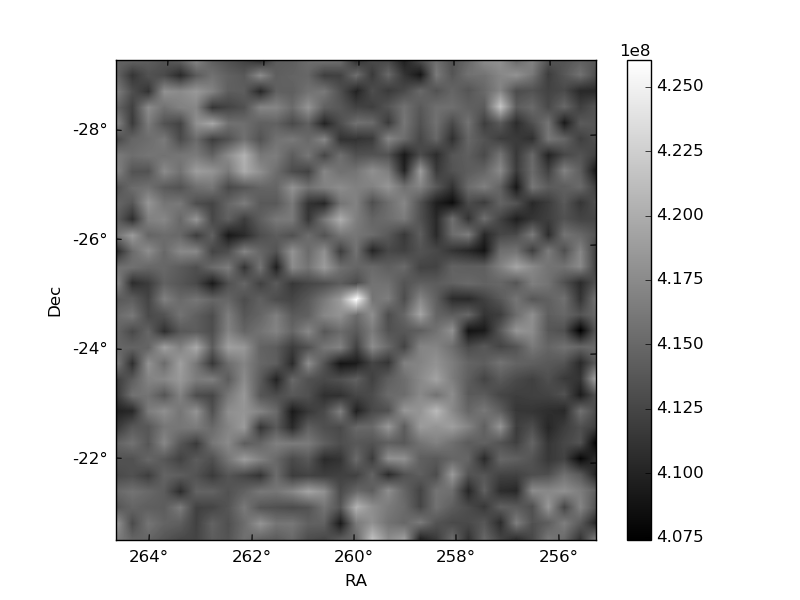
Quadrant B |
|---|---|---|---|
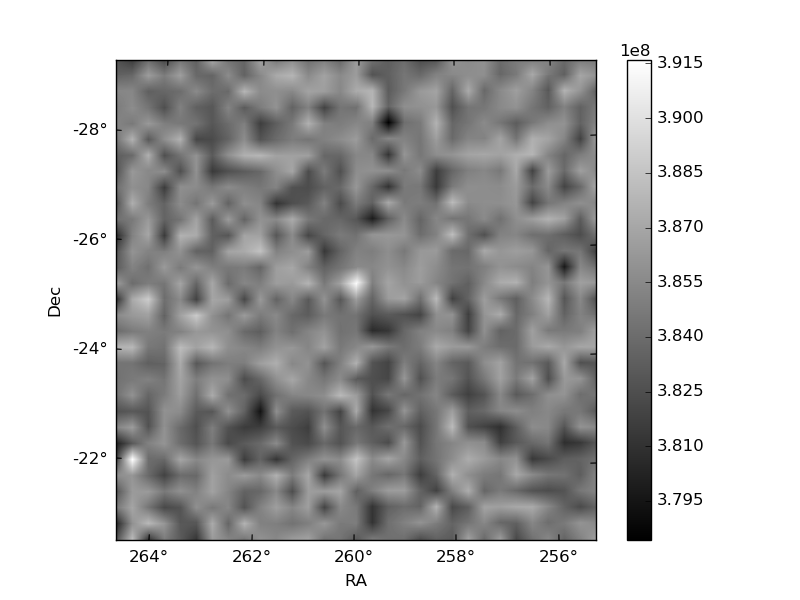
| Quadrant D | 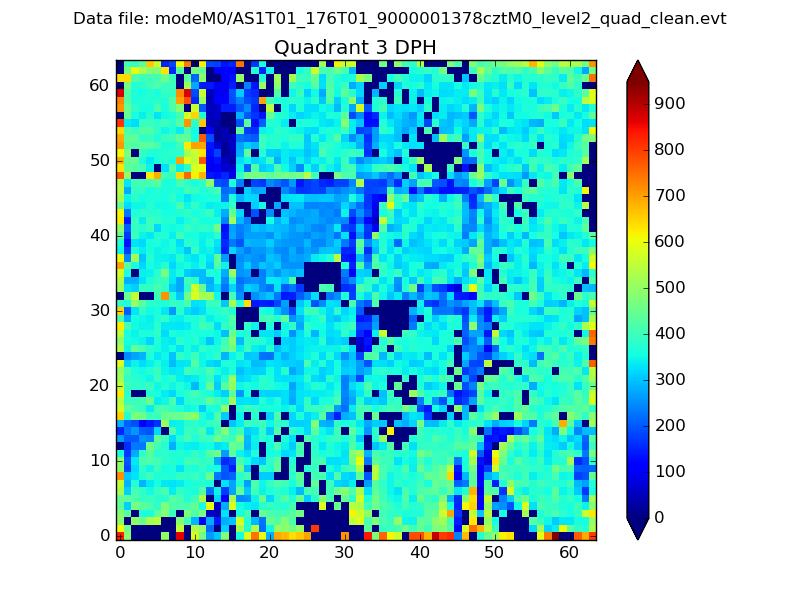 |
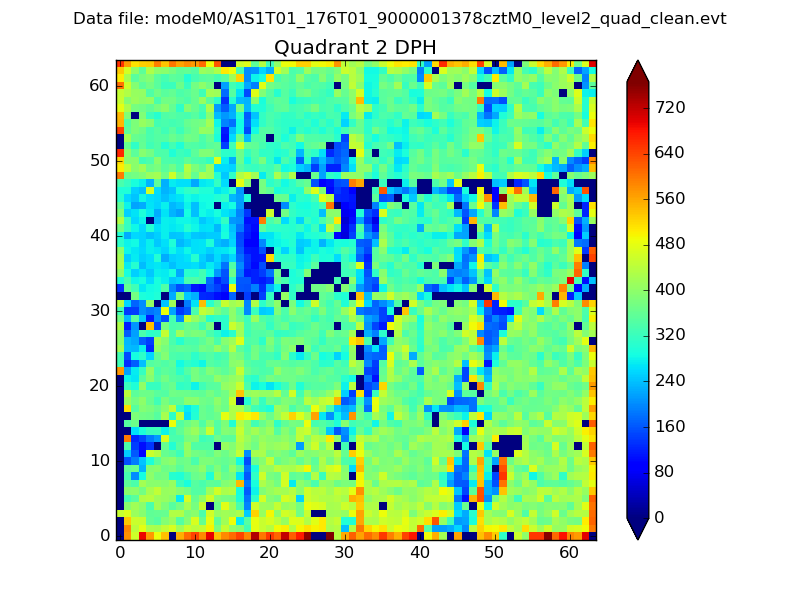 |
Quadrant C |
| Plot type | Count rate plots | Images |
|---|---|---|
| Comparison with Poisson distribution Blue bars denote a histogram of data divided into 1 sec bins. Red curve is a Poisson curve with rate = median count rate of data. |
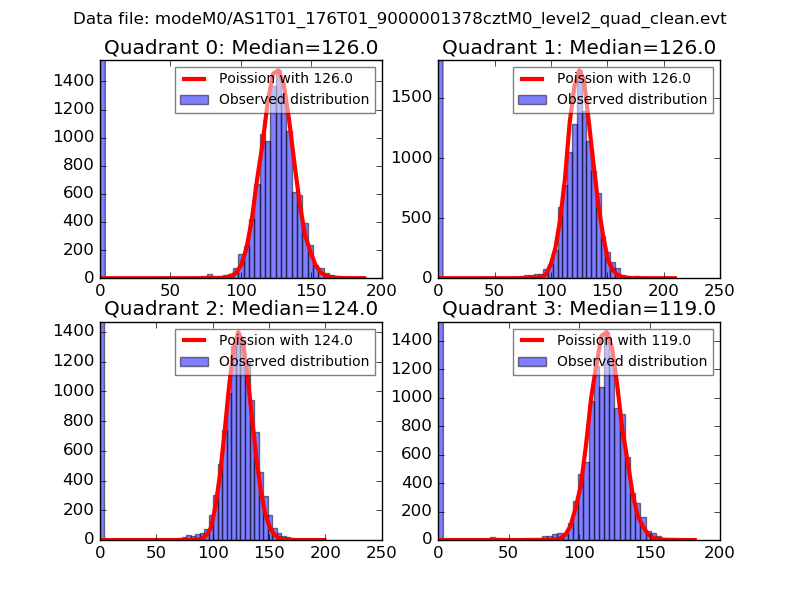 |
 |
| Quadrant-wise count rates Data is divided into 100 sec bins |
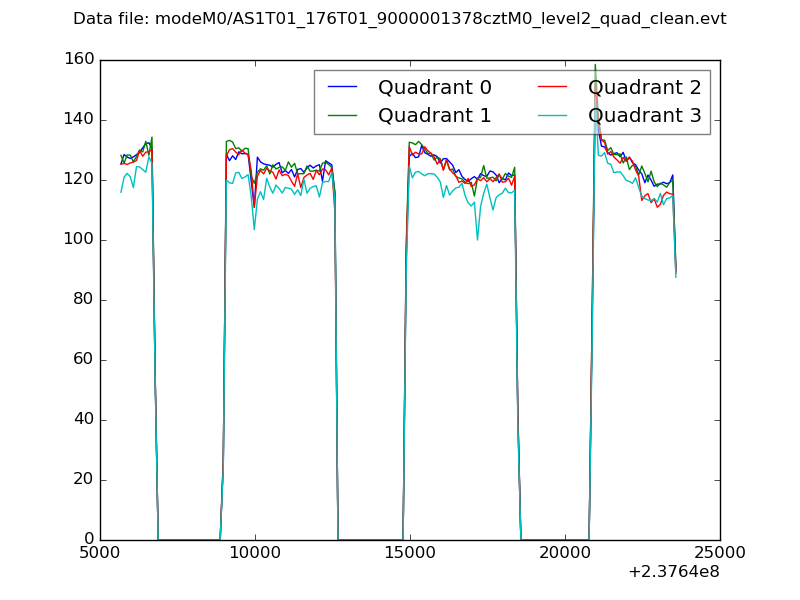 |
|
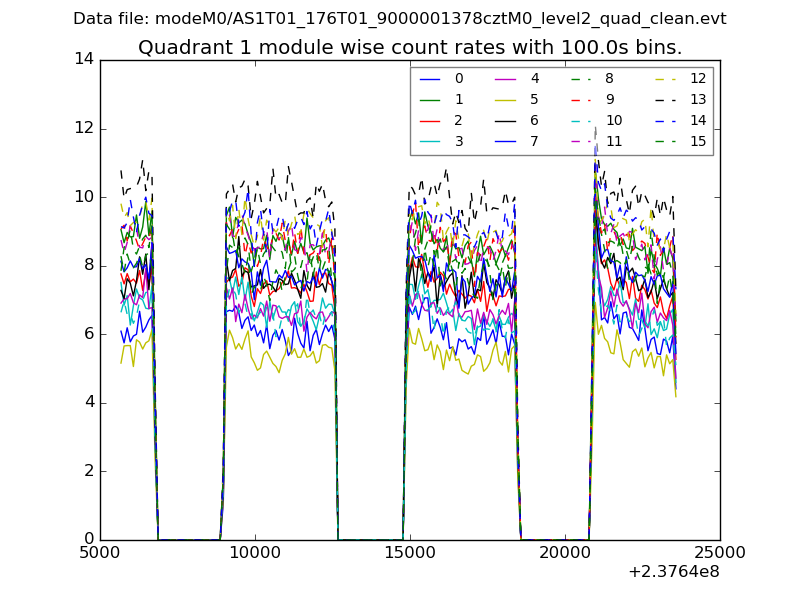
| Module-wise count rates for Quadrant A Data is divided into 100 sec bins |
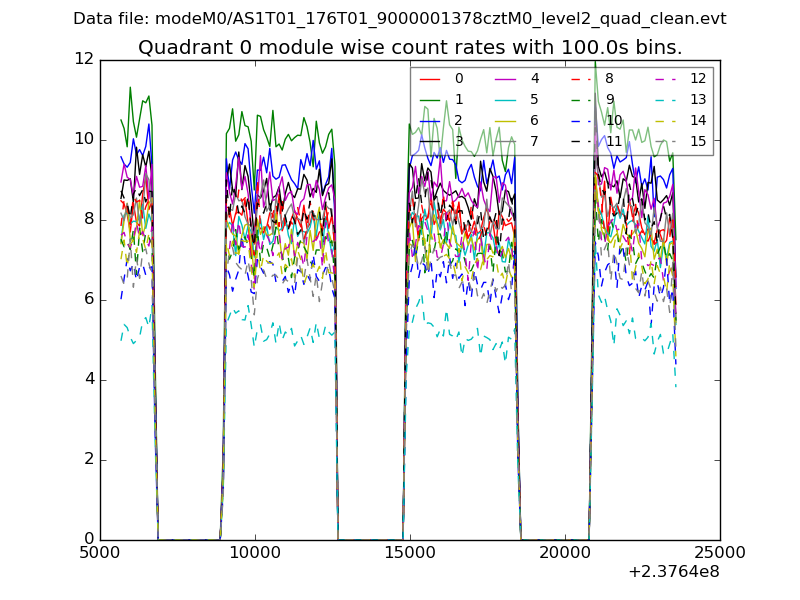 |
 |
| Module-wise count rates for Quadrant B Data is divided into 100 sec bins |
 |
 |
| Module-wise count rates for Quadrant C Data is divided into 100 sec bins |
 |
 |
| Module-wise count rates for Quadrant D Data is divided into 100 sec bins |
 |
 |
| Parameter | Plot |
|---|---|
| CZT HV Monitor | 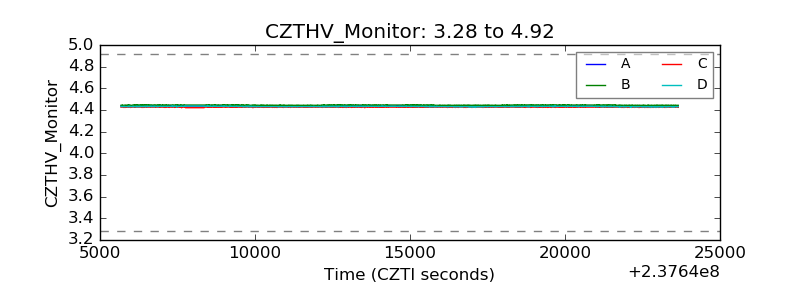 |
| D_VDD | 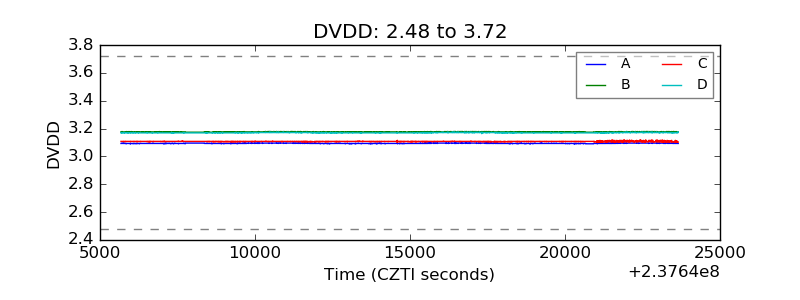 |
| Temperature 1 | 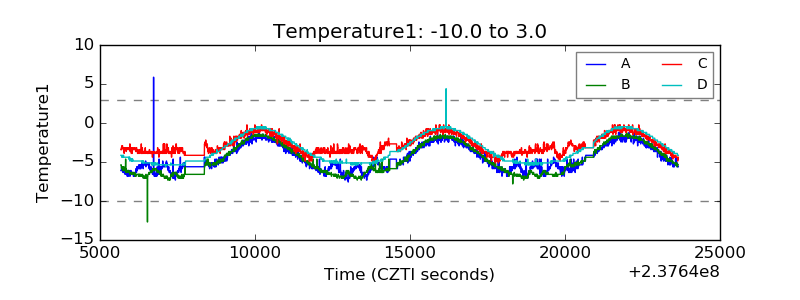 |
| Veto HV Monitor |  |
| Veto LLD | 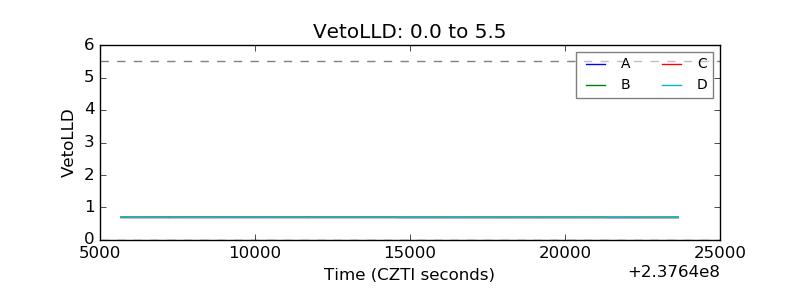 |
| Alpha Counter | 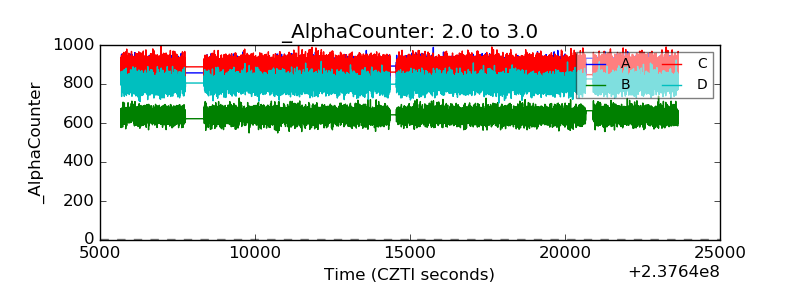 |
| _CPM_Rate | 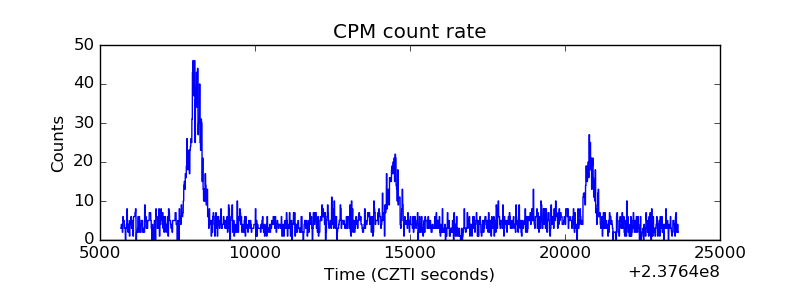 |
| CZT Counter | 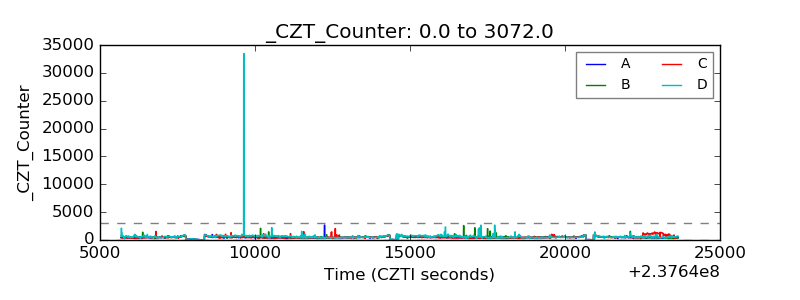 |
| +2.5 Volts monitor | 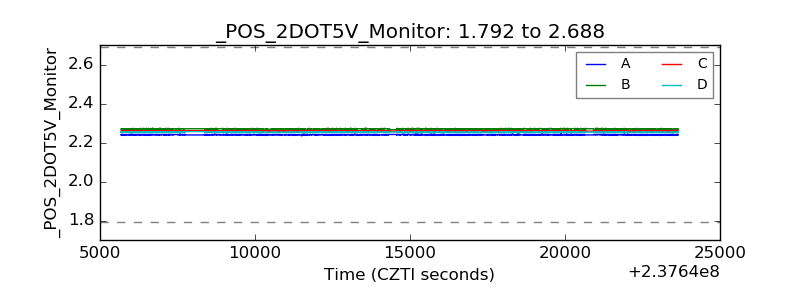 |
| +5 Volts monitor | 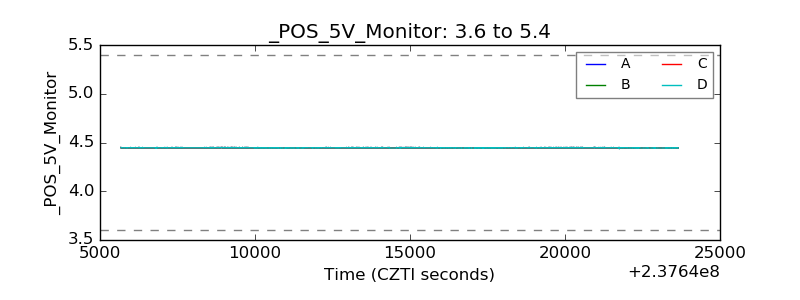 |
| _ROLL_ROT | 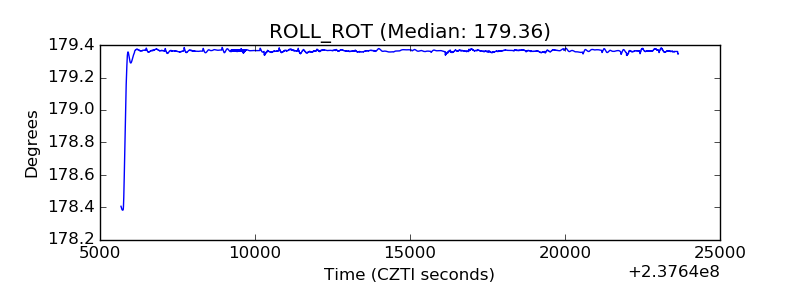 |
| _Roll_DEC | 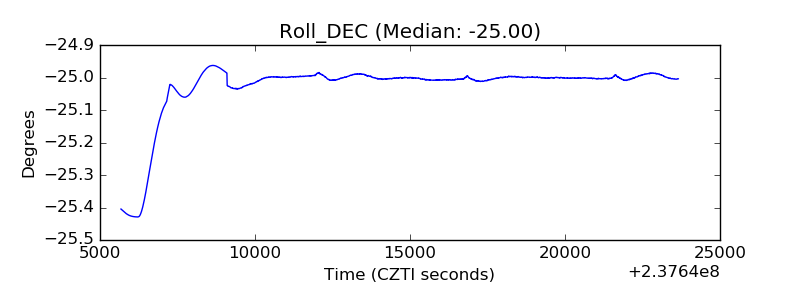 |
| _Roll_RA | 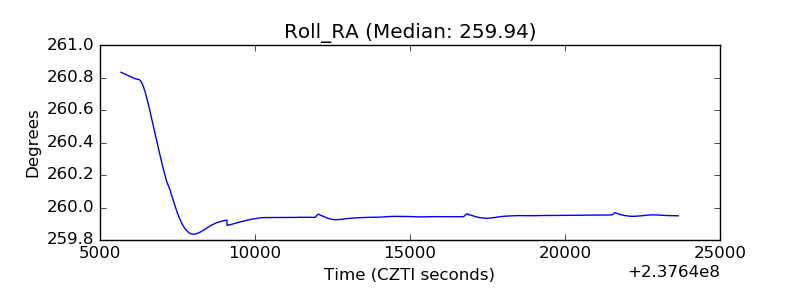 |
| Veto Counter |  |