| Param | Original file | Final file |
|---|---|---|
| Filename | modeM0/AS1T01_176T01_9000001378_09691cztM0_level2.evt | modeM0/AS1T01_176T01_9000001378_09691cztM0_level2_quad_clean.evt |
| Size (bytes) | 207,348,480 | 50,716,800 |
| Size | 197.7 MB | 48.4 MB |
| Events in quadrant A | 1,276,391 | 340,805 |
| Events in quadrant B | 1,339,480 | 342,885 |
| Events in quadrant C | 1,905,652 | 333,038 |
| Events in quadrant D | 1,572,662 | 325,769 |
| Mode M0 | |||
|---|---|---|---|
| Quadrant | BADHDUFLAG | Total packets | Discarded packets |
| A | 0 | 5669 | 51 |
| B | 0 | 5855 | 57 |
| C | 0 | 7537 | 89 |
| D | 0 | 6500 | 49 |
| Mode SS | |||
|---|---|---|---|
| Quadrant | BADHDUFLAG | Total packets | Discarded packets |
| A | 0 | 54 | 0 |
| B | 0 | 54 | 0 |
| C | 0 | 54 | 0 |
| D | 0 | 54 | 0 |
| Mode M9 | |||
|---|---|---|---|
| Quadrant | BADHDUFLAG | Total packets | Discarded packets |
| A | 0 | 1 | 0 |
| B | 0 | 1 | 0 |
| C | 0 | 1 | 0 |
| D | 0 | 2 | 0 |
| Quadrant | Total seconds | Saturated seconds | Saturation percentage |
|---|---|---|---|
| A | 2700 | 33 | 1.222222% |
| B | 2699 | 38 | 1.407929% |
| C | 2688 | 19 | 0.706845% |
| D | 2702 | 24 | 0.888231% |
Noise dominated data is calculated using 1-second bins in cleaned event files. If a bin has >2000 counts, and if more than 50% of those come from <1% of pixels, then it is considered to be noise-dominated and hence unusable.
| Quadrant | # 1 sec bins | Bins with >0 counts | Bins with >2000 counts | High rate bins dominated by noise | Noise dominated (total time) | Noise dominated (detector-on time) | Marked lightcurve |
|---|---|---|---|---|---|---|---|
| A | 2738 | 2724 | 1 | 1 | 0.04% | 0.04% | 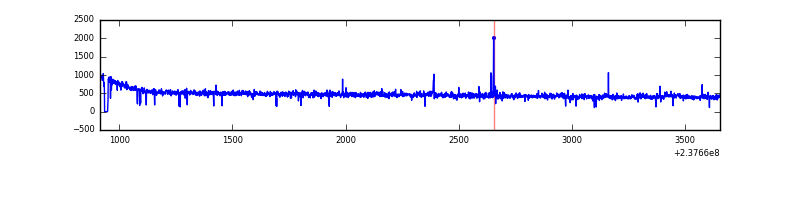 |
| B | 2738 | 2723 | 2 | 2 | 0.07% | 0.07% | 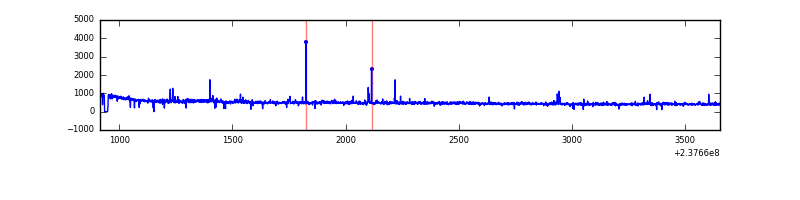 |
| C | 2738 | 2723 | 0 | 0 | 0.00% | 0.00% | 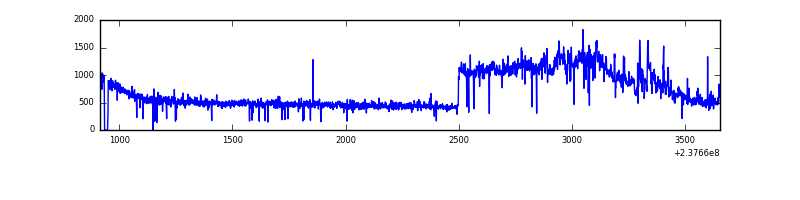 |
| D | 2738 | 2724 | 5 | 5 | 0.18% | 0.18% | 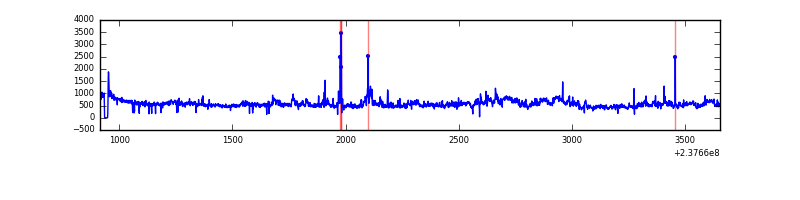 |
Top three noisy pixels from each quadrant. If the there are fewer than three noisy pixels in the level2.evt file, extra rows are filled as -1
| Pixel properties | Quadrant properties | ||||||
|---|---|---|---|---|---|---|---|
| Quadrant | DetID | PixID | Counts | Sigma | Mean | Median | Sigma |
| A | 15 | 174 | 17191 | 243.13 | 326 | 319 | 69.4 |
| A | 12 | 236 | 3771 | 49.74 | 326 | 319 | 69.4 |
| A | 0 | 226 | 3136 | 40.59 | 326 | 319 | 69.4 |
| B | 0 | 187 | 22665 | 349.01 | 323 | 316 | 64.0 |
| B | 0 | 214 | 14533 | 222.02 | 323 | 316 | 64.0 |
| B | 10 | 245 | 11227 | 170.39 | 323 | 316 | 64.0 |
| C | 8 | 208 | 673996 | 9092.63 | 309 | 310 | 74.1 |
| C | 9 | 68 | 12754 | 167.95 | 309 | 310 | 74.1 |
| C | 8 | 128 | 5181 | 65.74 | 309 | 310 | 74.1 |
| D | 8 | 195 | 289520 | 3440.83 | 313 | 305 | 84.1 |
| D | 7 | 46 | 24867 | 292.22 | 313 | 305 | 84.1 |
| D | 7 | 71 | 22837 | 268.07 | 313 | 305 | 84.1 |
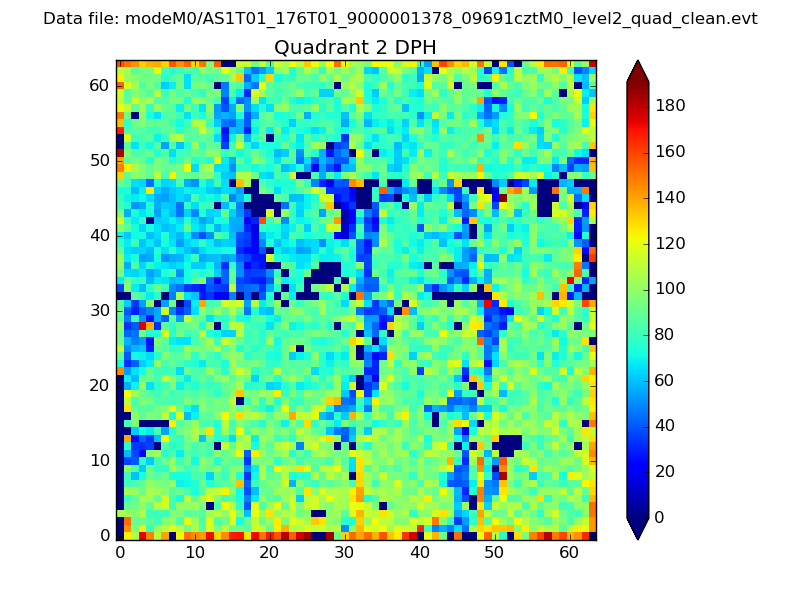
Histogram calculated using DETX and DETY for each event in the final _common_clean file
| Quadrant A | 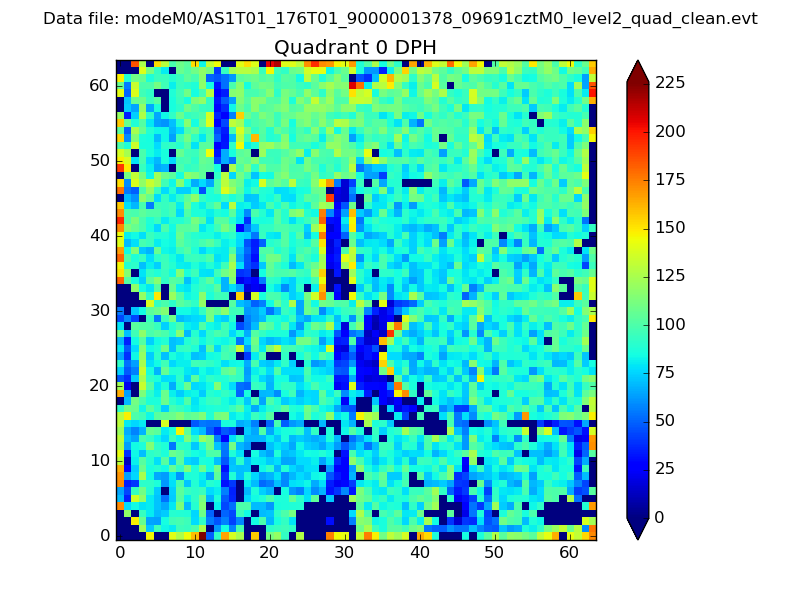 |
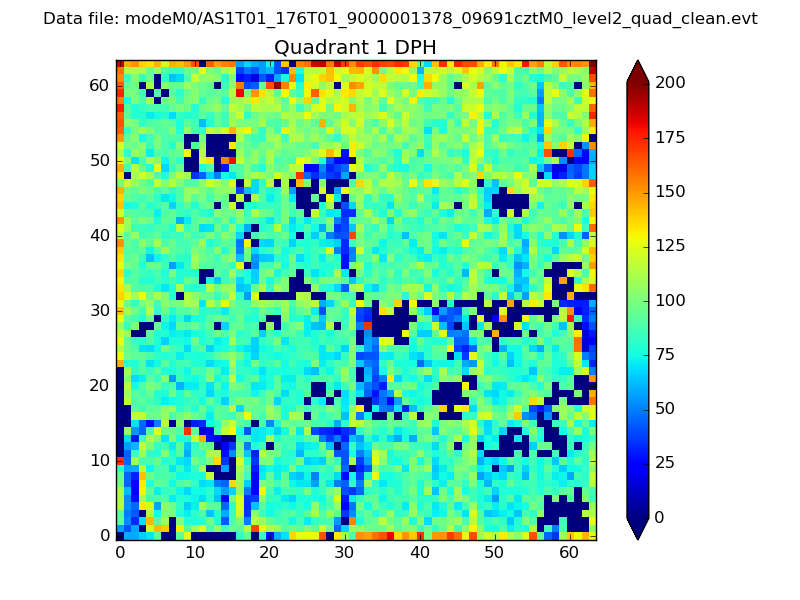 |
Quadrant B |
|---|---|---|---|
| Quadrant D | 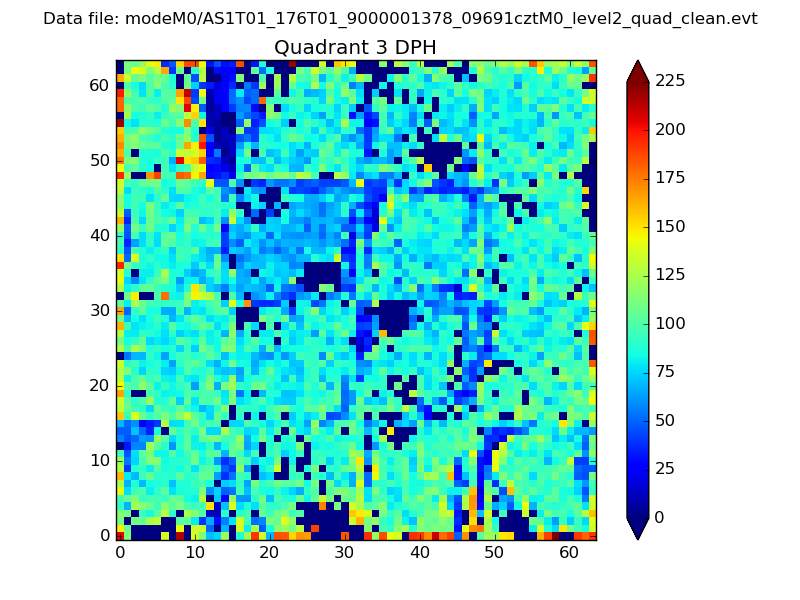 |
 |
Quadrant C |
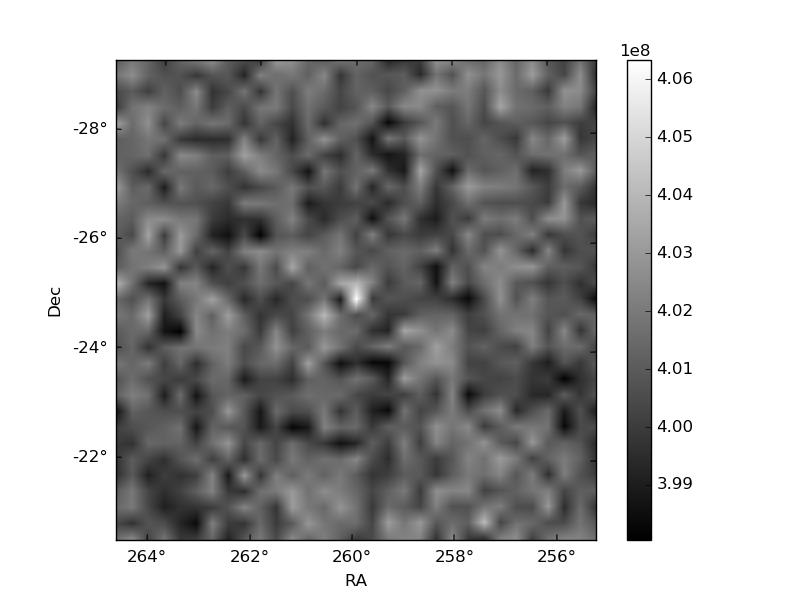
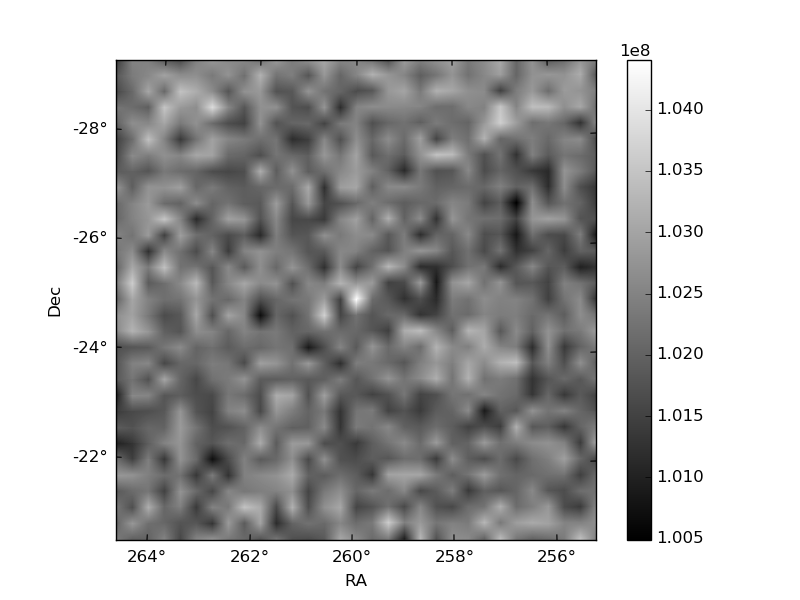
| Plot type | Count rate plots | Images |
|---|---|---|
| Comparison with Poisson distribution Blue bars denote a histogram of data divided into 1 sec bins. Red curve is a Poisson curve with rate = median count rate of data. |
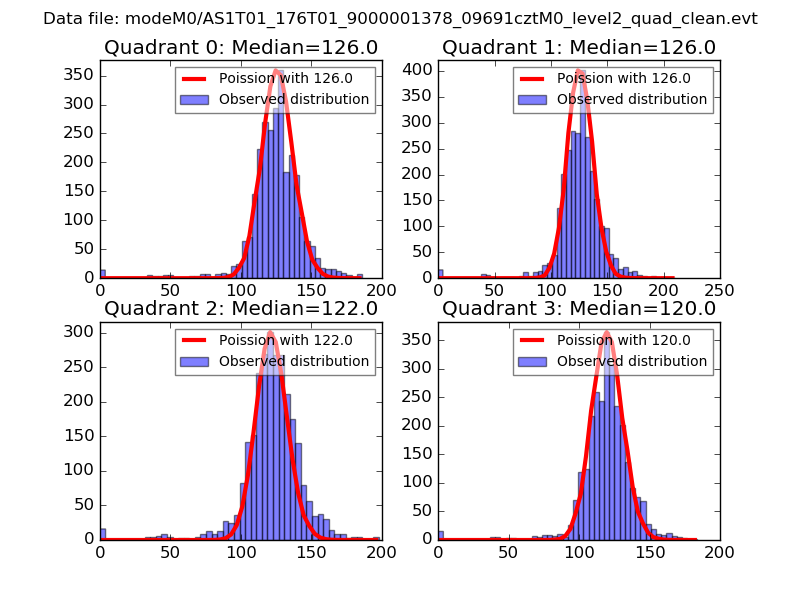 |
 |
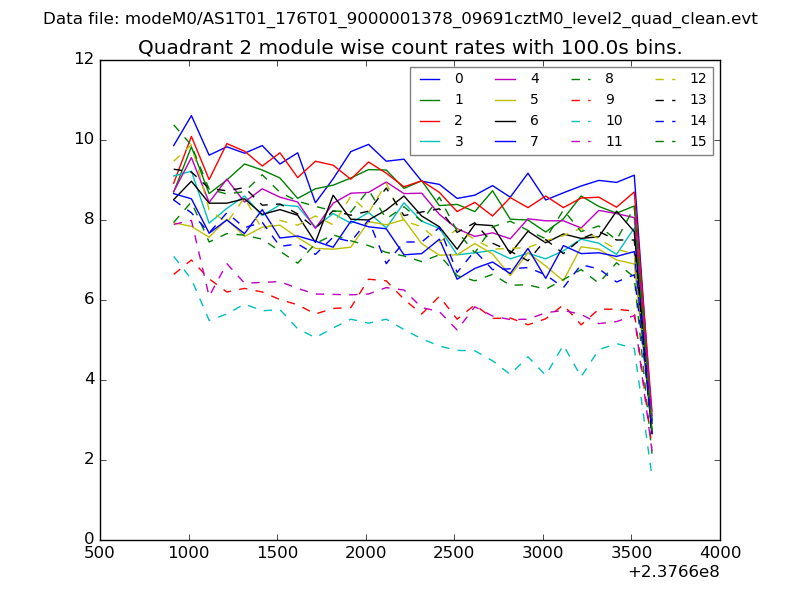
| Quadrant-wise count rates Data is divided into 100 sec bins |
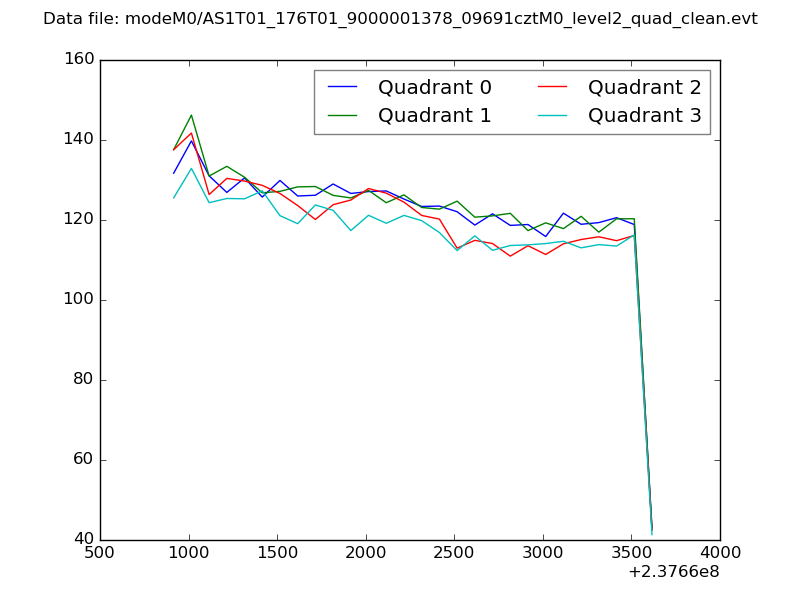 |
|
| Module-wise count rates for Quadrant A Data is divided into 100 sec bins |
 |
 |
| Module-wise count rates for Quadrant B Data is divided into 100 sec bins |
 |
 |
| Module-wise count rates for Quadrant C Data is divided into 100 sec bins |
 |
 |
| Module-wise count rates for Quadrant D Data is divided into 100 sec bins |
 |
 |
| Parameter | Plot |
|---|---|
| CZT HV Monitor | 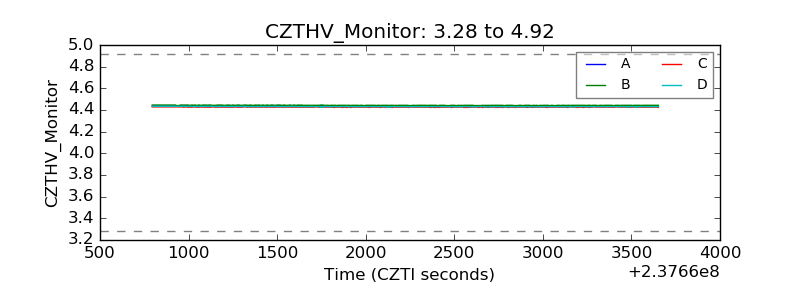 |
| D_VDD |  |
| Temperature 1 | 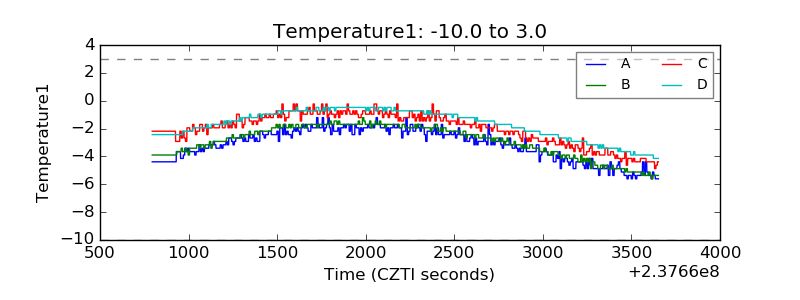 |
| Veto HV Monitor | 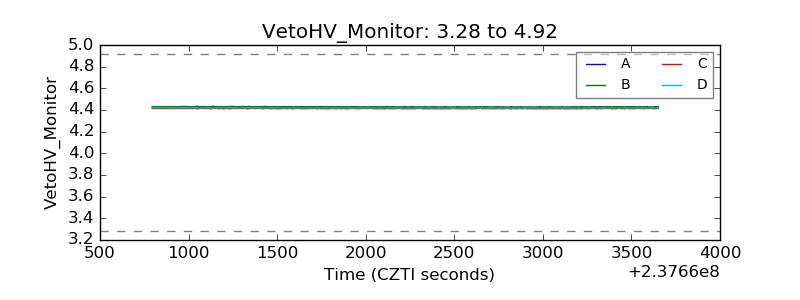 |
| Veto LLD |  |
| Alpha Counter | 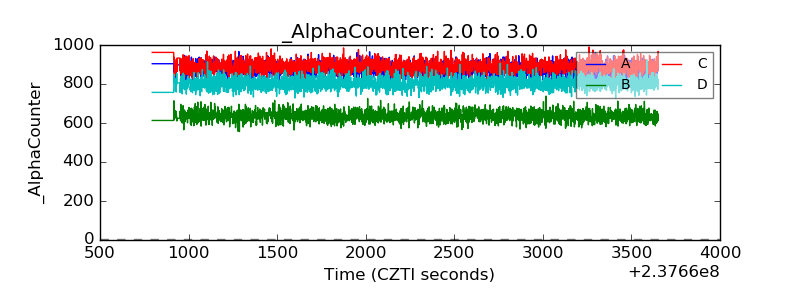 |
| _CPM_Rate | 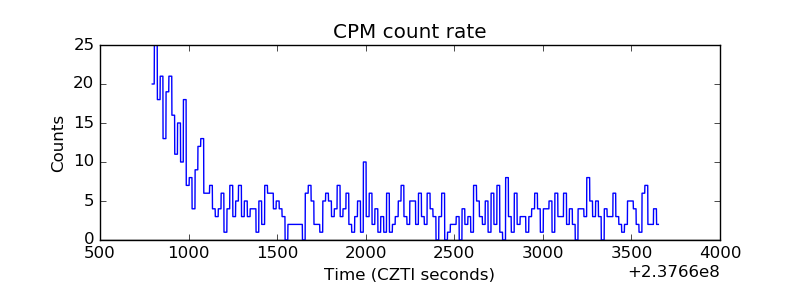 |
| CZT Counter | 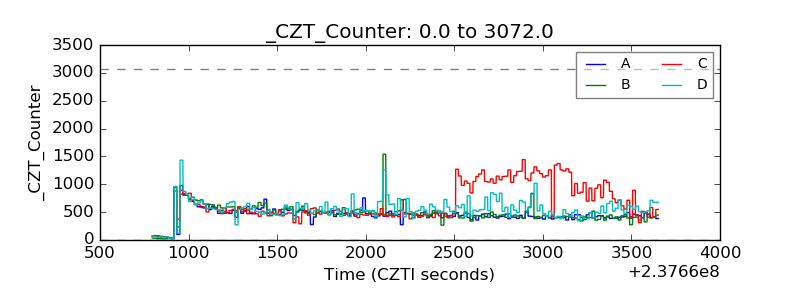 |
| +2.5 Volts monitor |  |
| +5 Volts monitor |  |
| _ROLL_ROT |  |
| _Roll_DEC | 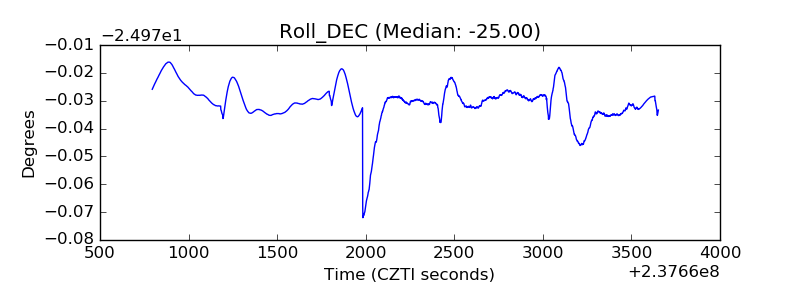 |
| _Roll_RA | 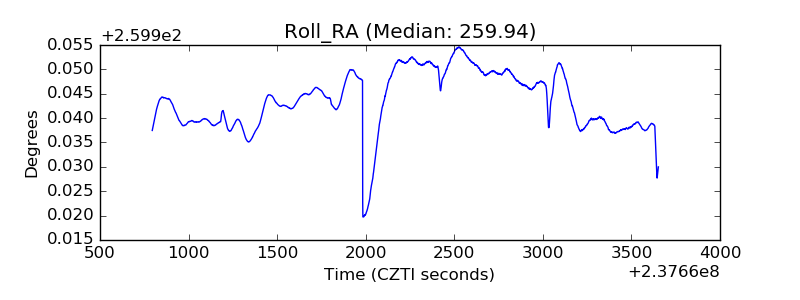 |
| Veto Counter | 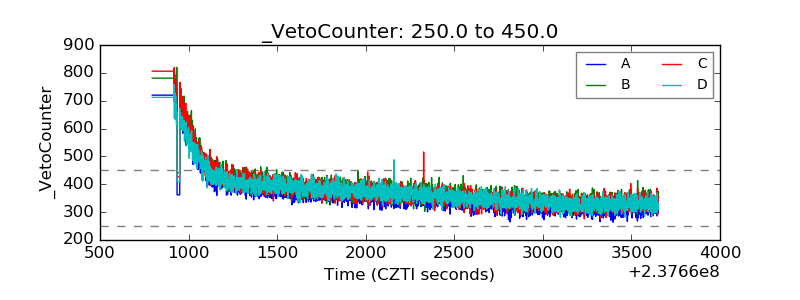 |