| Param | Original file | Final file |
|---|---|---|
| Filename | modeM0/AS1A03_029T01_9000001384cztM0_level2.fits | modeM0/AS1A03_029T01_9000001384cztM0_level2_quad_clean.evt |
| Size (bytes) | 900,601,920 | 884,278,080 |
| Size | 858.9 MB | 843.3 MB |
| Events in quadrant A | 5,422,564 | 5,241,107 |
| Events in quadrant B | 5,276,340 | 5,280,857 |
| Events in quadrant C | 5,373,128 | 5,065,203 |
| Events in quadrant D | 4,620,344 | 4,612,479 |
| Mode M0 | |||
|---|---|---|---|
| Quadrant | BADHDUFLAG | Total packets | Discarded packets |
| A | 0 | 199778 | 0 |
| B | 0 | 200156 | 0 |
| C | 0 | 199277 | 0 |
| D | 0 | 231790 | 0 |
| Mode M9 | |||
|---|---|---|---|
| Quadrant | BADHDUFLAG | Total packets | Discarded packets |
| A | 0 | 146 | 0 |
| B | 0 | 146 | 0 |
| C | 0 | 145 | 0 |
| D | 0 | 145 | 0 |
| Mode SS | |||
|---|---|---|---|
| Quadrant | BADHDUFLAG | Total packets | Discarded packets |
| A | 0 | 1962 | 0 |
| B | 0 | 1954 | 0 |
| C | 0 | 1968 | 0 |
| D | 0 | 1960 | 0 |
| Quadrant | Total seconds | Saturated seconds | Saturation percentage |
|---|---|---|---|
| A | 96031 | 1479 | 1.540128% |
| B | 96003 | 1049 | 1.092674% |
| C | 96021 | 728 | 0.758167% |
| D | 95950 | 1838 | 1.915581% |
Noise dominated data is calculated using 1-second bins in cleaned event files. If a bin has >2000 counts, and if more than 50% of those come from <1% of pixels, then it is considered to be noise-dominated and hence unusable.
| Quadrant | # 1 sec bins | Bins with >0 counts | Bins with >2000 counts | High rate bins dominated by noise | Noise dominated (total time) | Noise dominated (detector-on time) | Marked lightcurve |
|---|---|---|---|---|---|---|---|
| A | 111684 | 96391 | 0 | 0 | 0.00% | 0.00% |  |
| B | 111684 | 96408 | 0 | 0 | 0.00% | 0.00% | 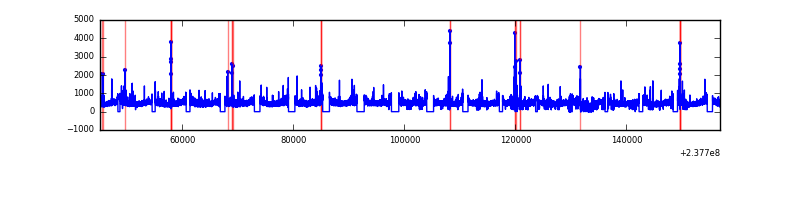 |
| C | 111684 | 96401 | 0 | 0 | 0.00% | 0.00% |  |
| D | 111684 | 96360 | 0 | 0 | 0.00% | 0.00% | 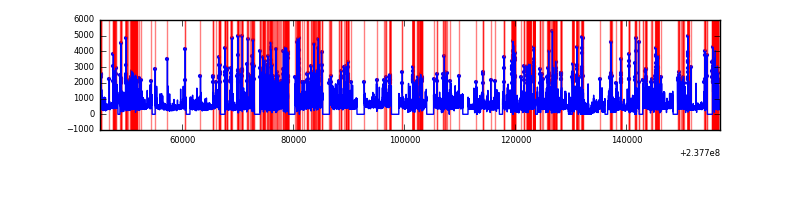 |
Top three noisy pixels from each quadrant. If the there are fewer than three noisy pixels in the level2.evt file, extra rows are filled as -1
| Pixel properties | Quadrant properties | ||||||
|---|---|---|---|---|---|---|---|
| Quadrant | DetID | PixID | Counts | Sigma | Mean | Median | Sigma |
| A | 0 | 29 | 5167 | 10.94 | 1407 | 1317 | 351.8 |
| A | 7 | 110 | 4484 | 9.0 | 1407 | 1317 | 351.8 |
| A | 0 | 30 | 4069 | 7.82 | 1407 | 1317 | 351.8 |
| B | 2 | 9 | 4418 | 11.26 | 1389 | 1319 | 275.3 |
| B | 3 | 17 | 3528 | 8.02 | 1389 | 1319 | 275.3 |
| B | 12 | 226 | 3513 | 7.97 | 1389 | 1319 | 275.3 |
| C | 12 | 241 | 3803 | 6.75 | 1420 | 1313 | 368.9 |
| C | 2 | 191 | 3617 | 6.25 | 1420 | 1313 | 368.9 |
| C | 9 | 188 | 3535 | 6.02 | 1420 | 1313 | 368.9 |
| D | 7 | 5 | 3259 | 5.93 | 1316 | 1195 | 348.1 |
| D | 6 | 231 | 3259 | 5.93 | 1316 | 1195 | 348.1 |
| D | 7 | 3 | 3203 | 5.77 | 1316 | 1195 | 348.1 |
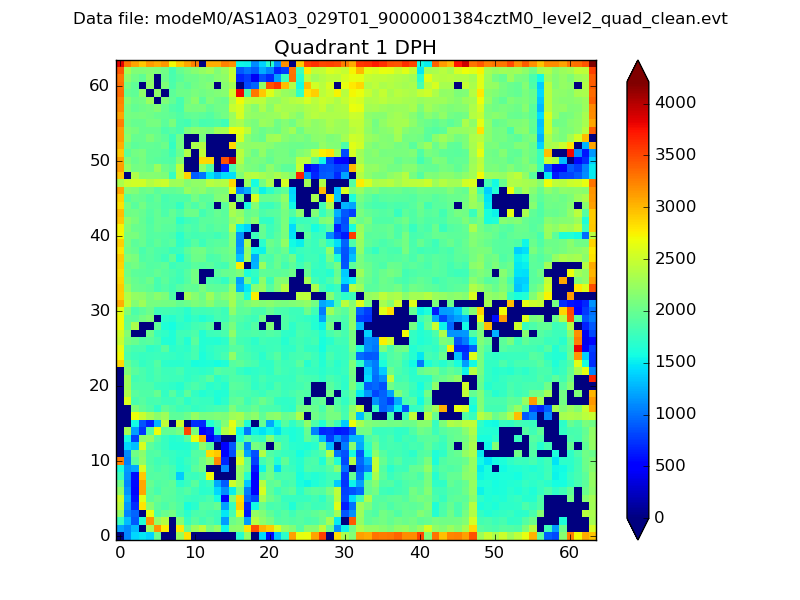
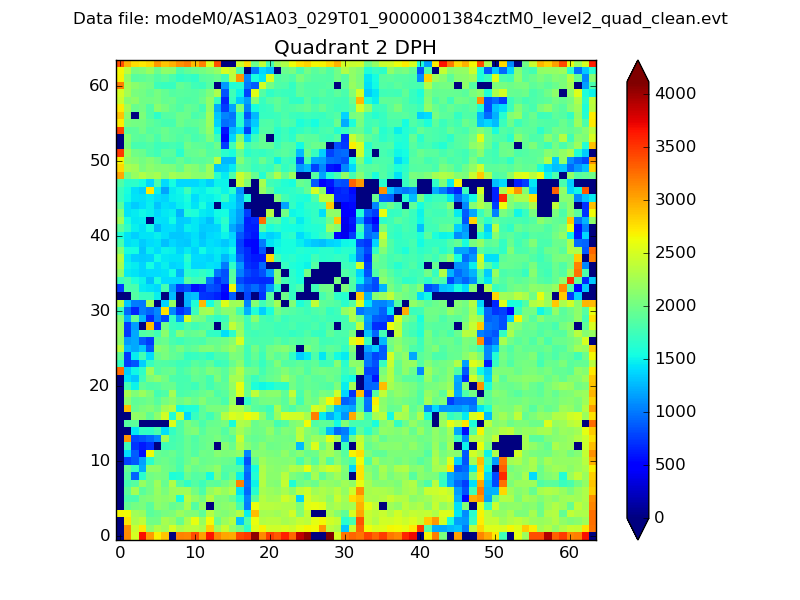
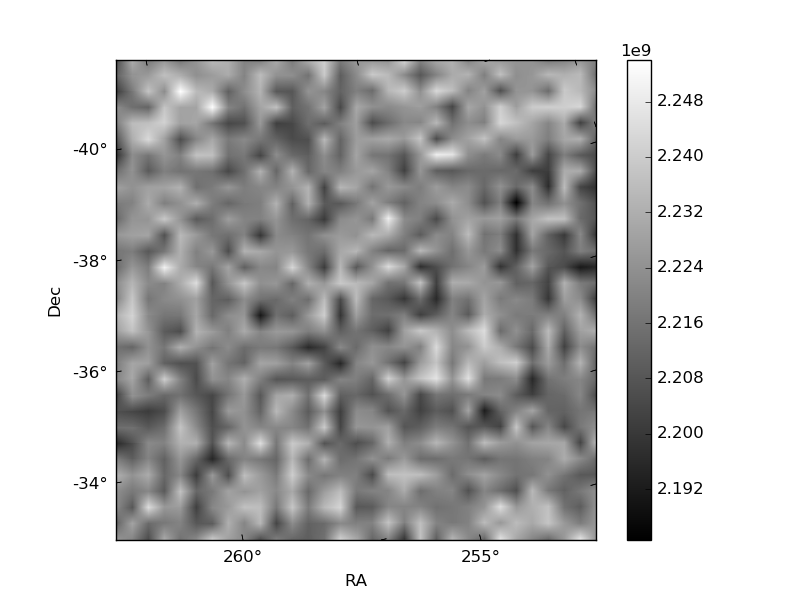
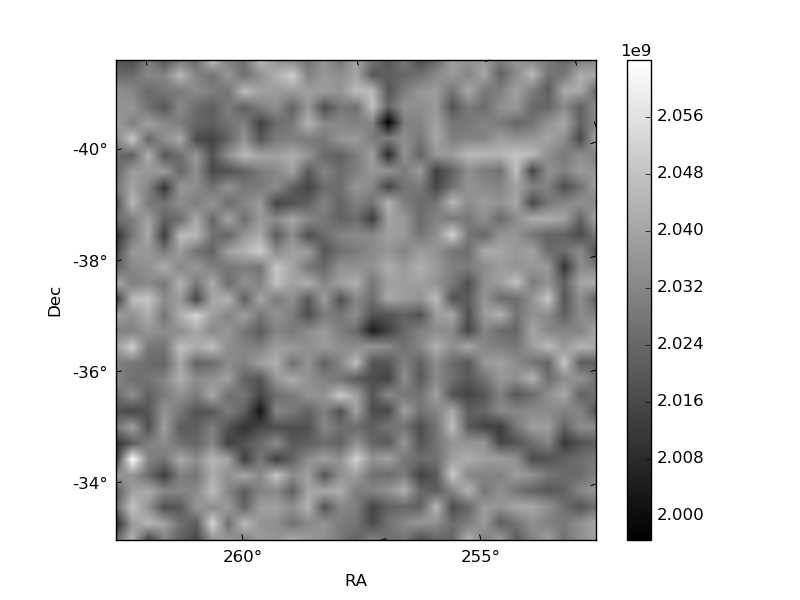
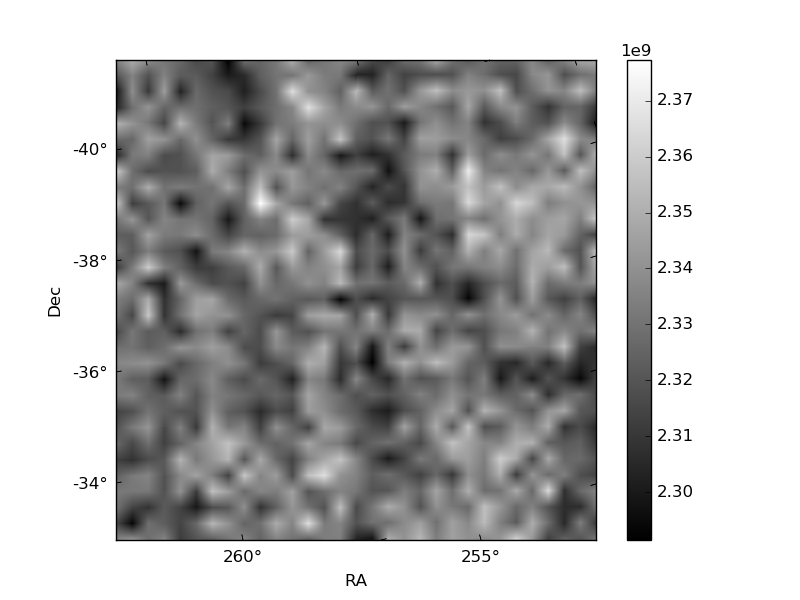
Histogram calculated using DETX and DETY for each event in the final _common_clean file
| Quadrant A |  |
 |
Quadrant B |
|---|---|---|---|
| Quadrant D |  |
 |
Quadrant C |
| Plot type | Count rate plots | Images |
|---|---|---|
| Comparison with Poisson distribution Blue bars denote a histogram of data divided into 1 sec bins. Red curve is a Poisson curve with rate = median count rate of data. |
 |
 |
| Quadrant-wise count rates Data is divided into 100 sec bins |
 |
|
| Module-wise count rates for Quadrant A Data is divided into 100 sec bins |
 |
 |
| Module-wise count rates for Quadrant B Data is divided into 100 sec bins |
 |
 |
| Module-wise count rates for Quadrant C Data is divided into 100 sec bins |
 |
 |
| Module-wise count rates for Quadrant D Data is divided into 100 sec bins |
 |
 |
| Parameter | Plot |
|---|---|
| CZT HV Monitor |  |
| D_VDD |  |
| Temperature 1 |  |
| Veto HV Monitor | 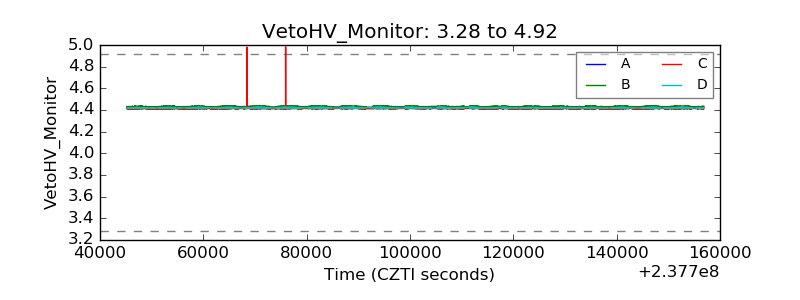 |
| Veto LLD |  |
| Alpha Counter | 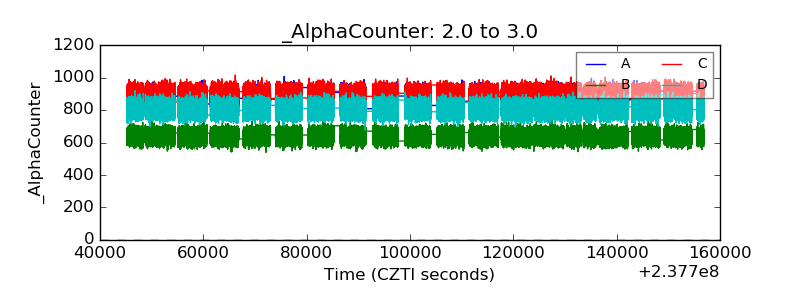 |
| _CPM_Rate | 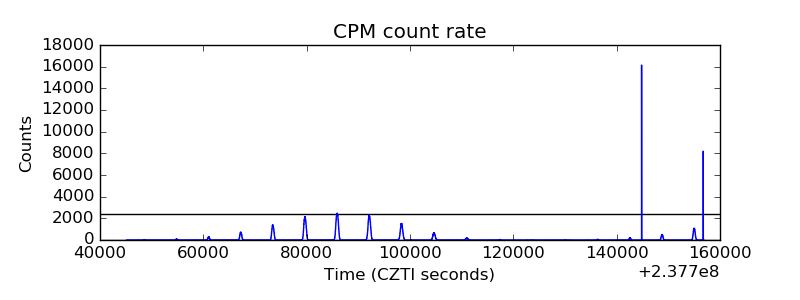 |
| CZT Counter | 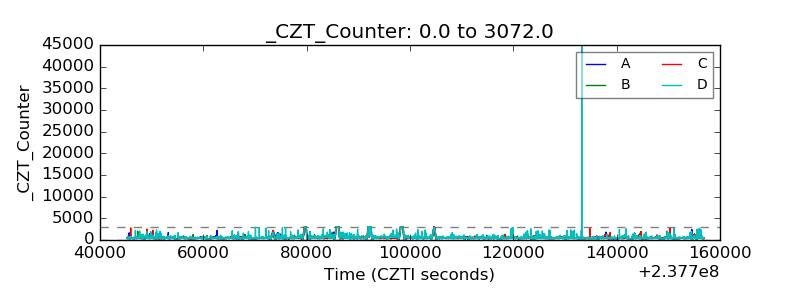 |
| +2.5 Volts monitor |  |
| +5 Volts monitor | 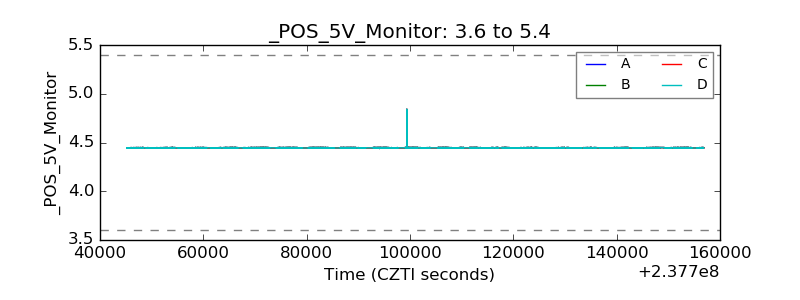 |
| _ROLL_ROT |  |
| _Roll_DEC |  |
| _Roll_RA |  |
| Veto Counter | 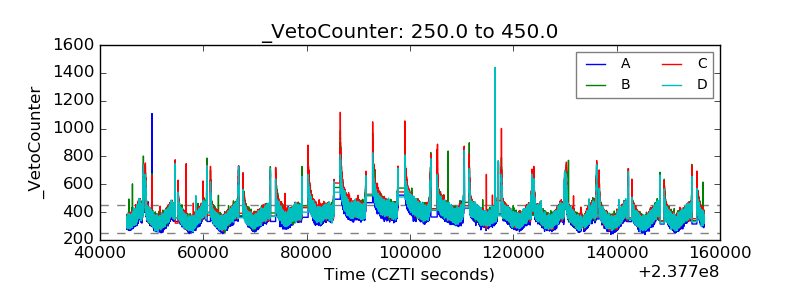 |