| Param | Original file | Final file |
|---|---|---|
| Filename | modeM0/AS1A03_029T01_9000001384_09703cztM0_level2.evt | modeM0/AS1A03_029T01_9000001384_09703cztM0_level2_quad_clean.evt |
| Size (bytes) | 342,100,800 | 53,305,920 |
| Size | 326.3 MB | 50.8 MB |
| Events in quadrant A | 2,538,489 | 322,306 |
| Events in quadrant B | 2,370,932 | 325,855 |
| Events in quadrant C | 2,392,767 | 318,971 |
| Events in quadrant D | 2,731,301 | 309,694 |
| Mode M0 | |||
|---|---|---|---|
| Quadrant | BADHDUFLAG | Total packets | Discarded packets |
| A | 0 | 10584 | 4 |
| B | 0 | 10168 | 3 |
| C | 0 | 10402 | 9 |
| D | 0 | 11444 | 5 |
| Mode M9 | |||
|---|---|---|---|
| Quadrant | BADHDUFLAG | Total packets | Discarded packets |
| A | 0 | 3 | 0 |
| B | 0 | 3 | 0 |
| C | 0 | 3 | 0 |
| D | 0 | 3 | 0 |
| Mode SS | |||
|---|---|---|---|
| Quadrant | BADHDUFLAG | Total packets | Discarded packets |
| A | 0 | 100 | 0 |
| B | 0 | 100 | 0 |
| C | 0 | 100 | 0 |
| D | 0 | 100 | 0 |
| Quadrant | Total seconds | Saturated seconds | Saturation percentage |
|---|---|---|---|
| A | 4794 | 77 | 1.606174% |
| B | 4794 | 80 | 1.668753% |
| C | 4791 | 84 | 1.753287% |
| D | 4793 | 113 | 2.357605% |
Noise dominated data is calculated using 1-second bins in cleaned event files. If a bin has >2000 counts, and if more than 50% of those come from <1% of pixels, then it is considered to be noise-dominated and hence unusable.
| Quadrant | # 1 sec bins | Bins with >0 counts | Bins with >2000 counts | High rate bins dominated by noise | Noise dominated (total time) | Noise dominated (detector-on time) | Marked lightcurve |
|---|---|---|---|---|---|---|---|
| A | 5160 | 4796 | 3 | 3 | 0.06% | 0.06% |  |
| B | 5160 | 4796 | 3 | 3 | 0.06% | 0.06% |  |
| C | 5160 | 4796 | 44 | 44 | 0.85% | 0.92% | 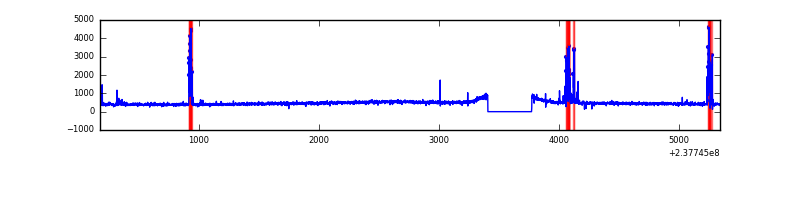 |
| D | 5160 | 4796 | 41 | 41 | 0.79% | 0.85% | 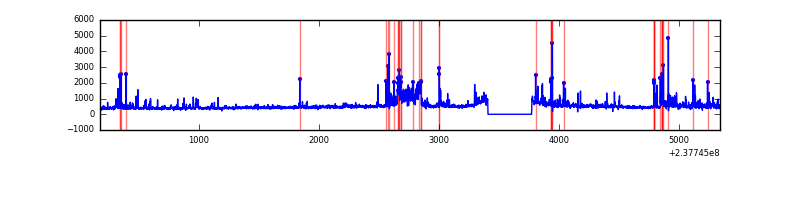 |
Top three noisy pixels from each quadrant. If the there are fewer than three noisy pixels in the level2.evt file, extra rows are filled as -1
| Pixel properties | Quadrant properties | ||||||
|---|---|---|---|---|---|---|---|
| Quadrant | DetID | PixID | Counts | Sigma | Mean | Median | Sigma |
| A | 1 | 162 | 124979 | 1032.76 | 582 | 568 | 120.5 |
| A | 1 | 178 | 48751 | 399.97 | 582 | 568 | 120.5 |
| A | 1 | 161 | 43222 | 354.08 | 582 | 568 | 120.5 |
| B | 0 | 214 | 53568 | 463.55 | 583 | 568 | 114.3 |
| B | 10 | 245 | 18266 | 154.79 | 583 | 568 | 114.3 |
| B | 12 | 111 | 12310 | 102.7 | 583 | 568 | 114.3 |
| C | 14 | 234 | 185597 | 1399.56 | 562 | 566 | 132.2 |
| C | 9 | 237 | 5013 | 33.64 | 562 | 566 | 132.2 |
| C | 14 | 238 | 4627 | 30.72 | 562 | 566 | 132.2 |
| D | 1 | 52 | 535335 | 3851.63 | 557 | 542 | 138.8 |
| D | 2 | 234 | 24374 | 171.64 | 557 | 542 | 138.8 |
| D | 8 | 195 | 17452 | 121.79 | 557 | 542 | 138.8 |
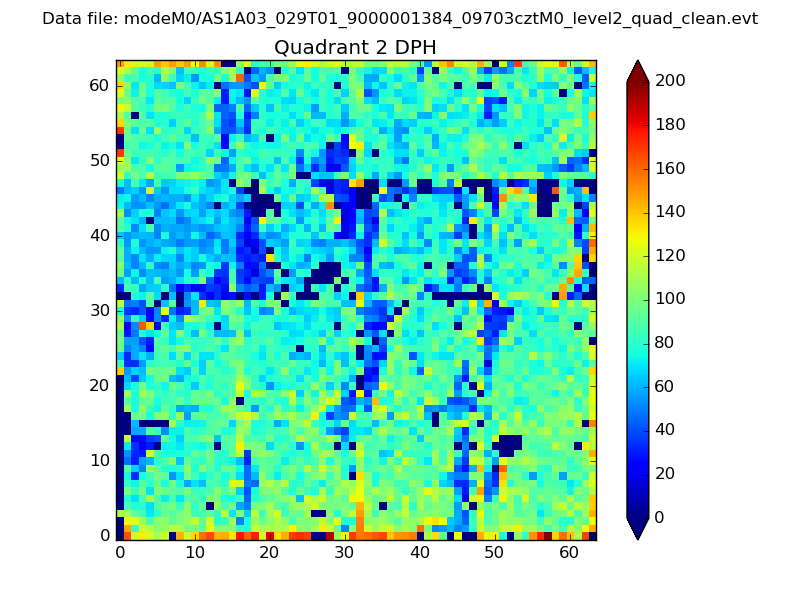
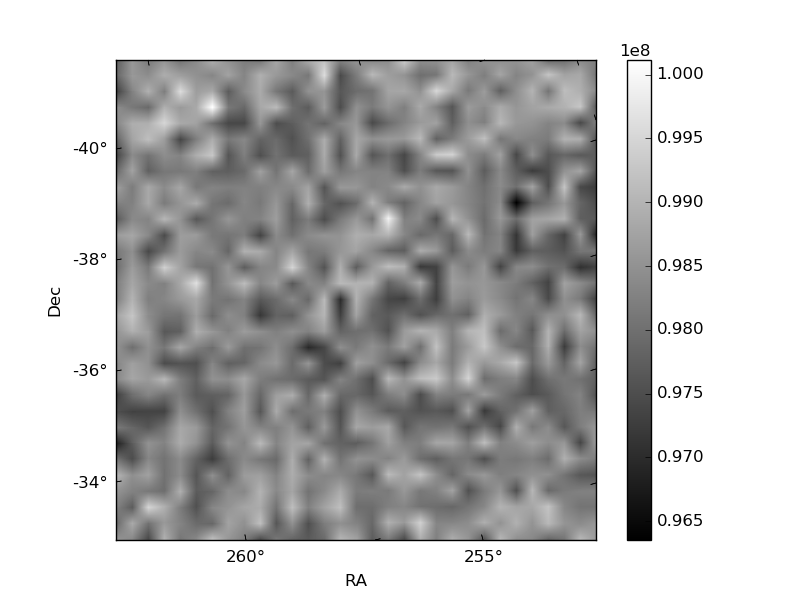
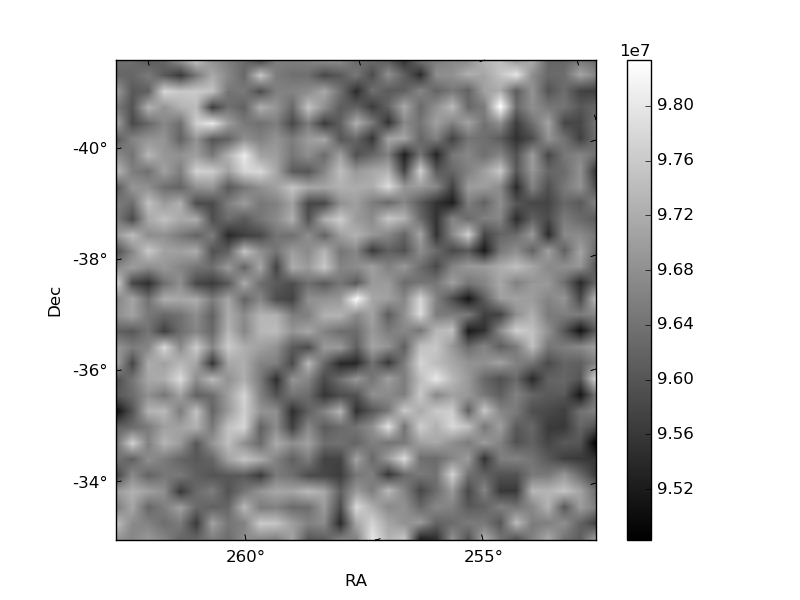
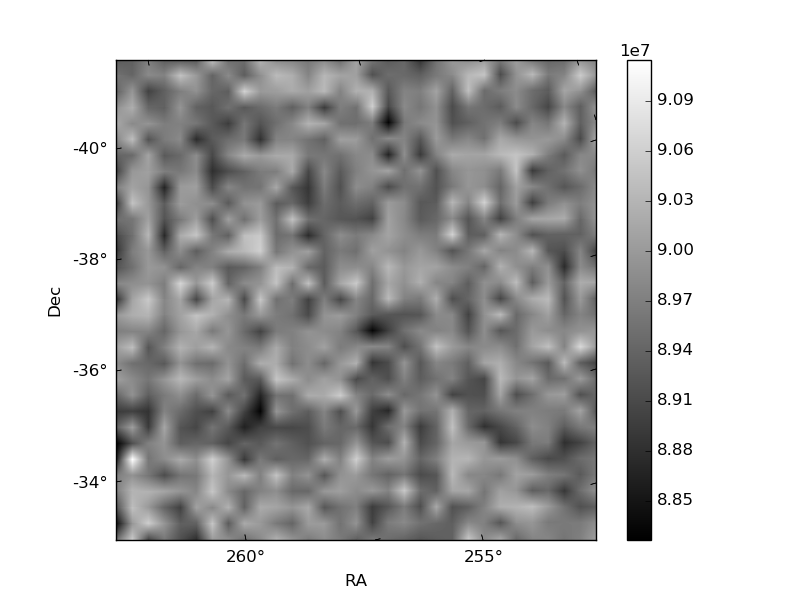
Histogram calculated using DETX and DETY for each event in the final _common_clean file
| Quadrant A | 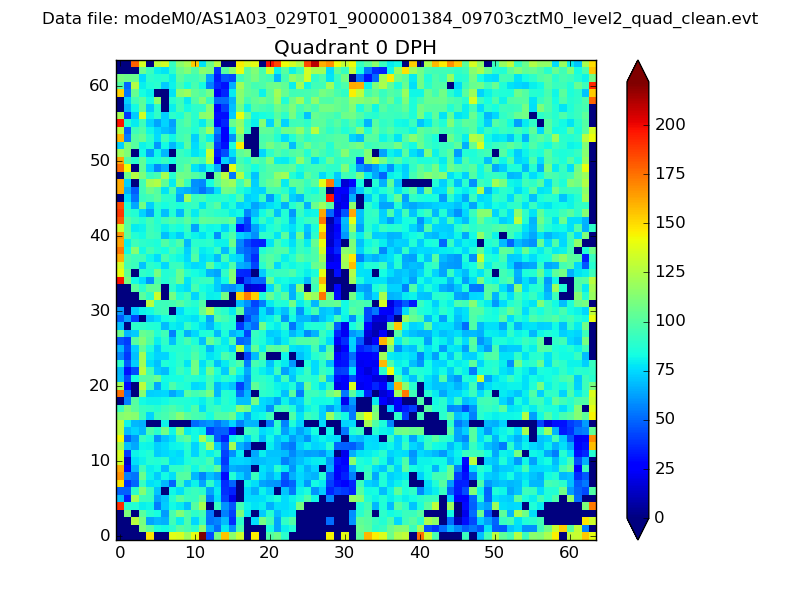 |
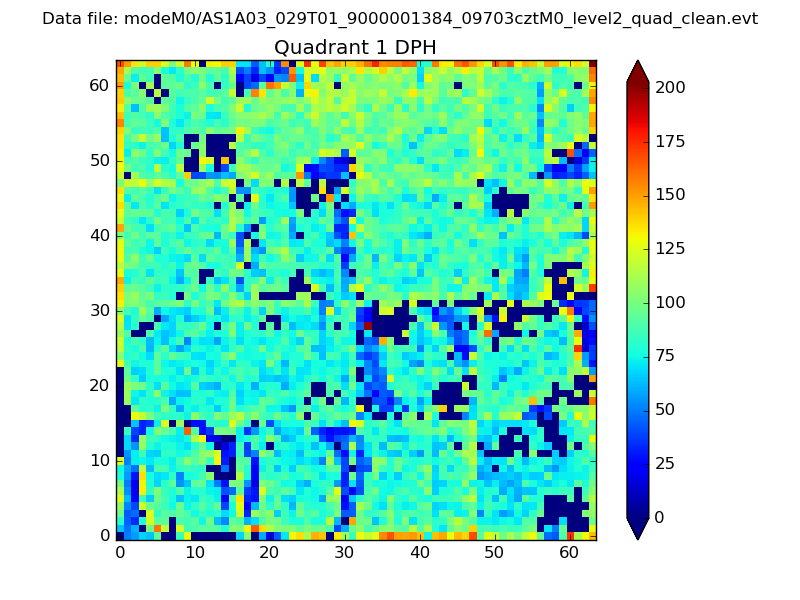 |
Quadrant B |
|---|---|---|---|
| Quadrant D | 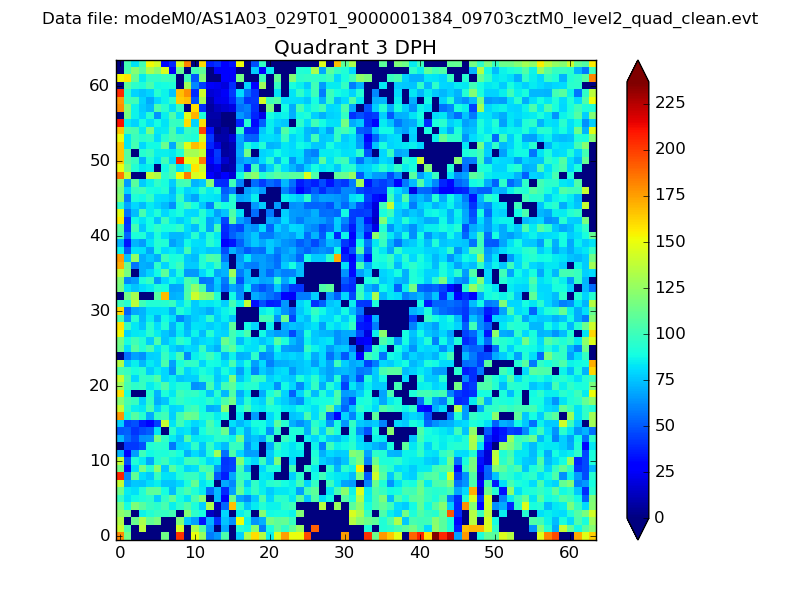 |
 |
Quadrant C |
| Plot type | Count rate plots | Images |
|---|---|---|
| Comparison with Poisson distribution Blue bars denote a histogram of data divided into 1 sec bins. Red curve is a Poisson curve with rate = median count rate of data. |
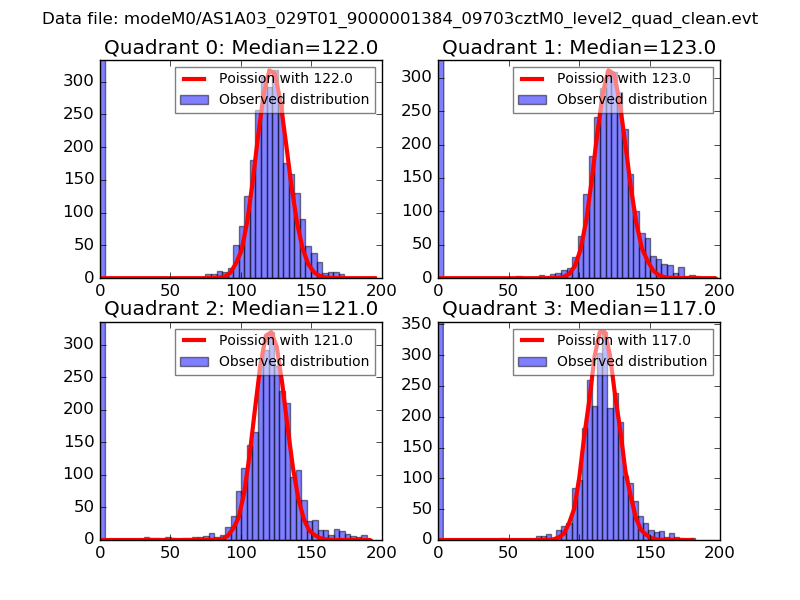 |
 |
| Quadrant-wise count rates Data is divided into 100 sec bins |
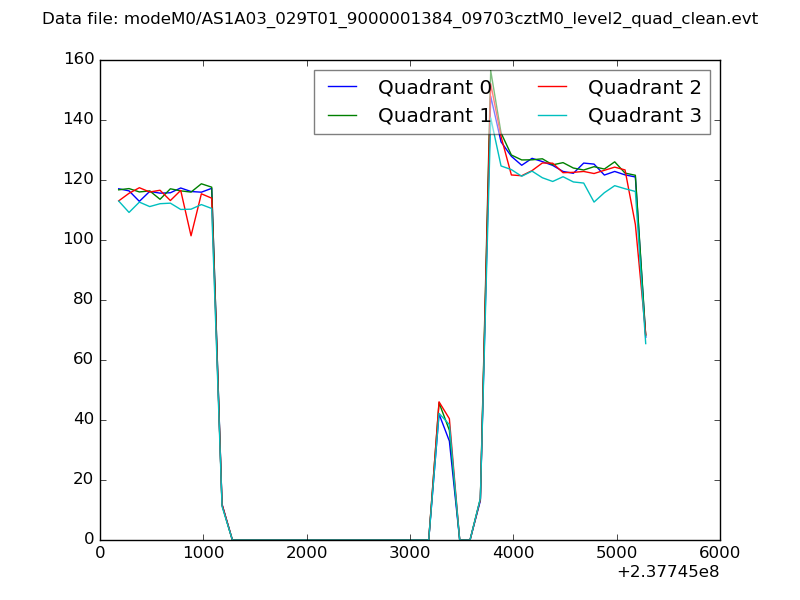 |
|
| Module-wise count rates for Quadrant A Data is divided into 100 sec bins |
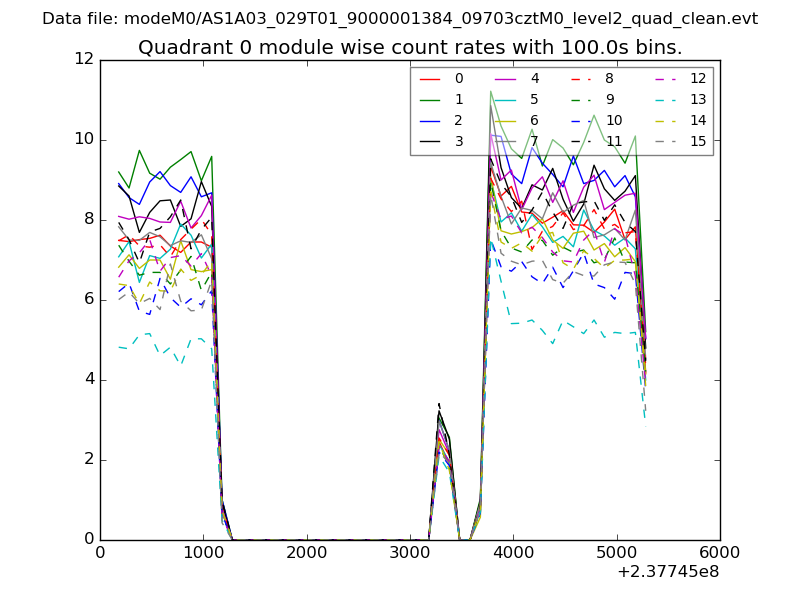 |
 |
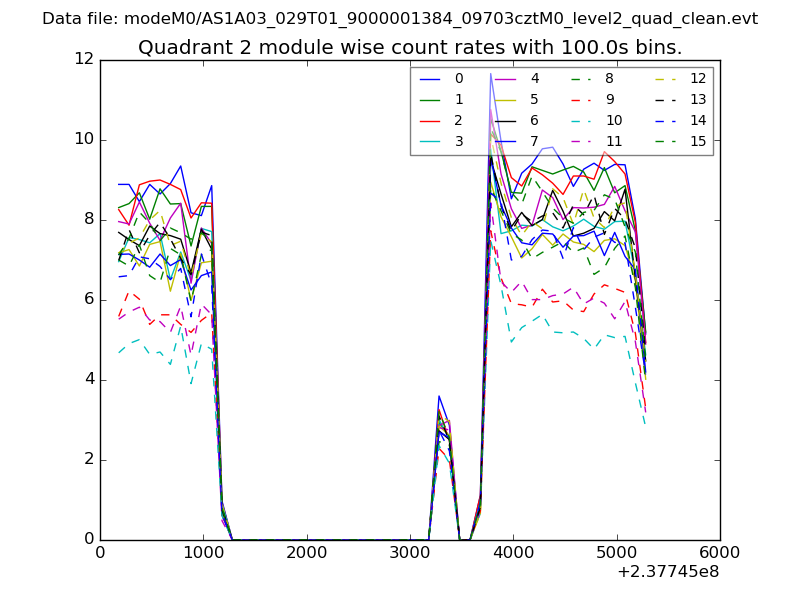
| Module-wise count rates for Quadrant B Data is divided into 100 sec bins |
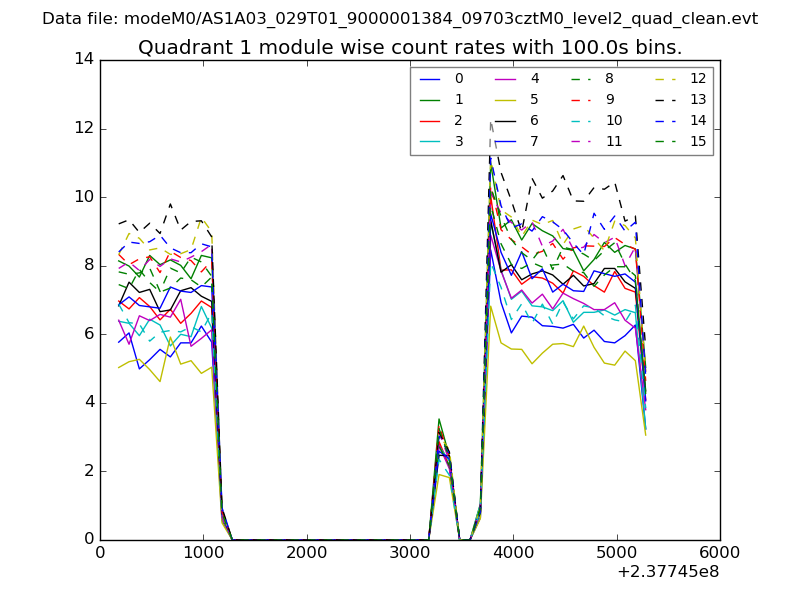 |
 |
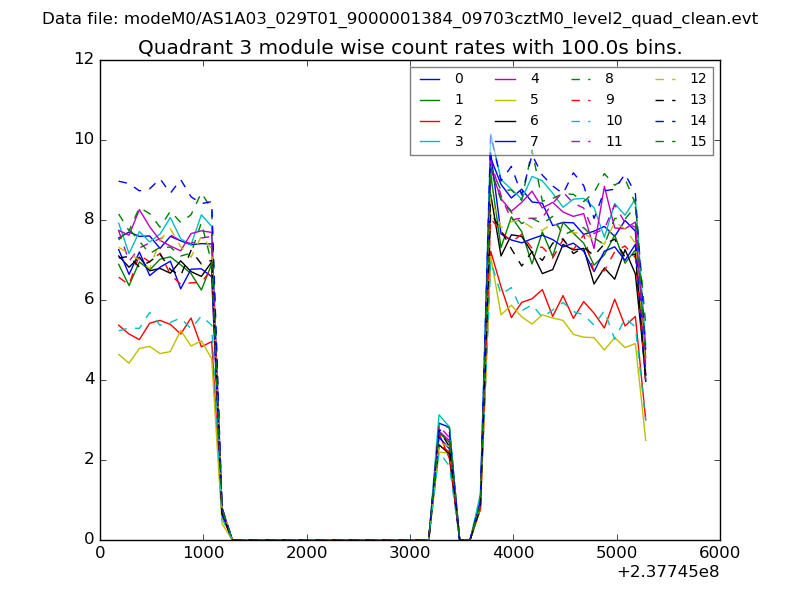
| Module-wise count rates for Quadrant C Data is divided into 100 sec bins |
 |
 |
| Module-wise count rates for Quadrant D Data is divided into 100 sec bins |
 |
 |
| Parameter | Plot |
|---|---|
| CZT HV Monitor | 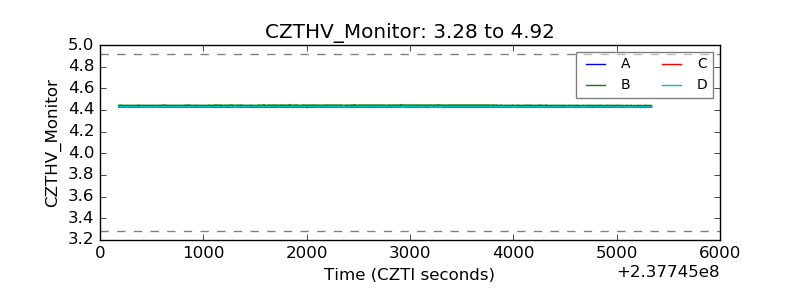 |
| D_VDD | 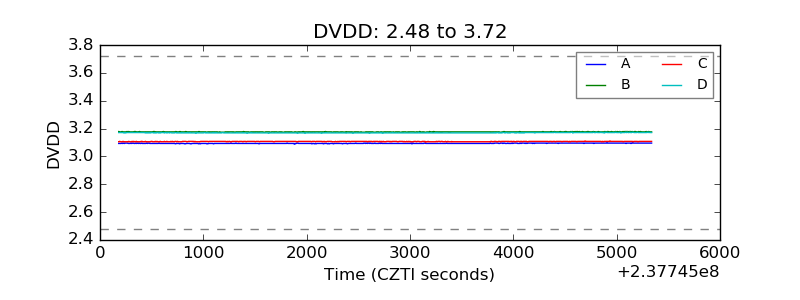 |
| Temperature 1 | 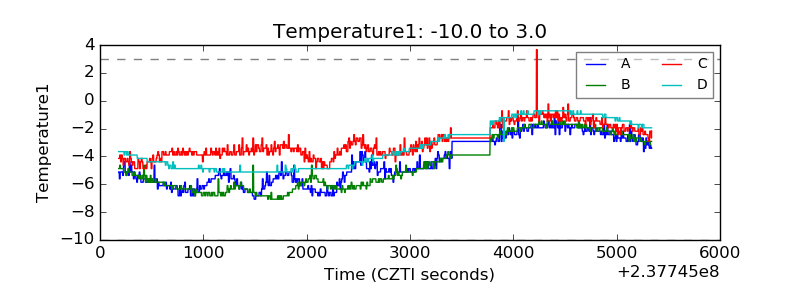 |
| Veto HV Monitor | 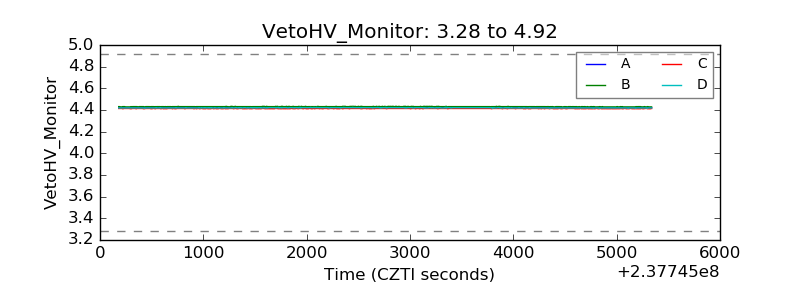 |
| Veto LLD | 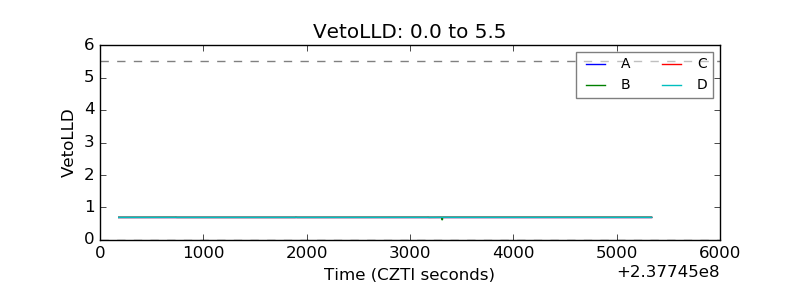 |
| Alpha Counter | 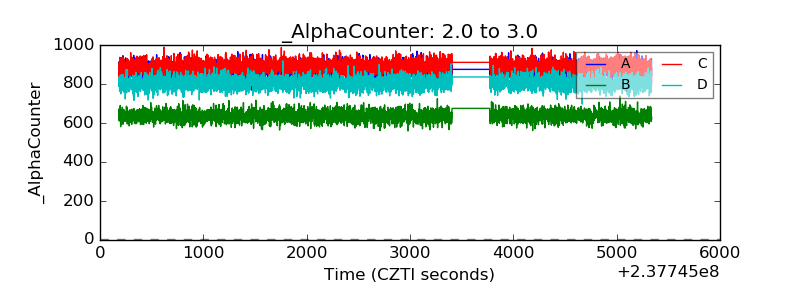 |
| _CPM_Rate | 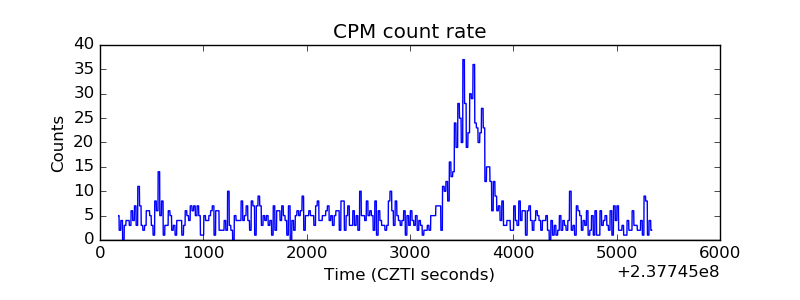 |
| CZT Counter | 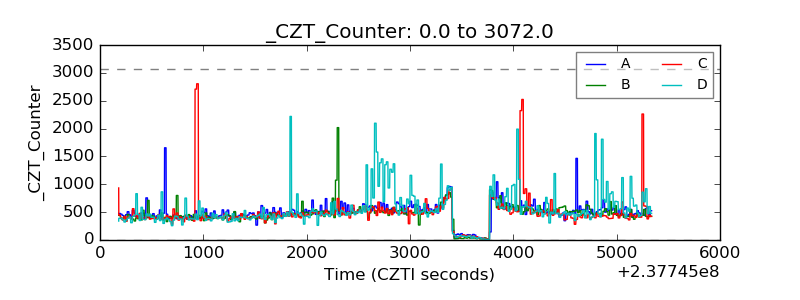 |
| +2.5 Volts monitor |  |
| +5 Volts monitor |  |
| _ROLL_ROT | 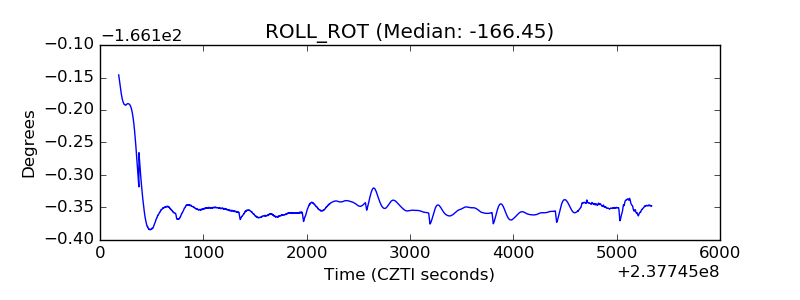 |
| _Roll_DEC | 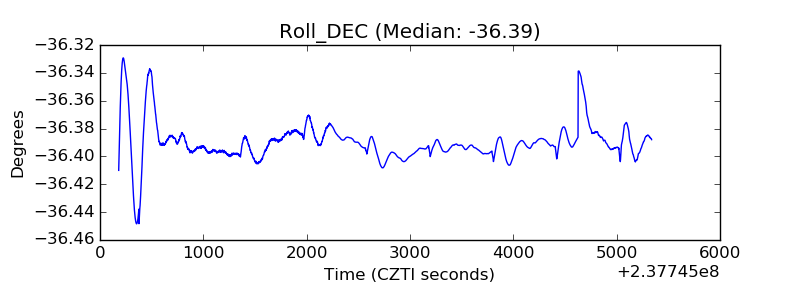 |
| _Roll_RA | 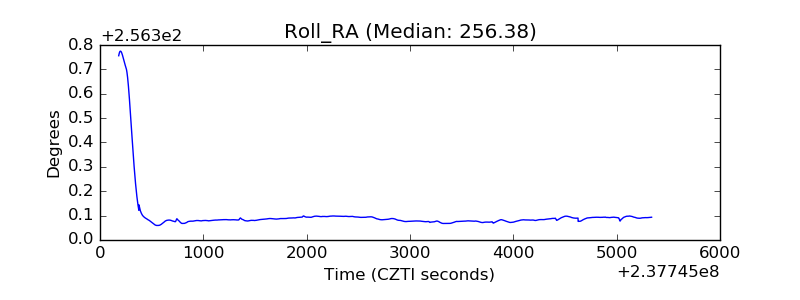 |
| Veto Counter | 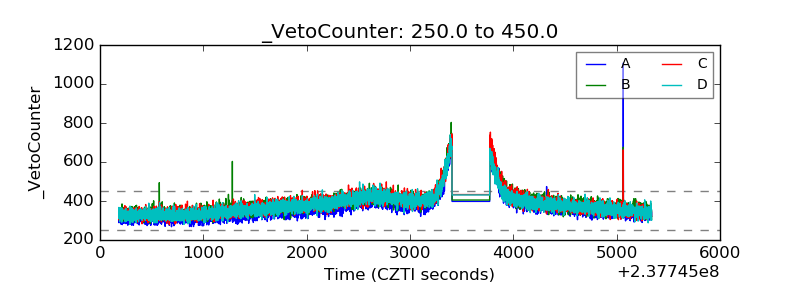 |