| Param | Original file | Final file |
|---|---|---|
| Filename | modeM0/AS1A03_029T01_9000001384_09707cztM0_level2.evt | modeM0/AS1A03_029T01_9000001384_09707cztM0_level2_quad_clean.evt |
| Size (bytes) | 434,240,640 | 87,177,600 |
| Size | 414.1 MB | 83.1 MB |
| Events in quadrant A | 3,378,812 | 520,518 |
| Events in quadrant B | 3,128,720 | 569,806 |
| Events in quadrant C | 2,912,143 | 559,003 |
| Events in quadrant D | 3,287,717 | 535,727 |
| Mode M0 | |||
|---|---|---|---|
| Quadrant | BADHDUFLAG | Total packets | Discarded packets |
| A | 0 | 14524 | 2 |
| B | 0 | 13506 | 1 |
| C | 0 | 13177 | 1 |
| D | 0 | 14216 | 1 |
| Mode M9 | |||
|---|---|---|---|
| Quadrant | BADHDUFLAG | Total packets | Discarded packets |
| A | 0 | 10 | 0 |
| B | 0 | 10 | 0 |
| C | 0 | 10 | 0 |
| D | 0 | 10 | 0 |
| Mode SS | |||
|---|---|---|---|
| Quadrant | BADHDUFLAG | Total packets | Discarded packets |
| A | 0 | 134 | 0 |
| B | 0 | 134 | 0 |
| C | 0 | 134 | 0 |
| D | 0 | 134 | 0 |
| Quadrant | Total seconds | Saturated seconds | Saturation percentage |
|---|---|---|---|
| A | 6512 | 556 | 8.538084% |
| B | 6512 | 33 | 0.506757% |
| C | 6512 | 17 | 0.261057% |
| D | 6512 | 74 | 1.136364% |
Noise dominated data is calculated using 1-second bins in cleaned event files. If a bin has >2000 counts, and if more than 50% of those come from <1% of pixels, then it is considered to be noise-dominated and hence unusable.
| Quadrant | # 1 sec bins | Bins with >0 counts | Bins with >2000 counts | High rate bins dominated by noise | Noise dominated (total time) | Noise dominated (detector-on time) | Marked lightcurve |
|---|---|---|---|---|---|---|---|
| A | 7527 | 6512 | 11 | 11 | 0.15% | 0.17% |  |
| B | 7527 | 6512 | 4 | 4 | 0.05% | 0.06% | 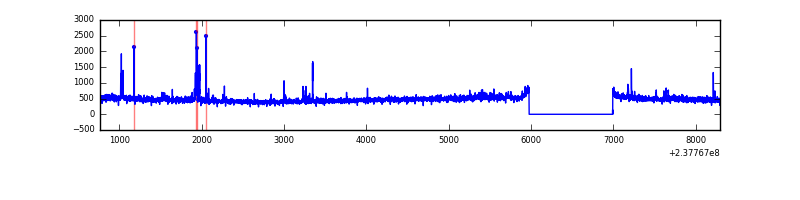 |
| C | 7527 | 6512 | 3 | 3 | 0.04% | 0.05% | 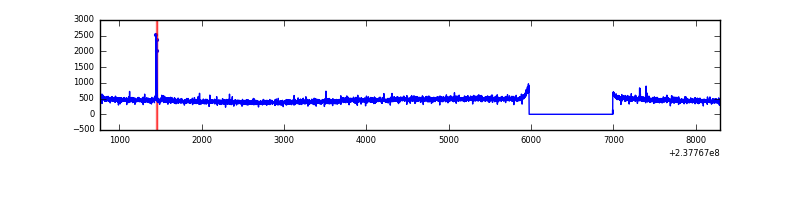 |
| D | 7527 | 6512 | 60 | 60 | 0.80% | 0.92% | 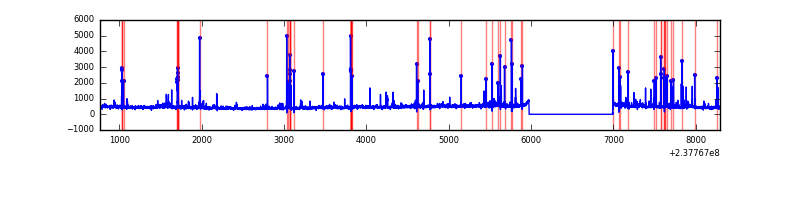 |
Top three noisy pixels from each quadrant. If the there are fewer than three noisy pixels in the level2.evt file, extra rows are filled as -1
| Pixel properties | Quadrant properties | ||||||
|---|---|---|---|---|---|---|---|
| Quadrant | DetID | PixID | Counts | Sigma | Mean | Median | Sigma |
| A | 14 | 111 | 566636 | 3787.92 | 727 | 711 | 149.4 |
| A | 15 | 174 | 8049 | 49.11 | 727 | 711 | 149.4 |
| A | 0 | 226 | 6648 | 39.73 | 727 | 711 | 149.4 |
| B | 0 | 214 | 69106 | 464.61 | 769 | 750 | 147.1 |
| B | 0 | 189 | 21805 | 143.11 | 769 | 750 | 147.1 |
| B | 12 | 111 | 15942 | 103.26 | 769 | 750 | 147.1 |
| C | 14 | 234 | 19105 | 106.55 | 739 | 743 | 172.3 |
| C | 14 | 238 | 5965 | 30.3 | 739 | 743 | 172.3 |
| C | 13 | 61 | 5464 | 27.39 | 739 | 743 | 172.3 |
| D | 1 | 52 | 344654 | 1907.35 | 726 | 707 | 180.3 |
| D | 10 | 172 | 40755 | 222.09 | 726 | 707 | 180.3 |
| D | 12 | 233 | 35136 | 190.93 | 726 | 707 | 180.3 |
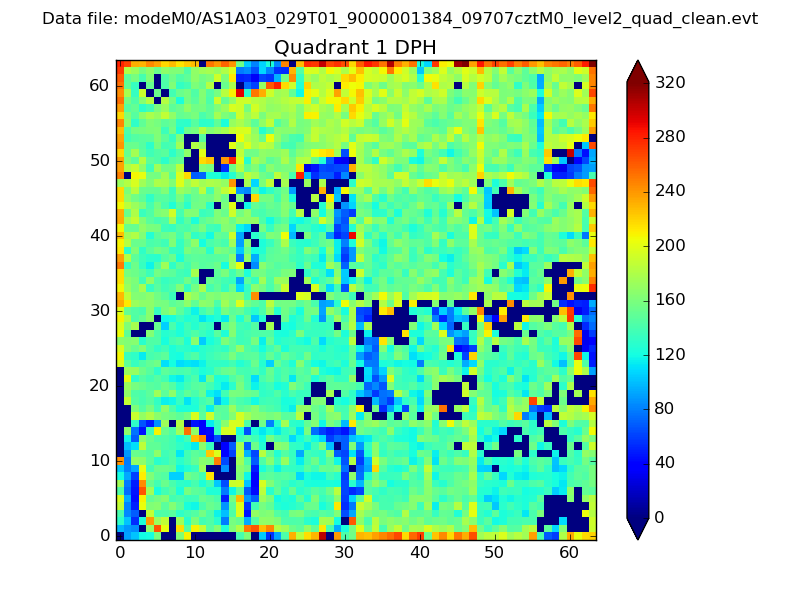
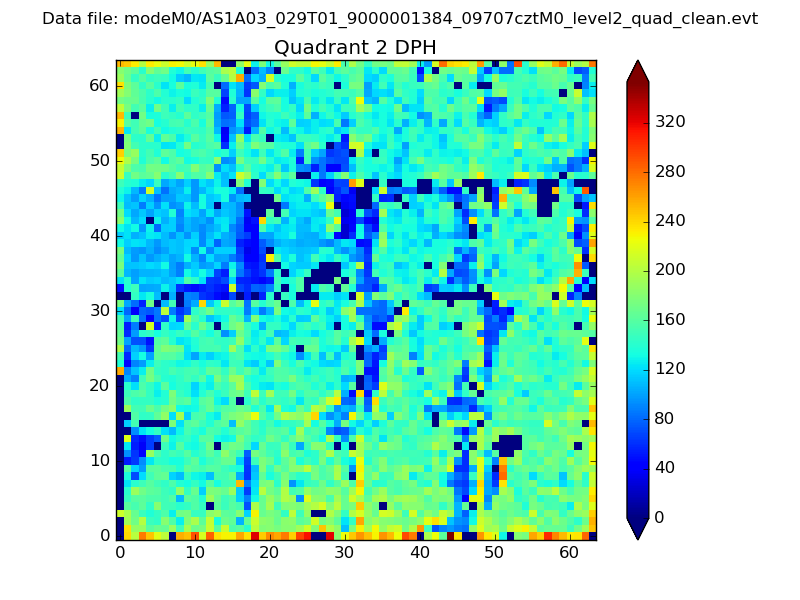
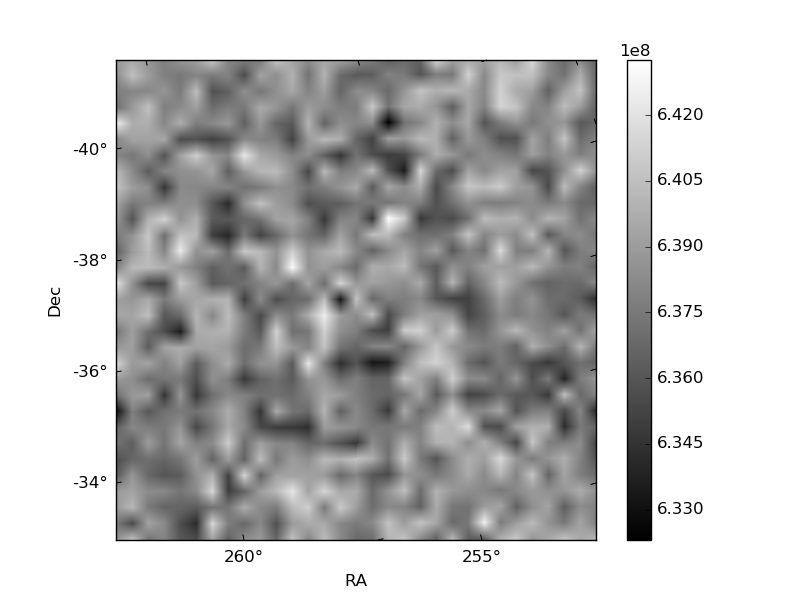
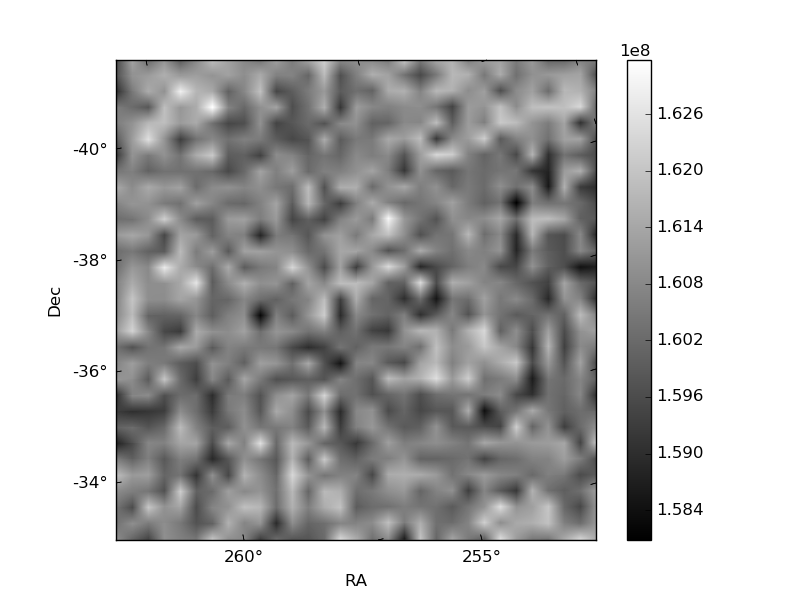
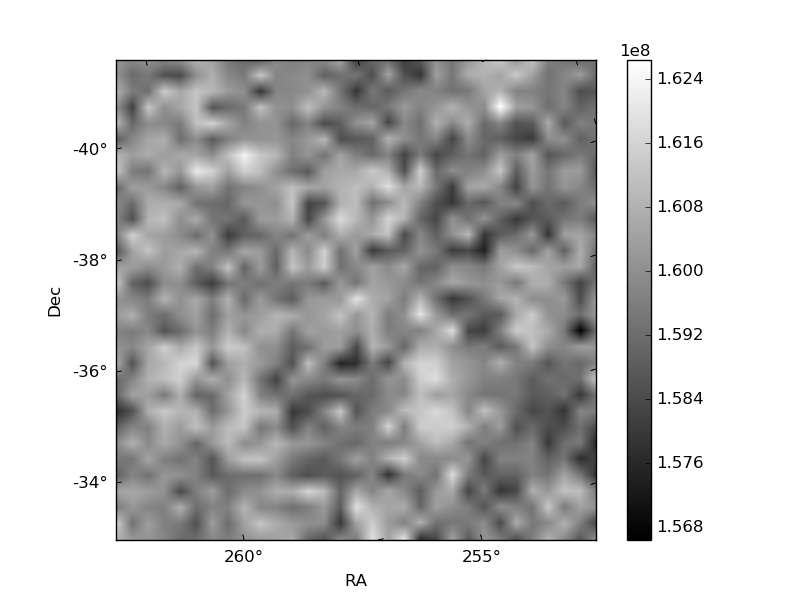
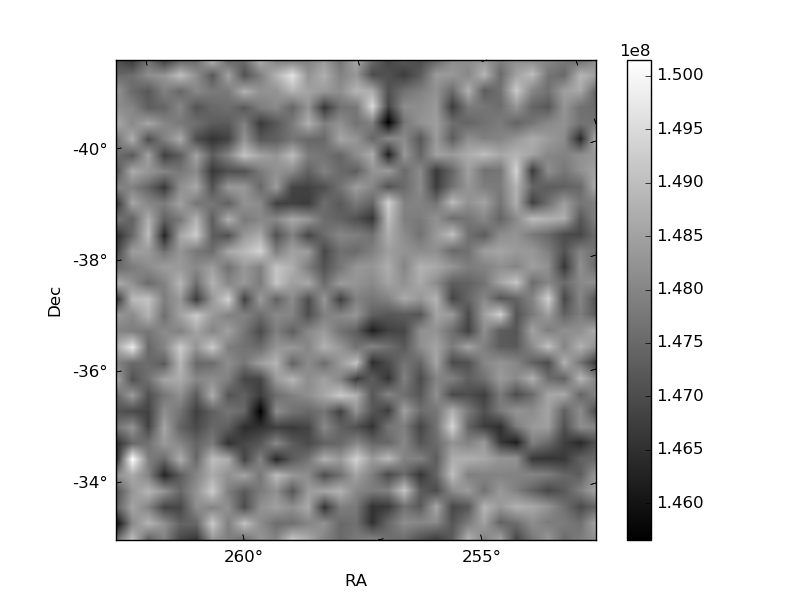
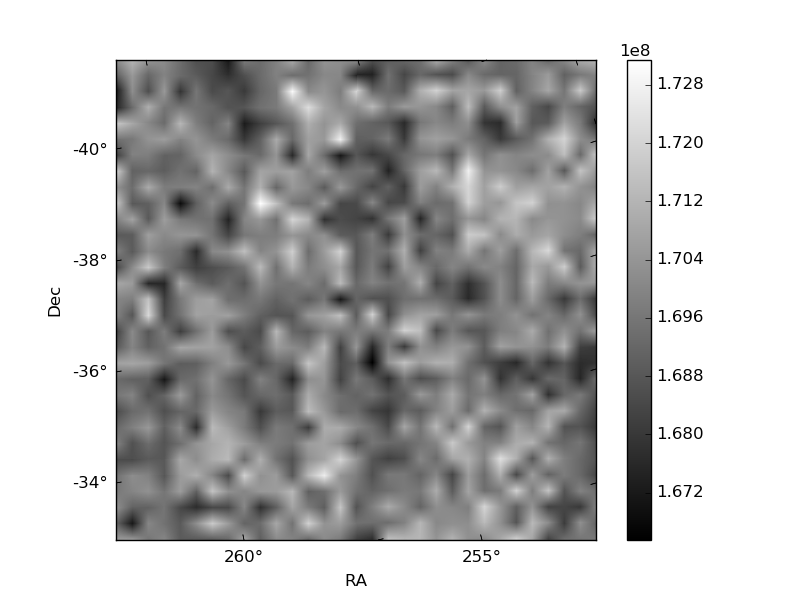
Histogram calculated using DETX and DETY for each event in the final _common_clean file
| Quadrant A | 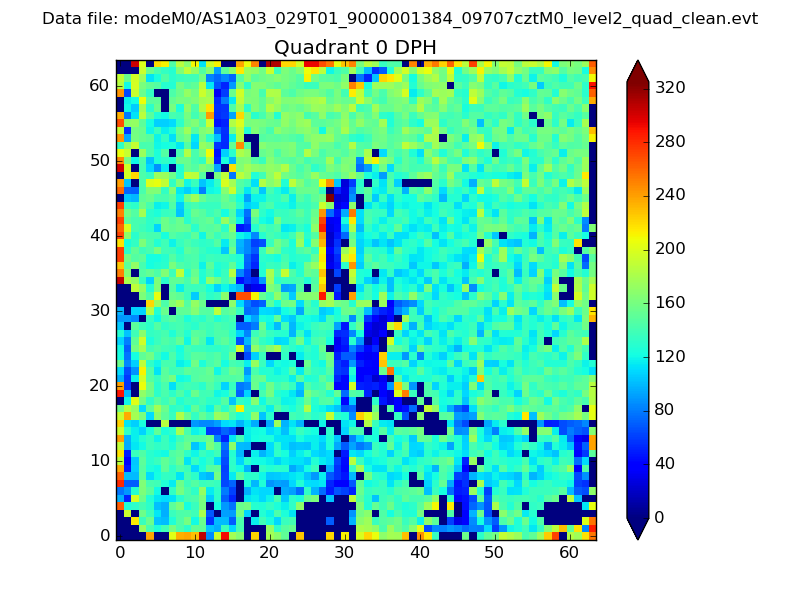 |
 |
Quadrant B |
|---|---|---|---|
| Quadrant D | 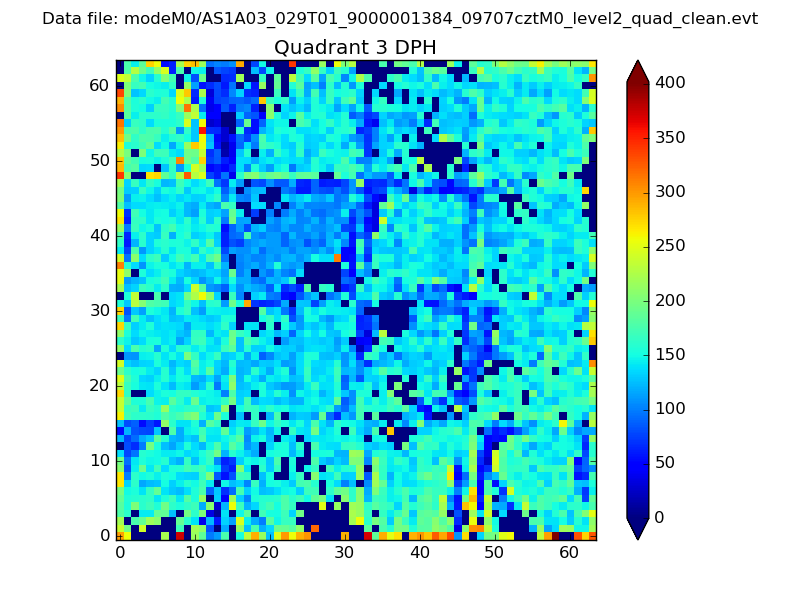 |
 |
Quadrant C |
| Plot type | Count rate plots | Images |
|---|---|---|
| Comparison with Poisson distribution Blue bars denote a histogram of data divided into 1 sec bins. Red curve is a Poisson curve with rate = median count rate of data. |
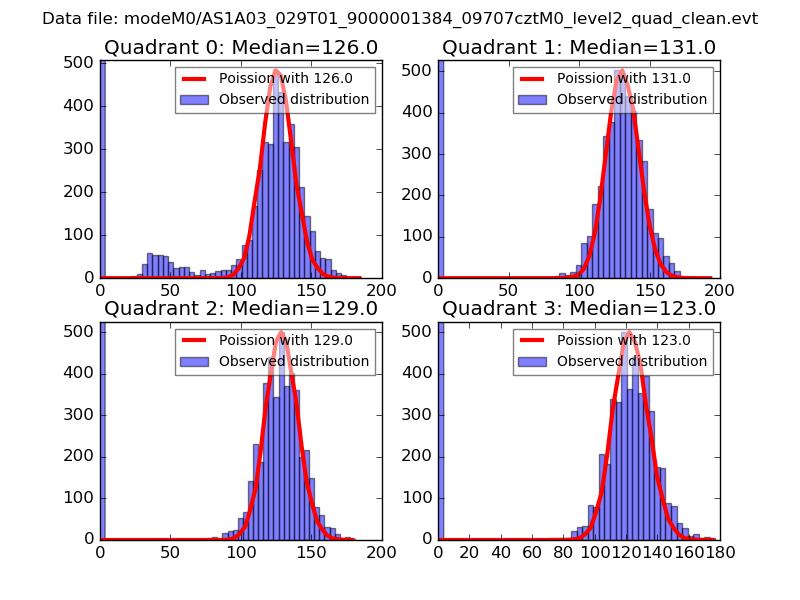 |
 |
| Quadrant-wise count rates Data is divided into 100 sec bins |
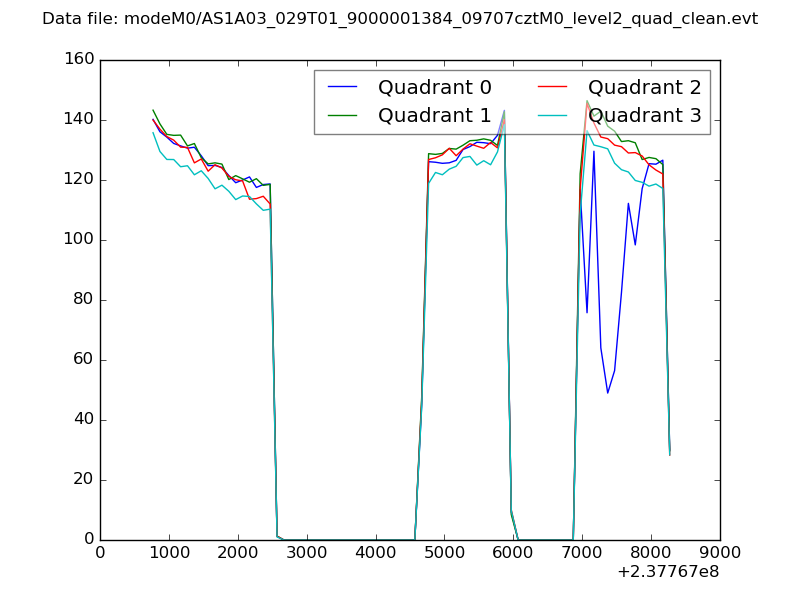 |
|
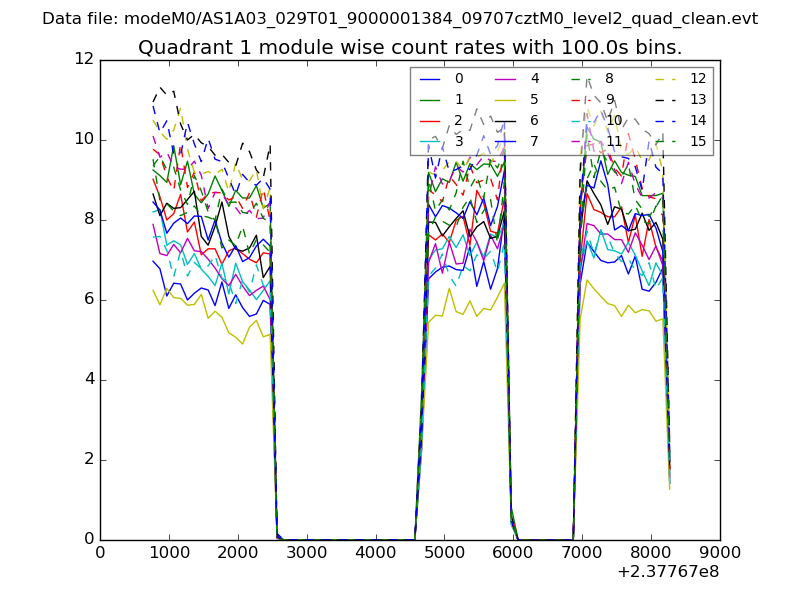
| Module-wise count rates for Quadrant A Data is divided into 100 sec bins |
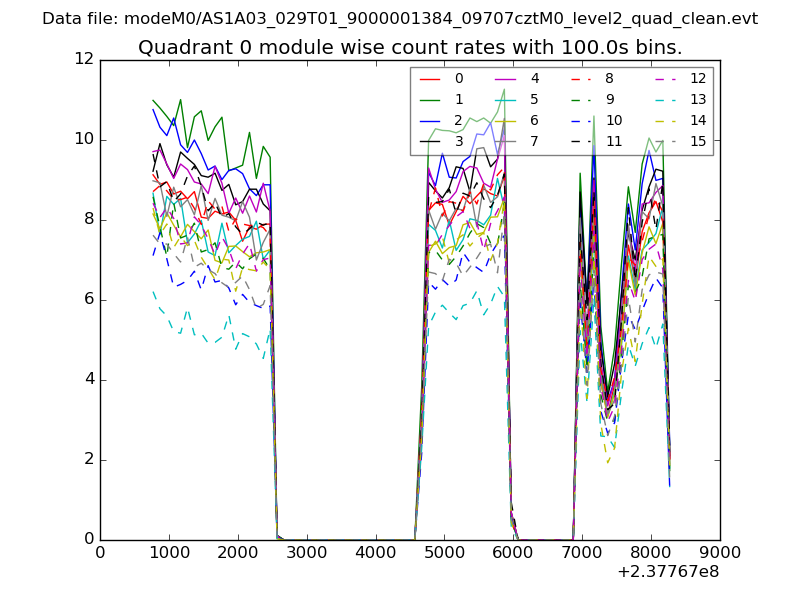 |
 |
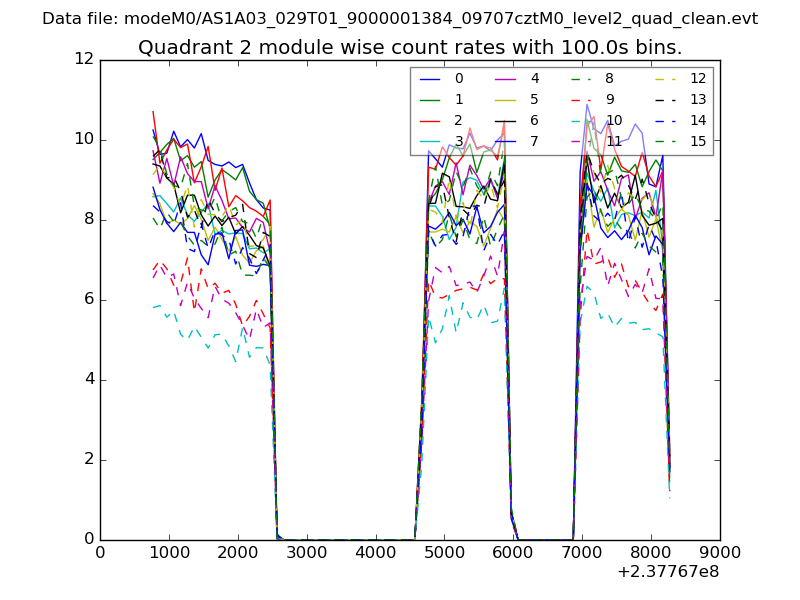
| Module-wise count rates for Quadrant B Data is divided into 100 sec bins |
 |
 |
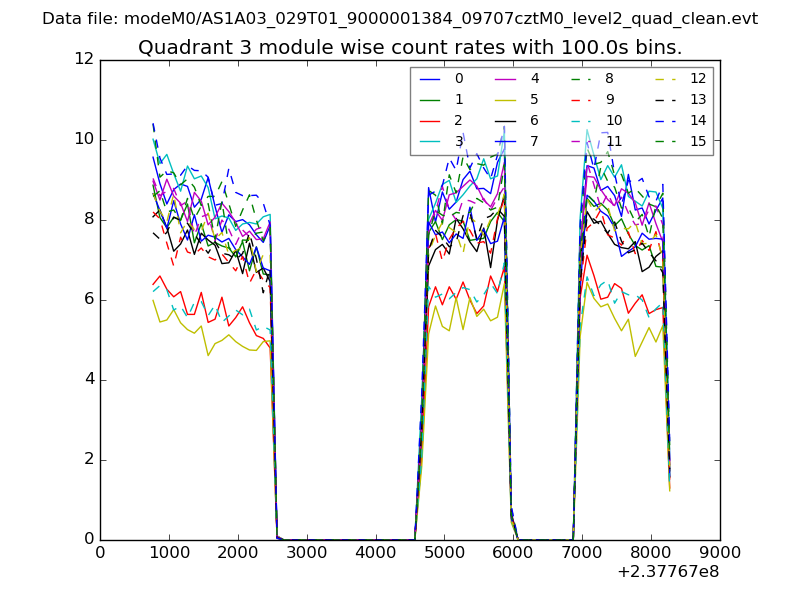
| Module-wise count rates for Quadrant C Data is divided into 100 sec bins |
 |
 |
| Module-wise count rates for Quadrant D Data is divided into 100 sec bins |
 |
 |
| Parameter | Plot |
|---|---|
| CZT HV Monitor | 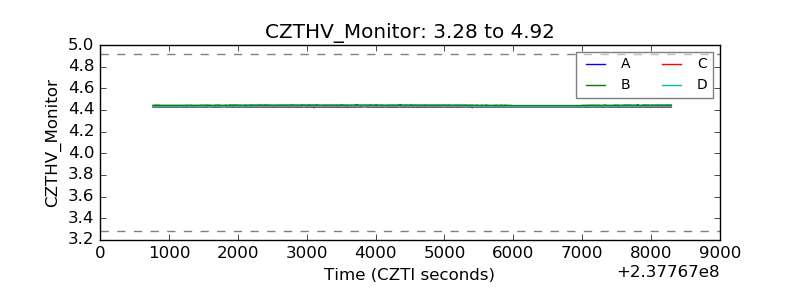 |
| D_VDD | 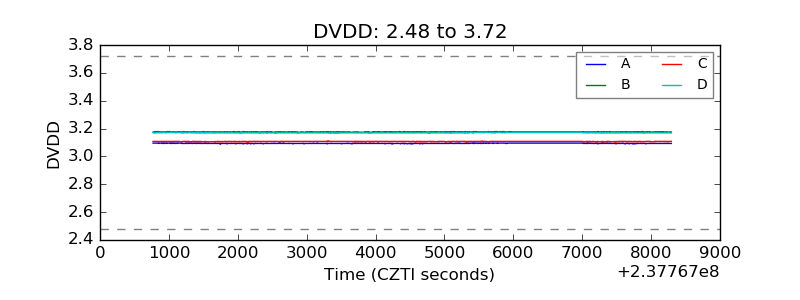 |
| Temperature 1 | 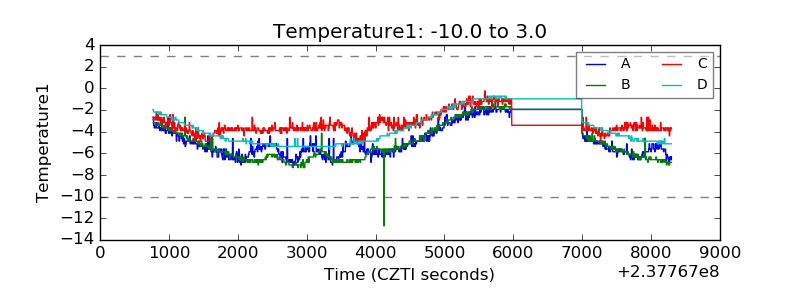 |
| Veto HV Monitor |  |
| Veto LLD | 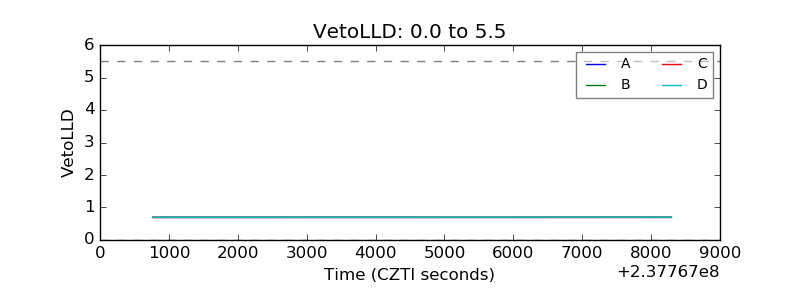 |
| Alpha Counter | 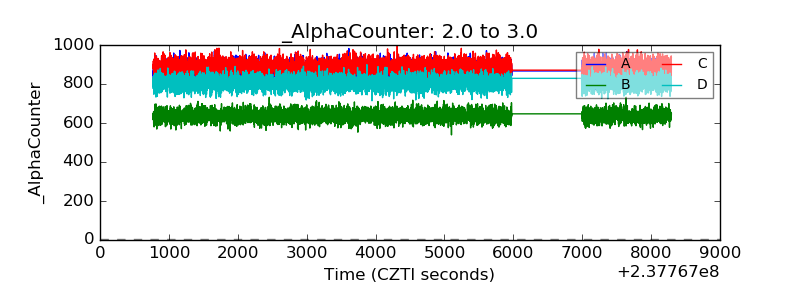 |
| _CPM_Rate | 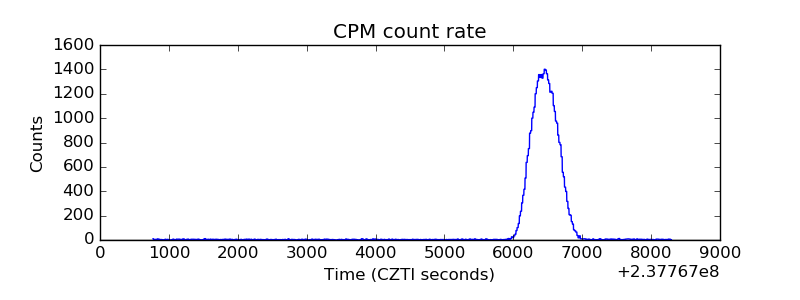 |
| CZT Counter | 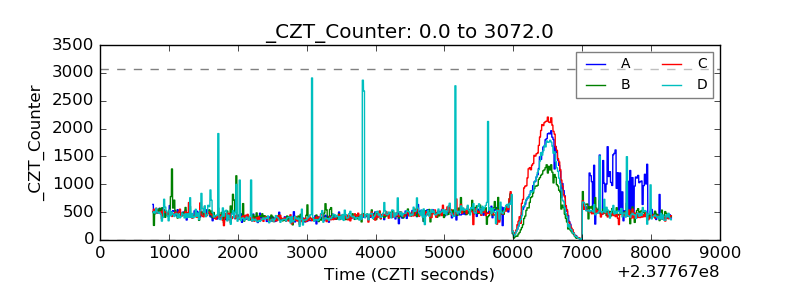 |
| +2.5 Volts monitor |  |
| +5 Volts monitor |  |
| _ROLL_ROT | 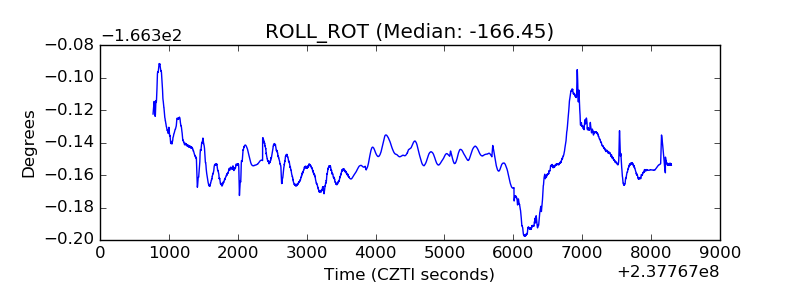 |
| _Roll_DEC | 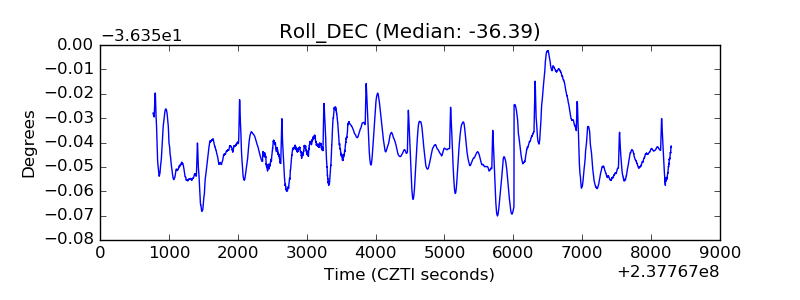 |
| _Roll_RA | 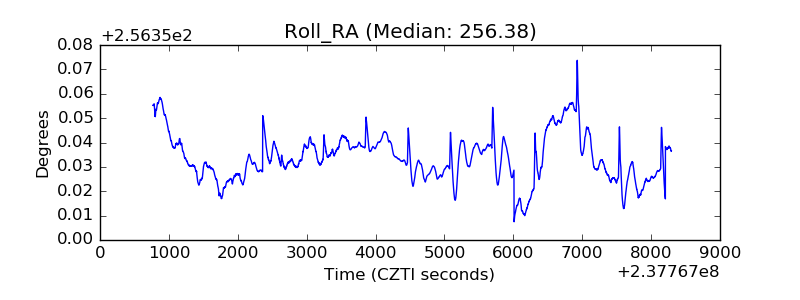 |
| Veto Counter | 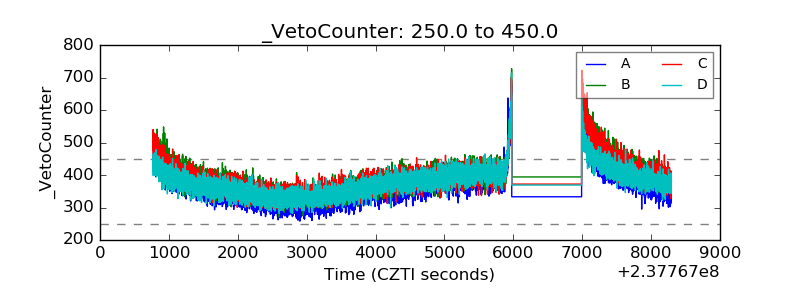 |