| Param | Original file | Final file |
|---|---|---|
| Filename | modeM0/AS1A03_029T01_9000001384_09711cztM0_level2.evt | modeM0/AS1A03_029T01_9000001384_09711cztM0_level2_quad_clean.evt |
| Size (bytes) | 470,851,200 | 71,570,880 |
| Size | 449.0 MB | 68.3 MB |
| Events in quadrant A | 3,156,173 | 430,725 |
| Events in quadrant B | 3,310,602 | 442,059 |
| Events in quadrant C | 3,153,433 | 437,361 |
| Events in quadrant D | 4,207,298 | 412,474 |
| Mode M0 | |||
|---|---|---|---|
| Quadrant | BADHDUFLAG | Total packets | Discarded packets |
| A | 0 | 13216 | 3 |
| B | 0 | 13557 | 2 |
| C | 0 | 13210 | 2 |
| D | 0 | 16727 | 2 |
| Mode M9 | |||
|---|---|---|---|
| Quadrant | BADHDUFLAG | Total packets | Discarded packets |
| A | 0 | 21 | 0 |
| B | 0 | 21 | 0 |
| C | 0 | 21 | 0 |
| D | 0 | 22 | 0 |
| Mode SS | |||
|---|---|---|---|
| Quadrant | BADHDUFLAG | Total packets | Discarded packets |
| A | 0 | 130 | 0 |
| B | 0 | 130 | 0 |
| C | 0 | 130 | 0 |
| D | 0 | 130 | 0 |
| Quadrant | Total seconds | Saturated seconds | Saturation percentage |
|---|---|---|---|
| A | 6367 | 28 | 0.439768% |
| B | 6367 | 37 | 0.581121% |
| C | 6367 | 31 | 0.486886% |
| D | 6367 | 67 | 1.052301% |
Noise dominated data is calculated using 1-second bins in cleaned event files. If a bin has >2000 counts, and if more than 50% of those come from <1% of pixels, then it is considered to be noise-dominated and hence unusable.
| Quadrant | # 1 sec bins | Bins with >0 counts | Bins with >2000 counts | High rate bins dominated by noise | Noise dominated (total time) | Noise dominated (detector-on time) | Marked lightcurve |
|---|---|---|---|---|---|---|---|
| A | 7682 | 6368 | 0 | 0 | 0.00% | 0.00% | 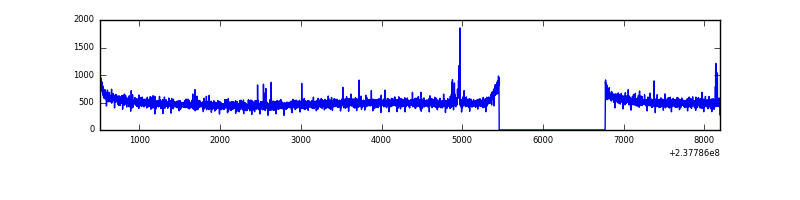 |
| B | 7682 | 6368 | 0 | 0 | 0.00% | 0.00% | 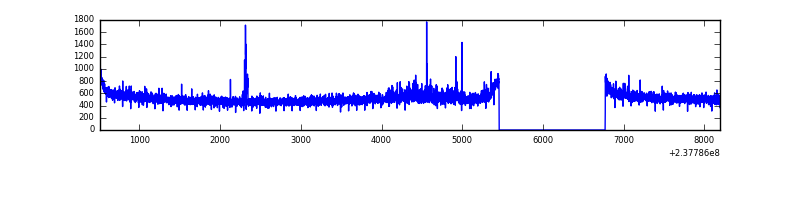 |
| C | 7682 | 6368 | 1 | 1 | 0.01% | 0.02% | 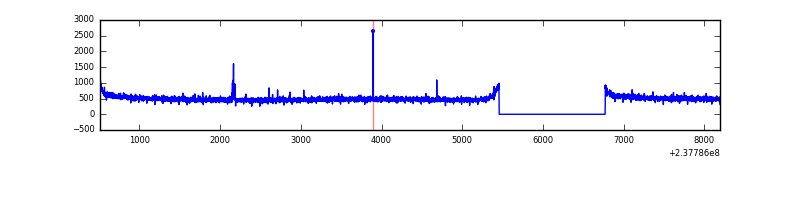 |
| D | 7682 | 6368 | 28 | 28 | 0.36% | 0.44% | 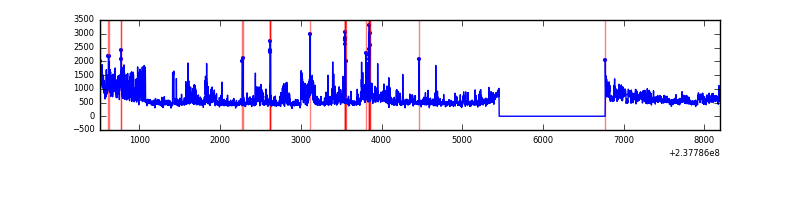 |
Top three noisy pixels from each quadrant. If the there are fewer than three noisy pixels in the level2.evt file, extra rows are filled as -1
| Pixel properties | Quadrant properties | ||||||
|---|---|---|---|---|---|---|---|
| Quadrant | DetID | PixID | Counts | Sigma | Mean | Median | Sigma |
| A | 15 | 174 | 12744 | 73.58 | 813 | 799 | 162.3 |
| A | 8 | 5 | 7749 | 42.81 | 813 | 799 | 162.3 |
| A | 0 | 226 | 7541 | 41.53 | 813 | 799 | 162.3 |
| B | 0 | 214 | 50888 | 327.43 | 824 | 806 | 153.0 |
| B | 0 | 85 | 33243 | 212.07 | 824 | 806 | 153.0 |
| B | 12 | 111 | 16558 | 102.99 | 824 | 806 | 153.0 |
| C | 14 | 234 | 13025 | 66.47 | 803 | 810 | 183.8 |
| C | 13 | 61 | 6080 | 28.68 | 803 | 810 | 183.8 |
| C | 12 | 4 | 4680 | 21.06 | 803 | 810 | 183.8 |
| D | 1 | 52 | 980741 | 5230.5 | 785 | 768 | 187.4 |
| D | 12 | 233 | 64960 | 342.62 | 785 | 768 | 187.4 |
| D | 8 | 195 | 60289 | 317.69 | 785 | 768 | 187.4 |
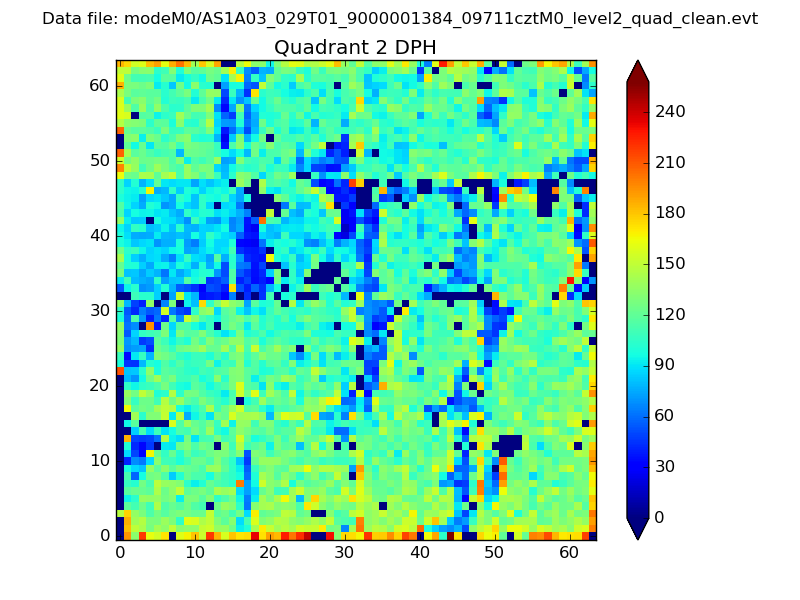
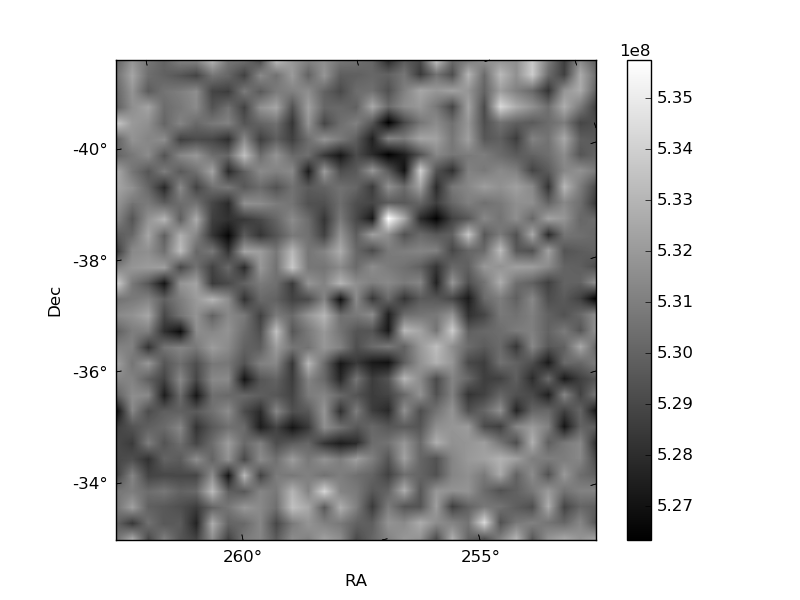
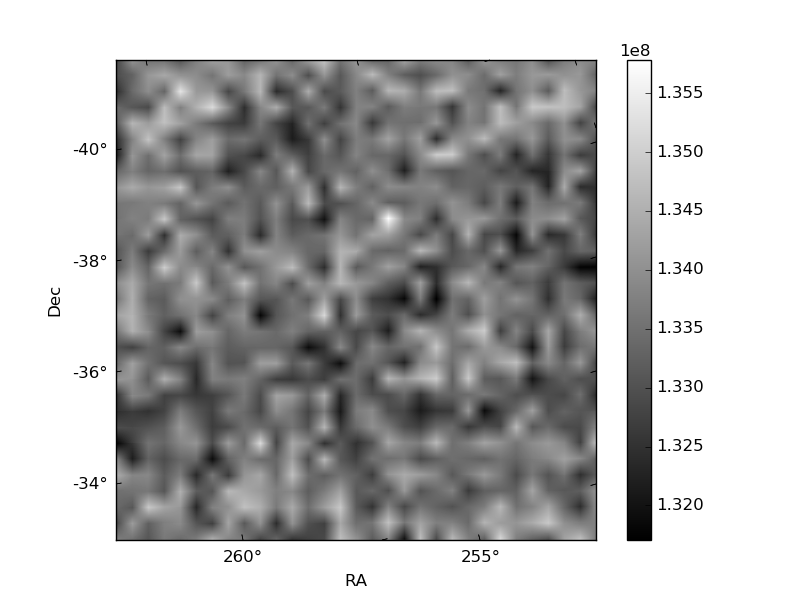
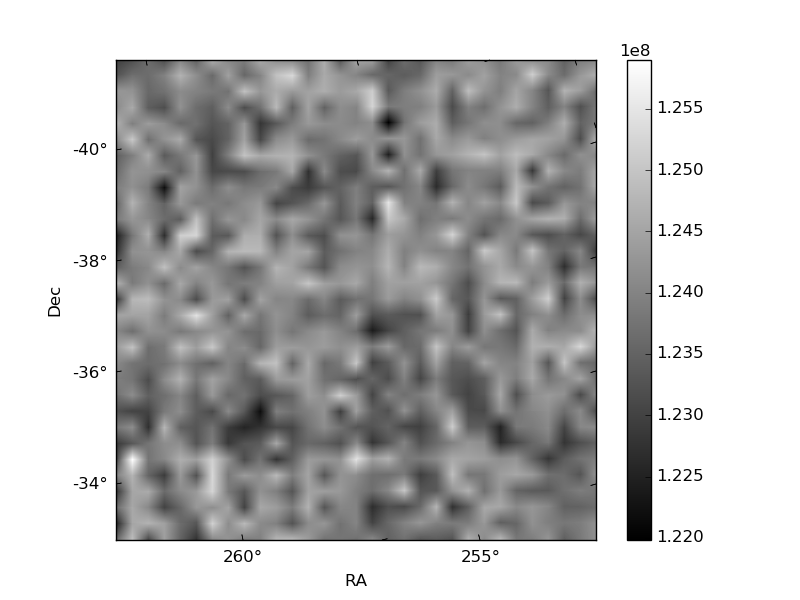
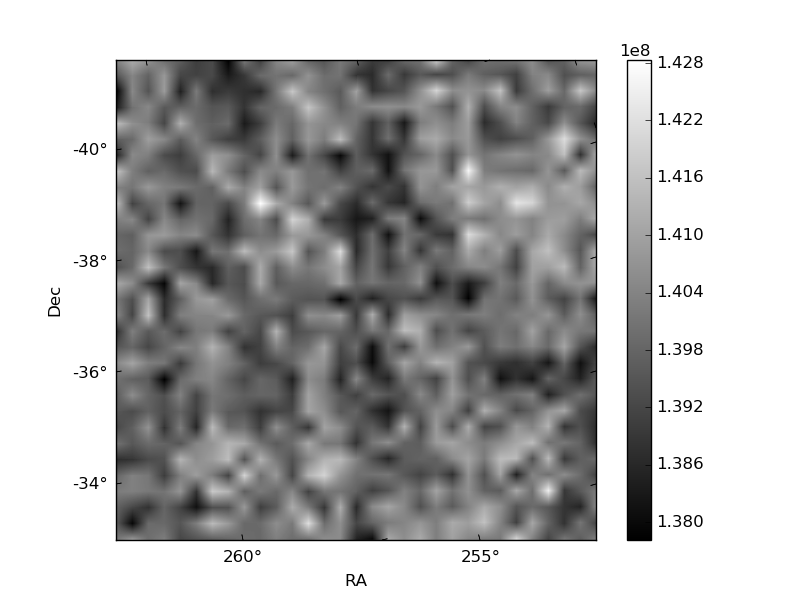
Histogram calculated using DETX and DETY for each event in the final _common_clean file
| Quadrant A | 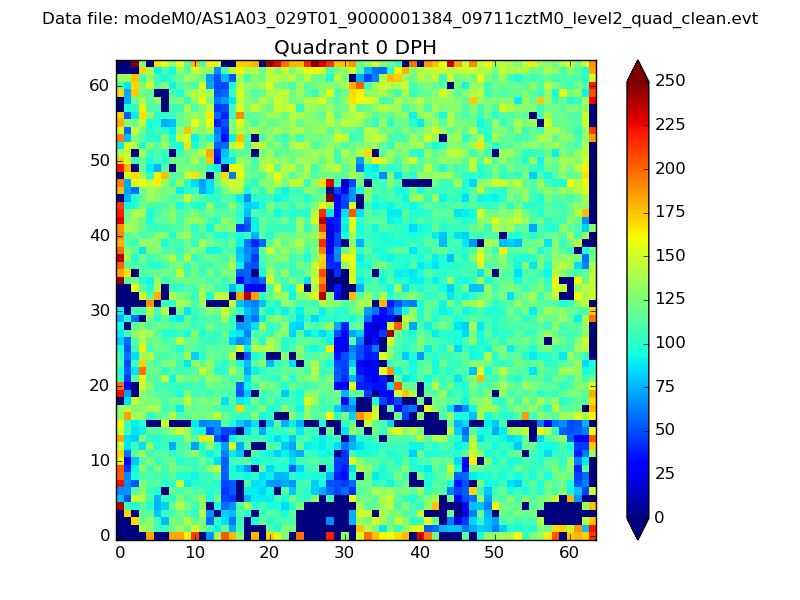 |
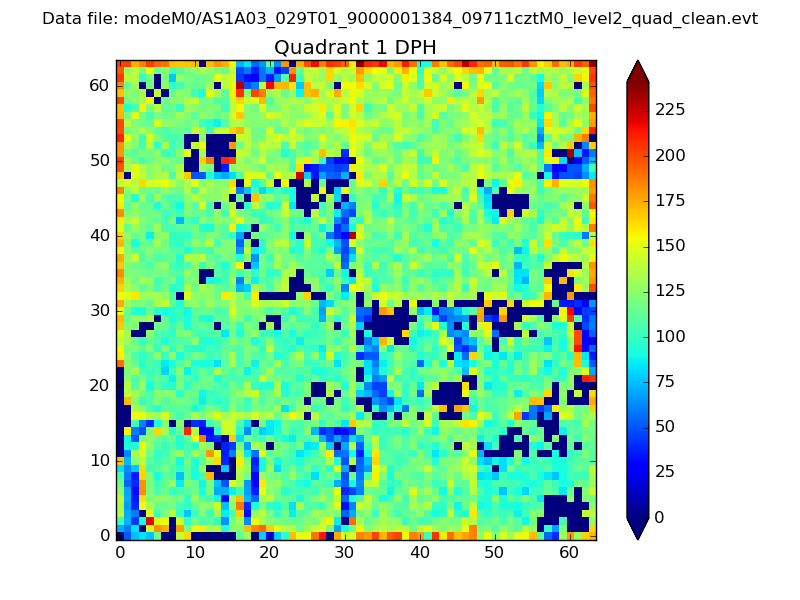 |
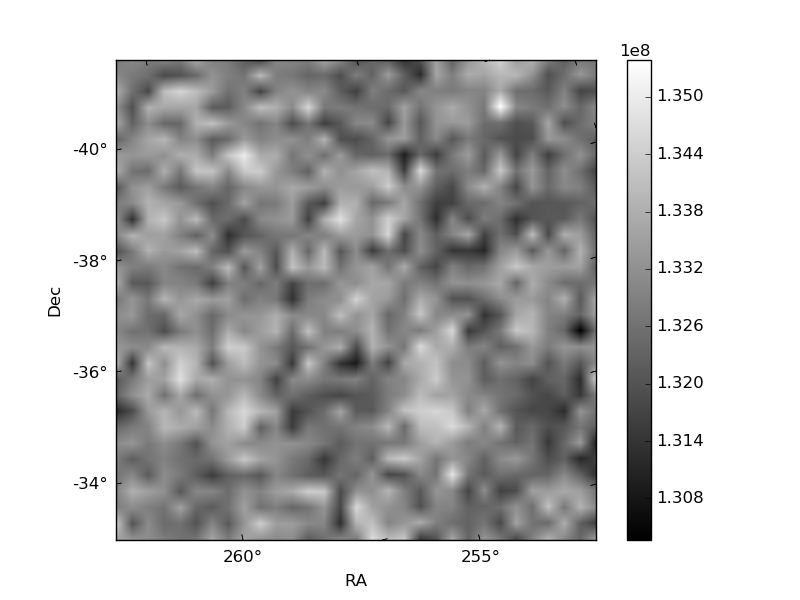
Quadrant B |
|---|---|---|---|
| Quadrant D | 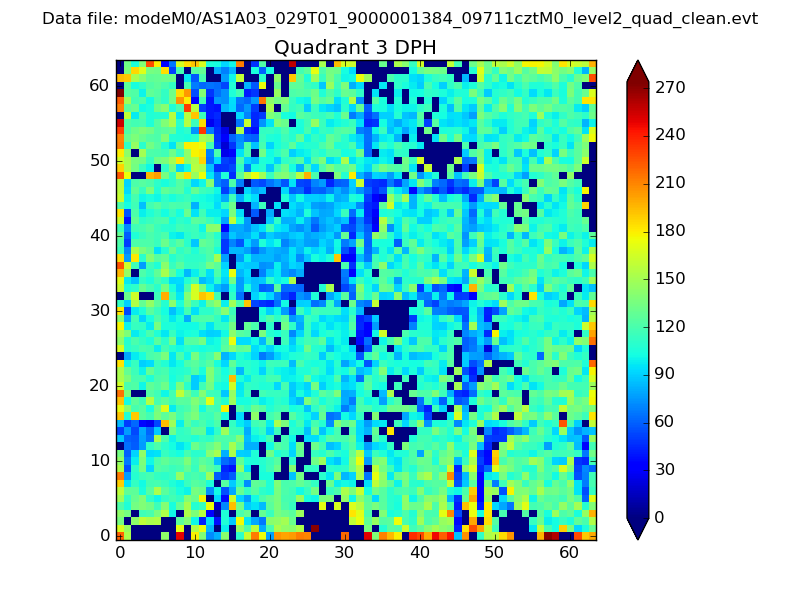 |
 |
Quadrant C |
| Plot type | Count rate plots | Images |
|---|---|---|
| Comparison with Poisson distribution Blue bars denote a histogram of data divided into 1 sec bins. Red curve is a Poisson curve with rate = median count rate of data. |
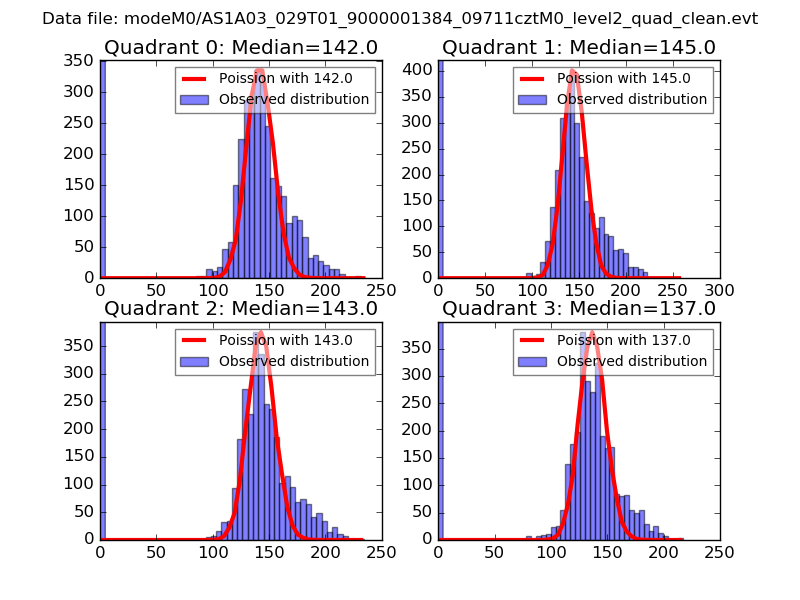 |
 |
| Quadrant-wise count rates Data is divided into 100 sec bins |
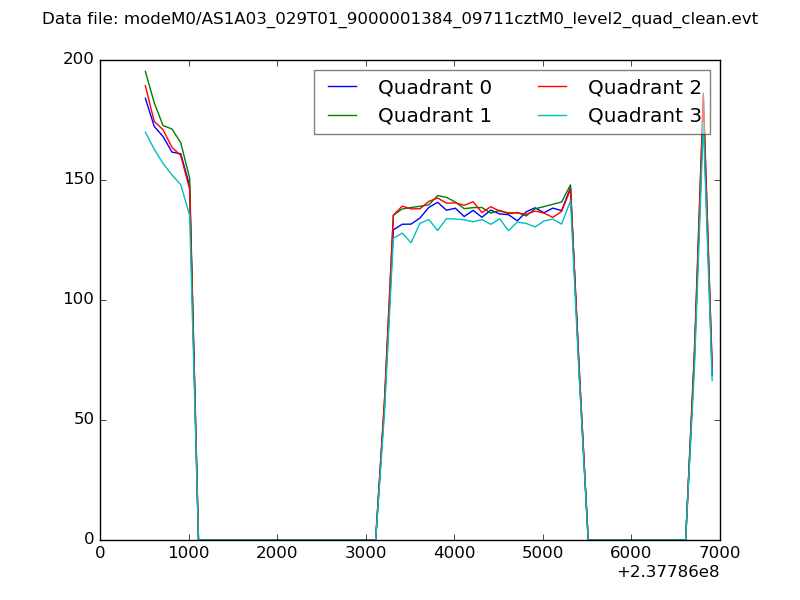 |
|
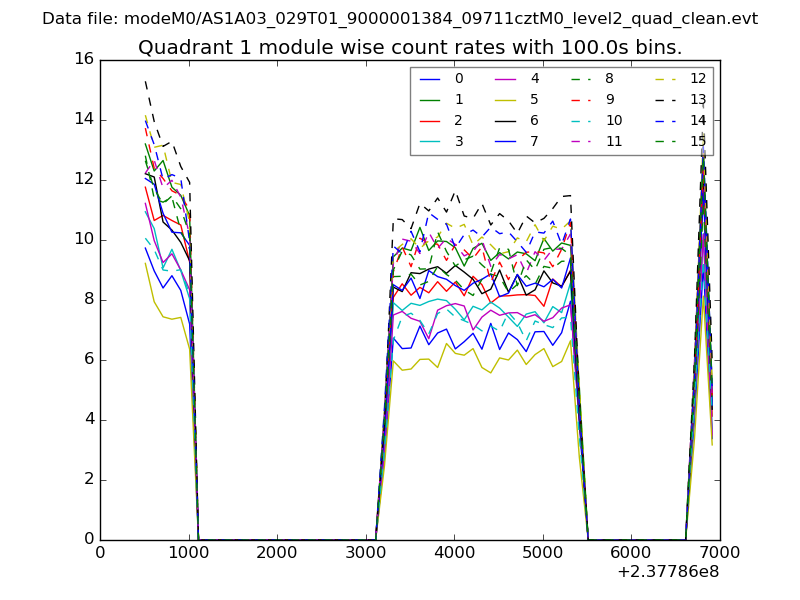
| Module-wise count rates for Quadrant A Data is divided into 100 sec bins |
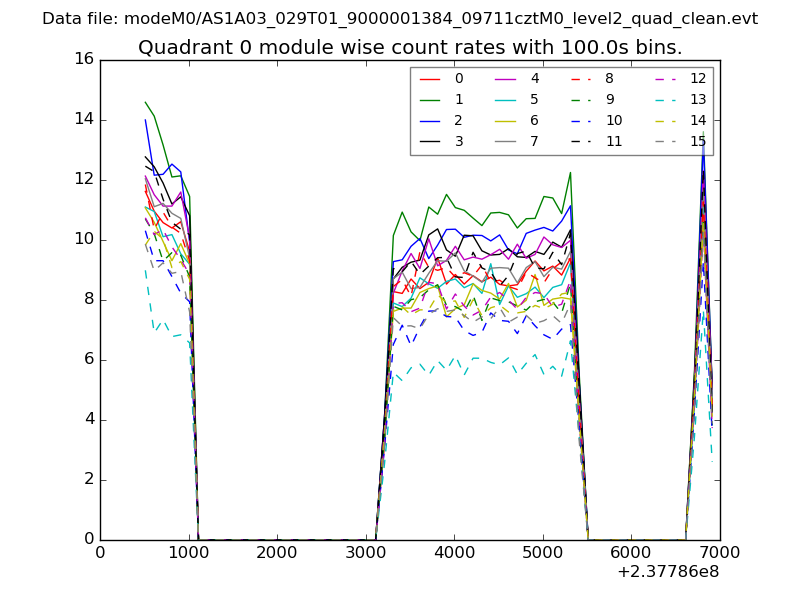 |
 |
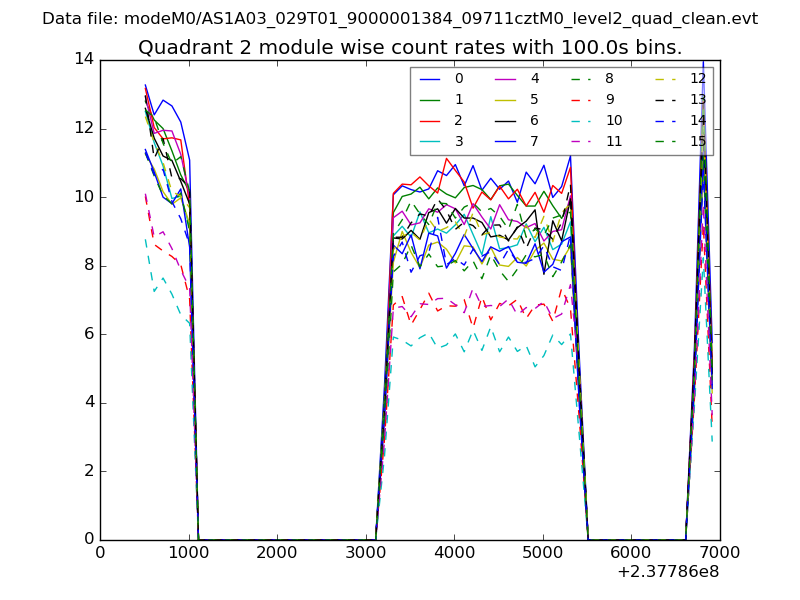
| Module-wise count rates for Quadrant B Data is divided into 100 sec bins |
 |
 |
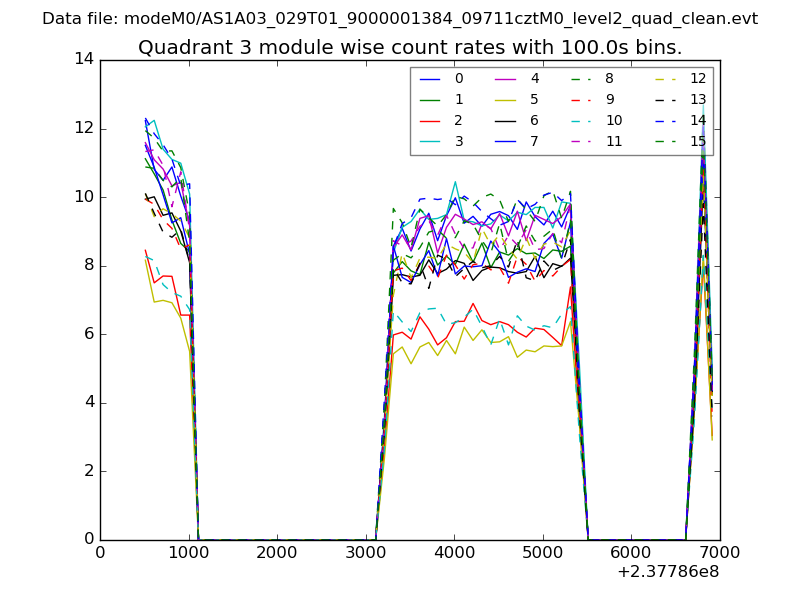
| Module-wise count rates for Quadrant C Data is divided into 100 sec bins |
 |
 |
| Module-wise count rates for Quadrant D Data is divided into 100 sec bins |
 |
 |
| Parameter | Plot |
|---|---|
| CZT HV Monitor | 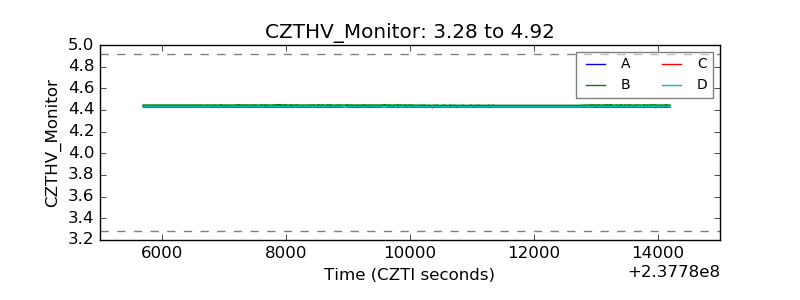 |
| D_VDD | 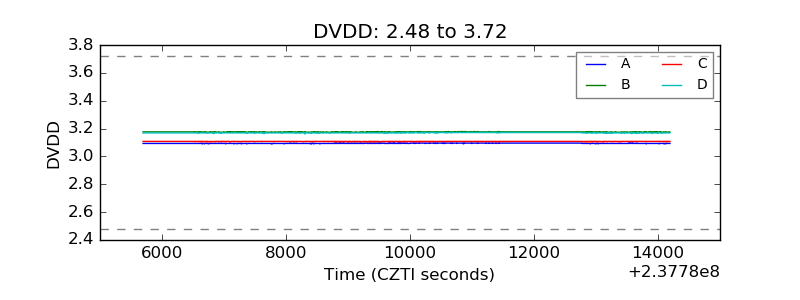 |
| Temperature 1 | 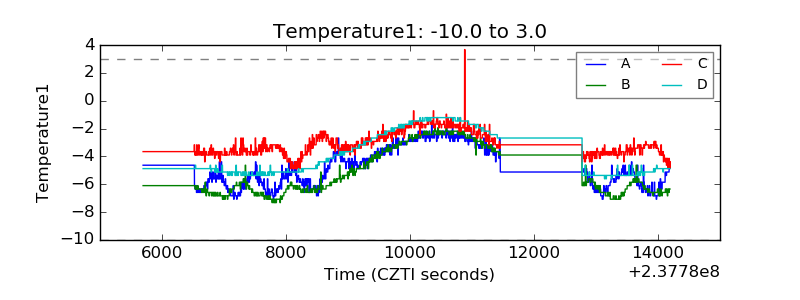 |
| Veto HV Monitor | 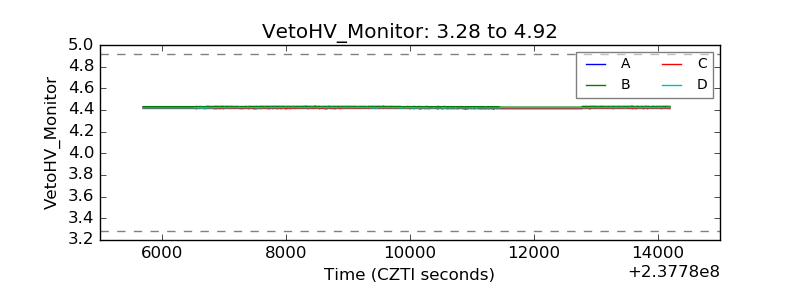 |
| Veto LLD | 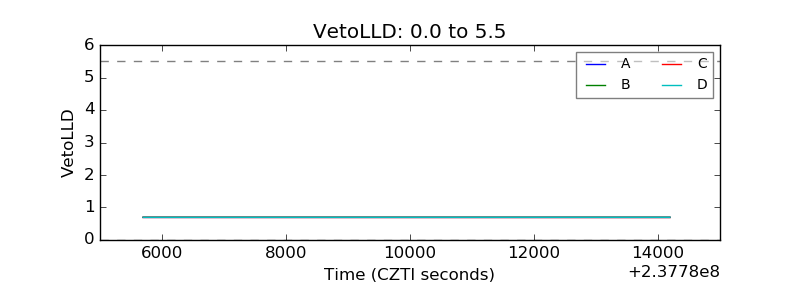 |
| Alpha Counter | 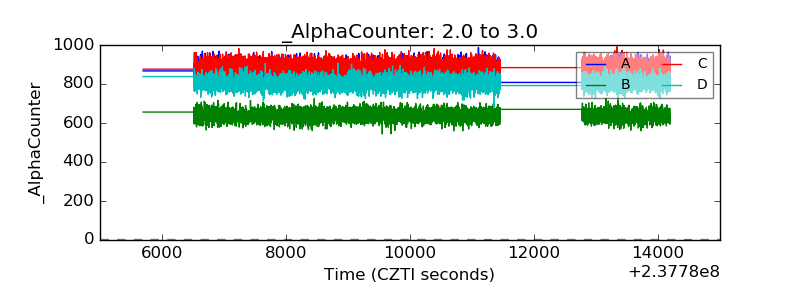 |
| _CPM_Rate | 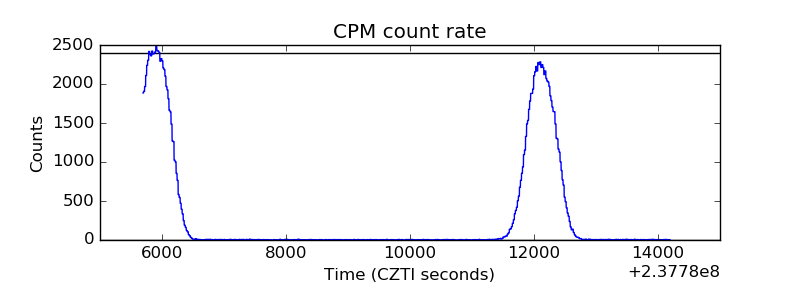 |
| CZT Counter | 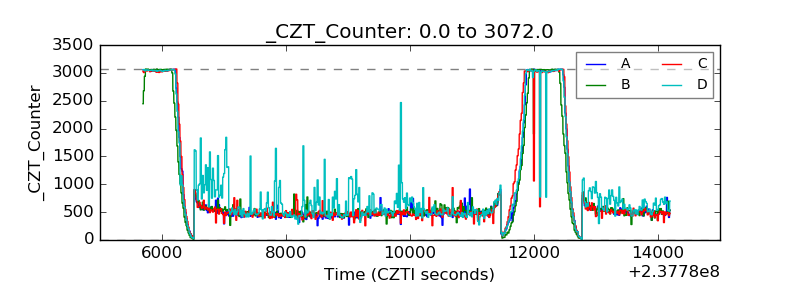 |
| +2.5 Volts monitor |  |
| +5 Volts monitor |  |
| _ROLL_ROT | 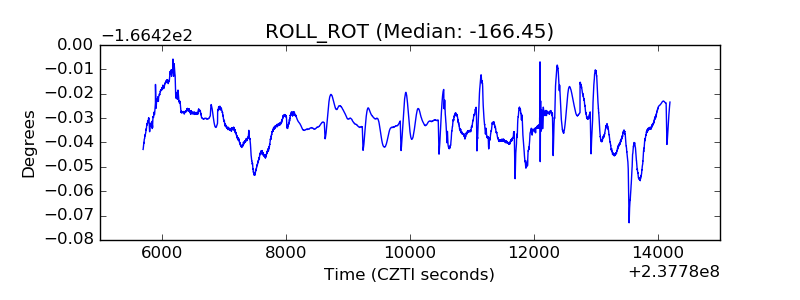 |
| _Roll_DEC | 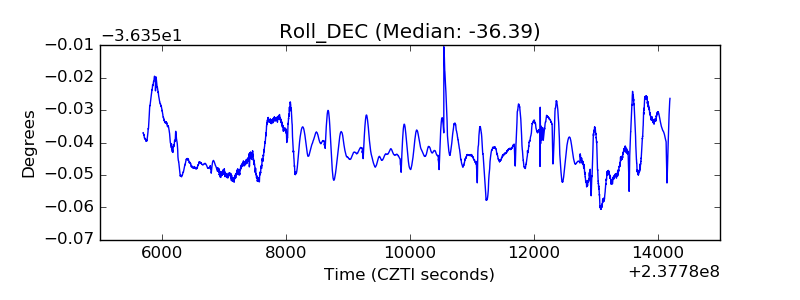 |
| _Roll_RA | 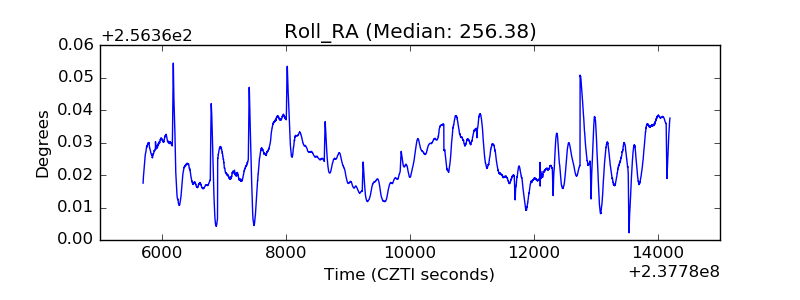 |
| Veto Counter | 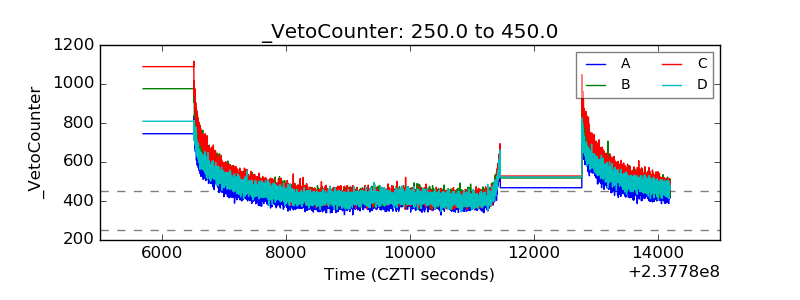 |