| Param | Original file | Final file |
|---|---|---|
| Filename | modeM0/AS1A03_029T01_9000001384_09713cztM0_level2.evt | modeM0/AS1A03_029T01_9000001384_09713cztM0_level2_quad_clean.evt |
| Size (bytes) | 457,030,080 | 68,088,960 |
| Size | 435.9 MB | 64.9 MB |
| Events in quadrant A | 3,118,415 | 406,365 |
| Events in quadrant B | 3,167,059 | 414,151 |
| Events in quadrant C | 3,123,639 | 411,304 |
| Events in quadrant D | 4,006,868 | 392,914 |
| Mode M0 | |||
|---|---|---|---|
| Quadrant | BADHDUFLAG | Total packets | Discarded packets |
| A | 0 | 13127 | 103 |
| B | 0 | 13190 | 115 |
| C | 0 | 13229 | 81 |
| D | 0 | 15969 | 106 |
| Mode M9 | |||
|---|---|---|---|
| Quadrant | BADHDUFLAG | Total packets | Discarded packets |
| A | 0 | 17 | 0 |
| B | 0 | 17 | 1 |
| C | 0 | 17 | 0 |
| D | 0 | 18 | 1 |
| Mode SS | |||
|---|---|---|---|
| Quadrant | BADHDUFLAG | Total packets | Discarded packets |
| A | 0 | 128 | 2 |
| B | 0 | 128 | 2 |
| C | 0 | 128 | 0 |
| D | 0 | 128 | 0 |
| Quadrant | Total seconds | Saturated seconds | Saturation percentage |
|---|---|---|---|
| A | 6255 | 74 | 1.183054% |
| B | 6250 | 95 | 1.520000% |
| C | 6264 | 79 | 1.261175% |
| D | 6264 | 118 | 1.883780% |
Noise dominated data is calculated using 1-second bins in cleaned event files. If a bin has >2000 counts, and if more than 50% of those come from <1% of pixels, then it is considered to be noise-dominated and hence unusable.
| Quadrant | # 1 sec bins | Bins with >0 counts | Bins with >2000 counts | High rate bins dominated by noise | Noise dominated (total time) | Noise dominated (detector-on time) | Marked lightcurve |
|---|---|---|---|---|---|---|---|
| A | 7542 | 6293 | 0 | 0 | 0.00% | 0.00% | 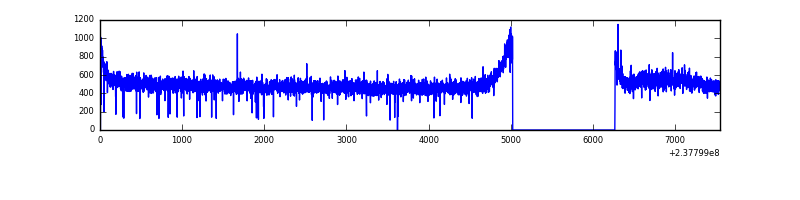 |
| B | 7540 | 6294 | 0 | 0 | 0.00% | 0.00% | 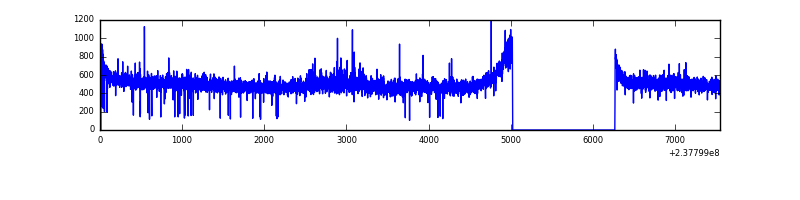 |
| C | 7543 | 6296 | 2 | 2 | 0.03% | 0.03% | 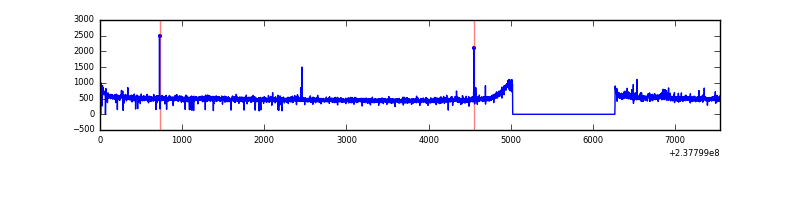 |
| D | 7543 | 6294 | 92 | 92 | 1.22% | 1.46% | 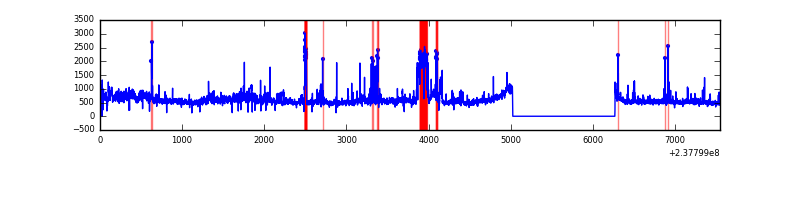 |
Top three noisy pixels from each quadrant. If the there are fewer than three noisy pixels in the level2.evt file, extra rows are filled as -1
| Pixel properties | Quadrant properties | ||||||
|---|---|---|---|---|---|---|---|
| Quadrant | DetID | PixID | Counts | Sigma | Mean | Median | Sigma |
| A | 14 | 111 | 47493 | 290.03 | 797 | 781 | 161.1 |
| A | 0 | 226 | 7295 | 40.44 | 797 | 781 | 161.1 |
| A | 12 | 194 | 6441 | 35.14 | 797 | 781 | 161.1 |
| B | 0 | 214 | 42290 | 273.25 | 802 | 784 | 151.9 |
| B | 12 | 111 | 16642 | 104.4 | 802 | 784 | 151.9 |
| B | 11 | 111 | 13648 | 84.69 | 802 | 784 | 151.9 |
| C | 9 | 68 | 38559 | 211.07 | 785 | 788 | 179.0 |
| C | 14 | 234 | 7819 | 39.29 | 785 | 788 | 179.0 |
| C | 13 | 61 | 5887 | 28.49 | 785 | 788 | 179.0 |
| D | 1 | 52 | 702449 | 3752.46 | 774 | 759 | 187.0 |
| D | 7 | 71 | 218061 | 1162.08 | 774 | 759 | 187.0 |
| D | 7 | 46 | 89567 | 474.92 | 774 | 759 | 187.0 |
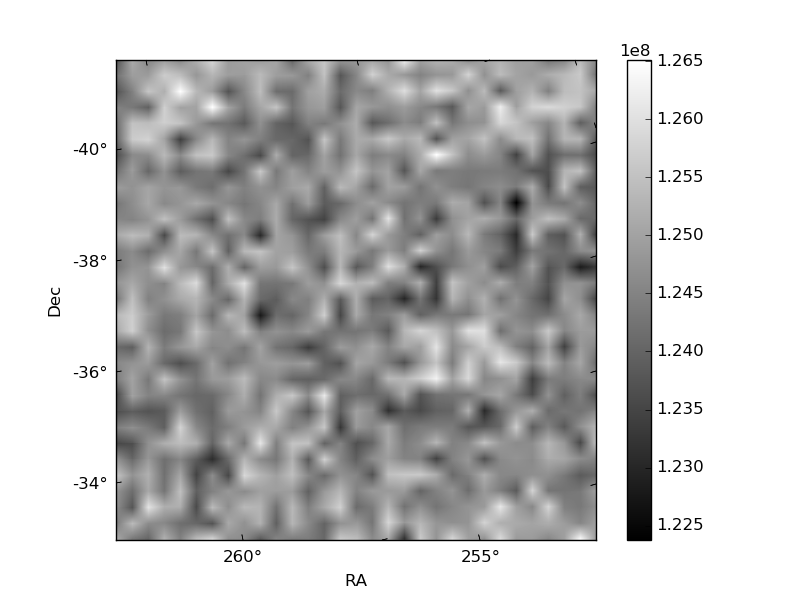
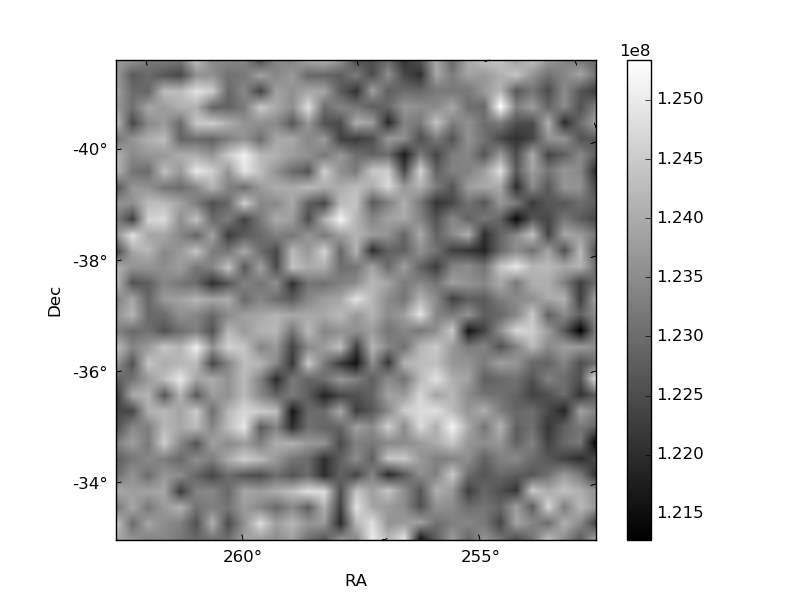
Histogram calculated using DETX and DETY for each event in the final _common_clean file
| Quadrant A |  |
 |
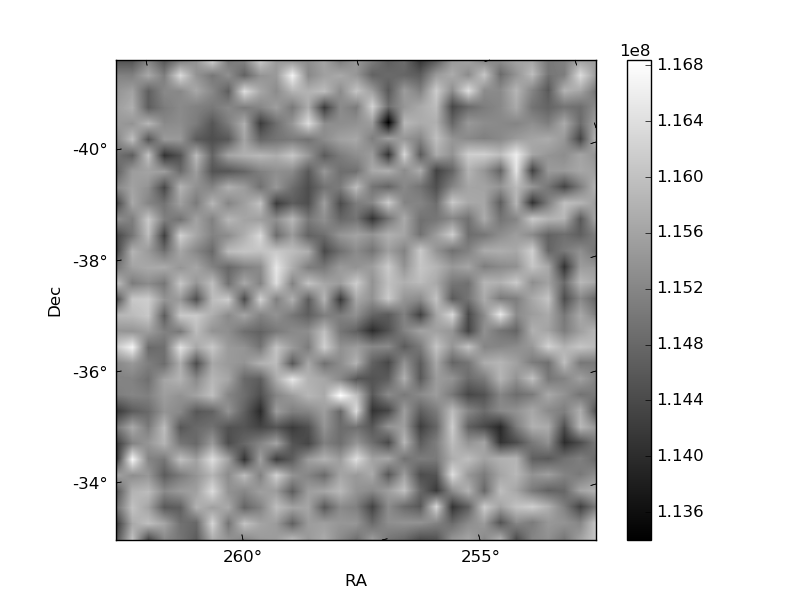
Quadrant B |
|---|---|---|---|
| Quadrant D |  |
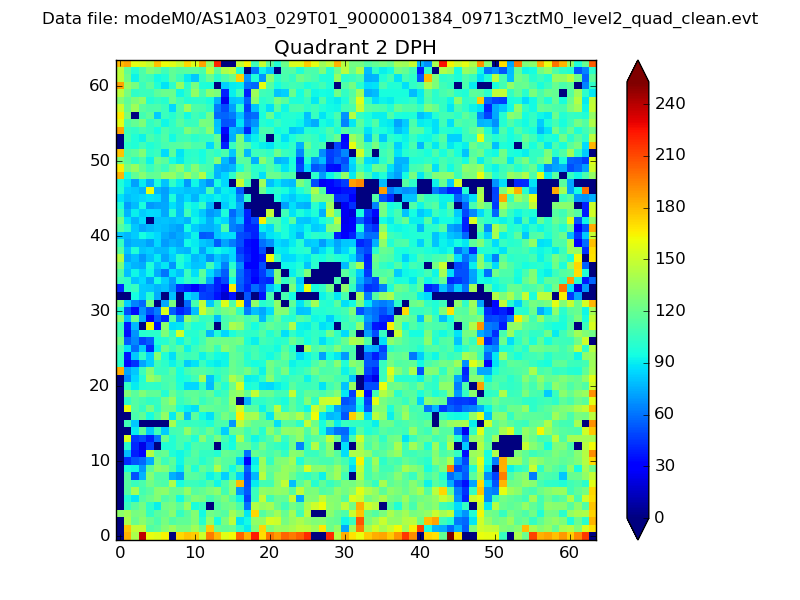 |
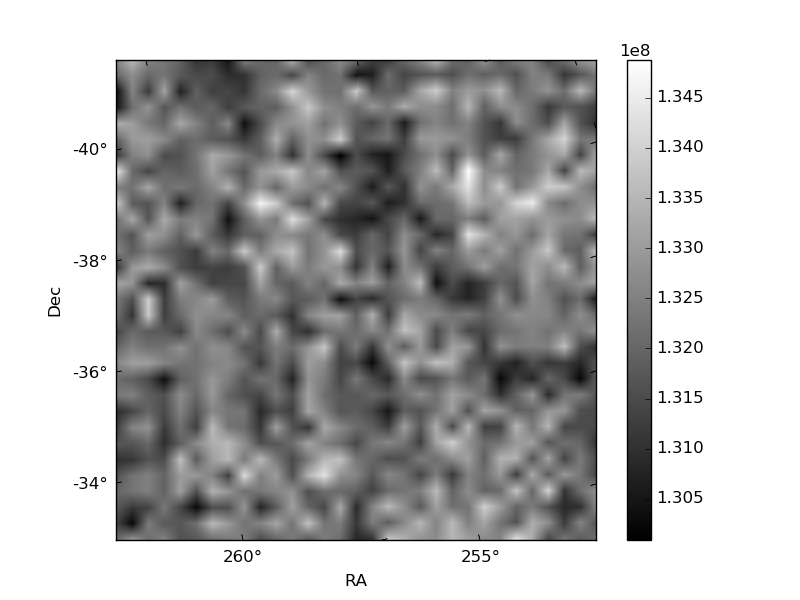
Quadrant C |
| Plot type | Count rate plots | Images |
|---|---|---|
| Comparison with Poisson distribution Blue bars denote a histogram of data divided into 1 sec bins. Red curve is a Poisson curve with rate = median count rate of data. |
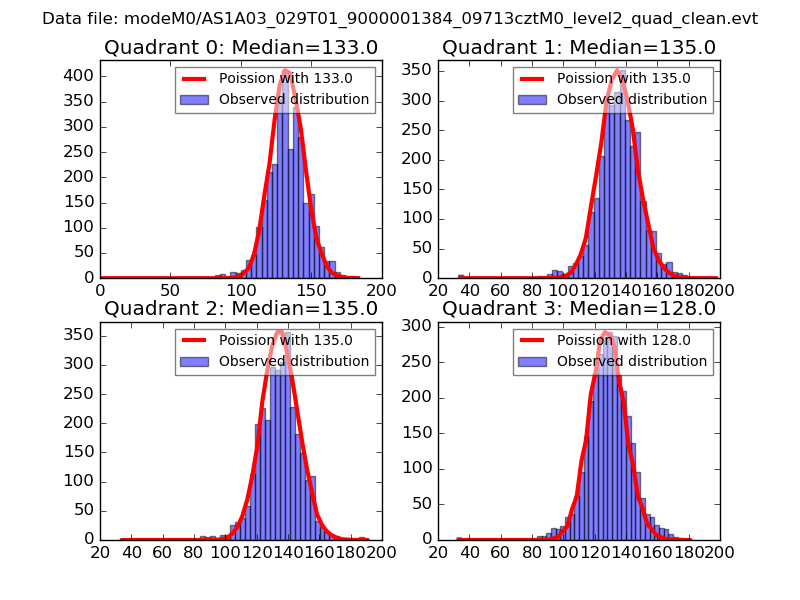 |
 |
| Quadrant-wise count rates Data is divided into 100 sec bins |
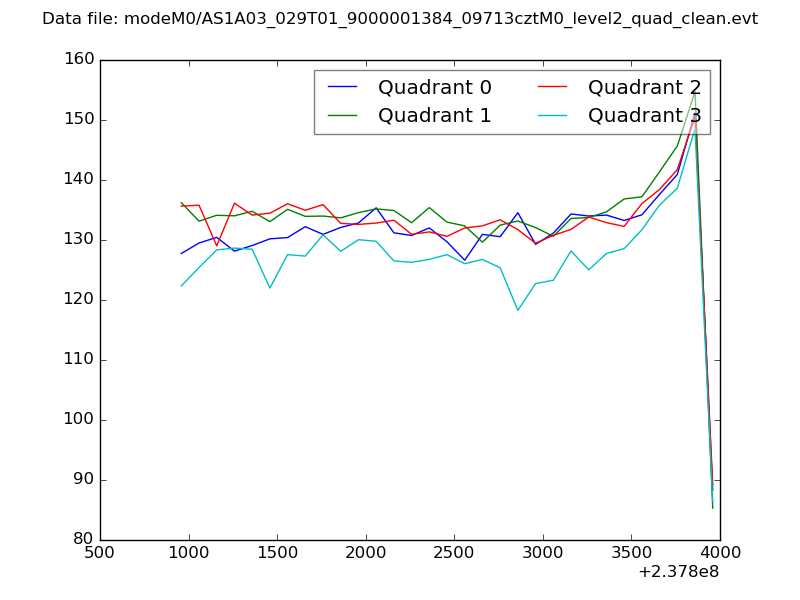 |
|
| Module-wise count rates for Quadrant A Data is divided into 100 sec bins |
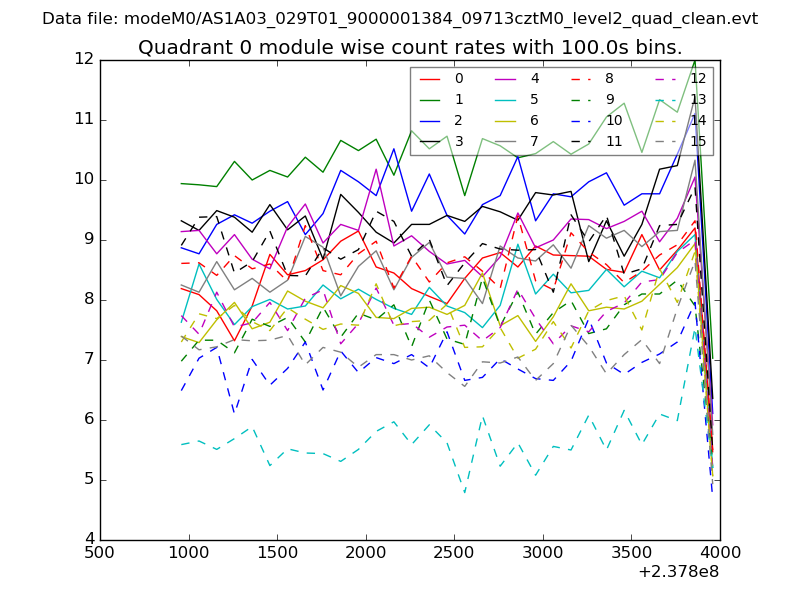 |
 |
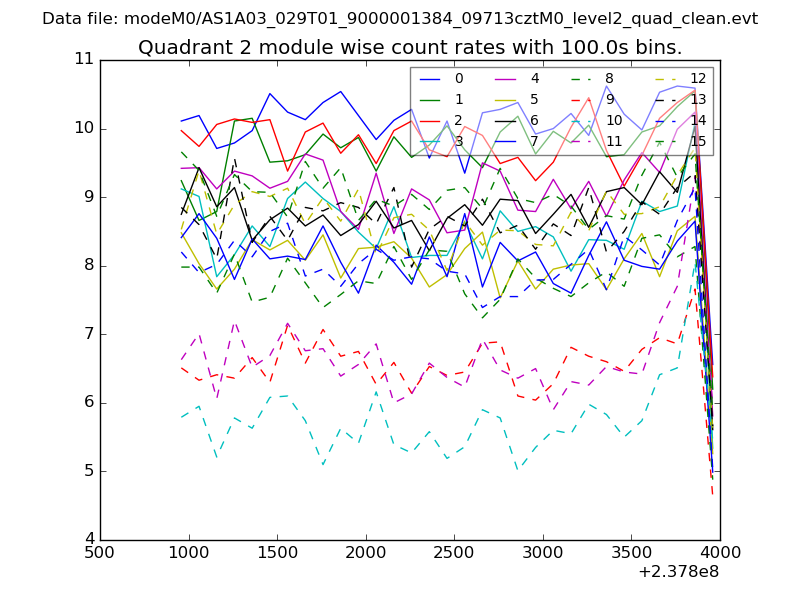
| Module-wise count rates for Quadrant B Data is divided into 100 sec bins |
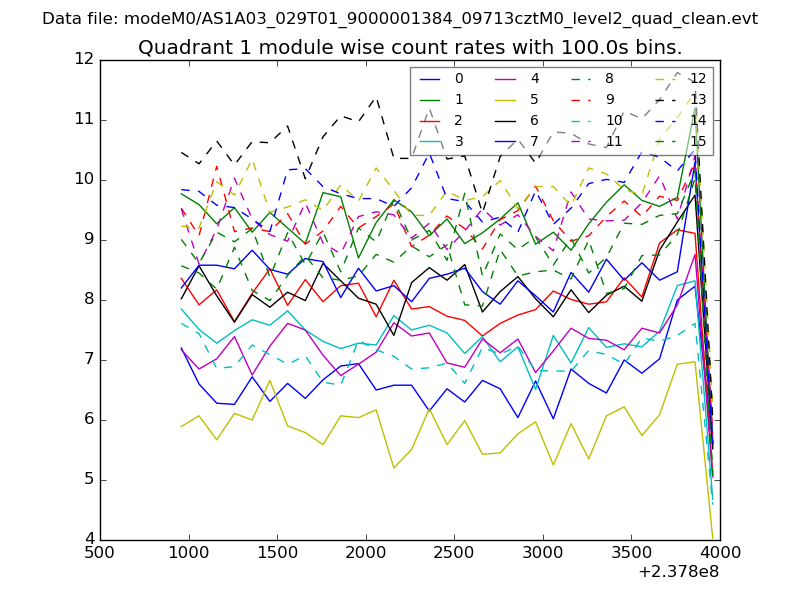 |
 |
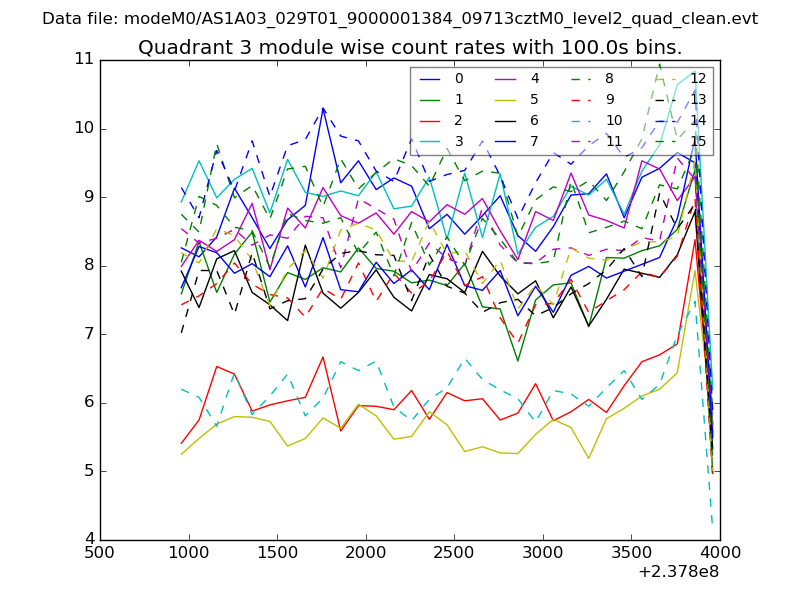
| Module-wise count rates for Quadrant C Data is divided into 100 sec bins |
 |
 |
| Module-wise count rates for Quadrant D Data is divided into 100 sec bins |
 |
 |
| Parameter | Plot |
|---|---|
| CZT HV Monitor | 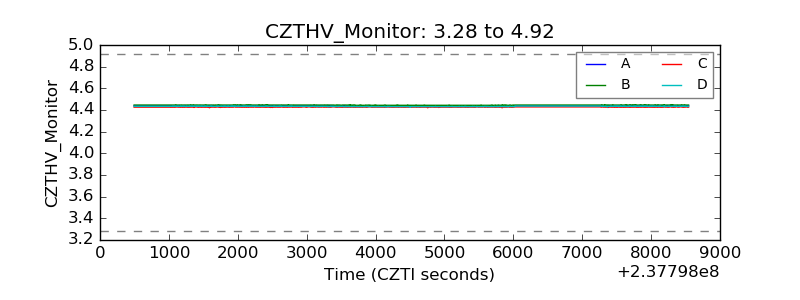 |
| D_VDD | 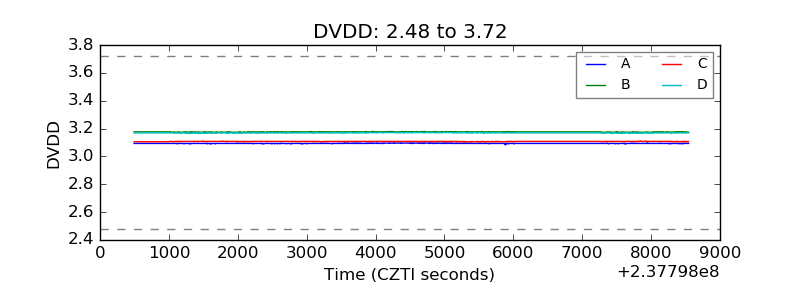 |
| Temperature 1 | 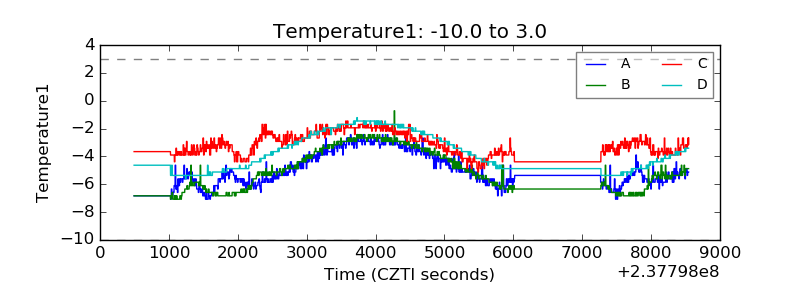 |
| Veto HV Monitor | 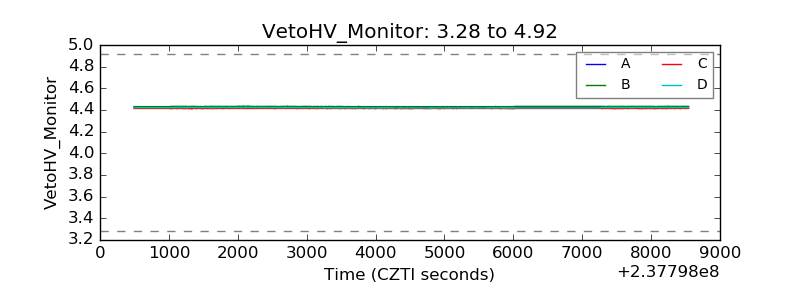 |
| Veto LLD |  |
| Alpha Counter | 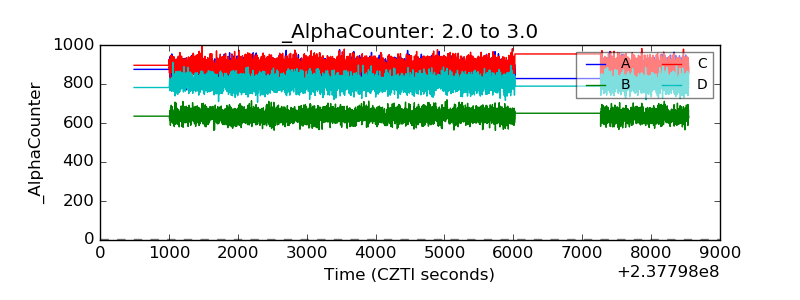 |
| _CPM_Rate | 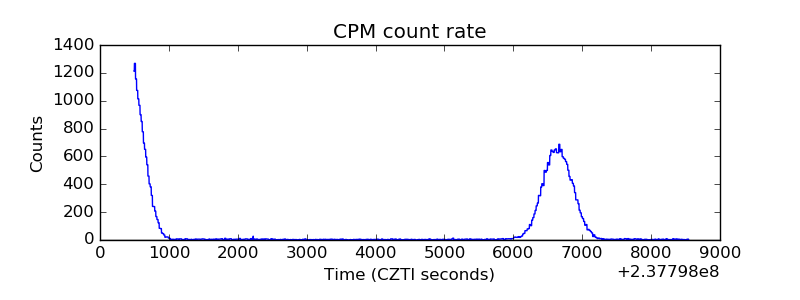 |
| CZT Counter | 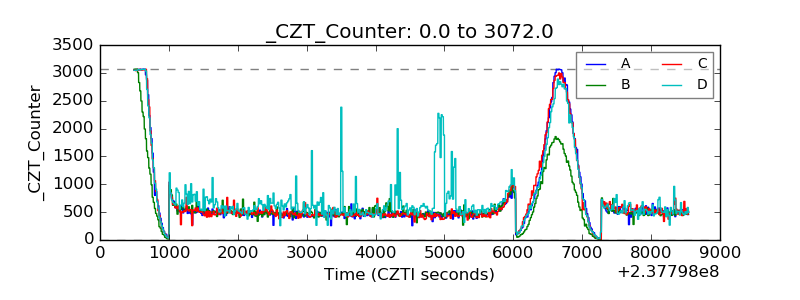 |
| +2.5 Volts monitor |  |
| +5 Volts monitor | 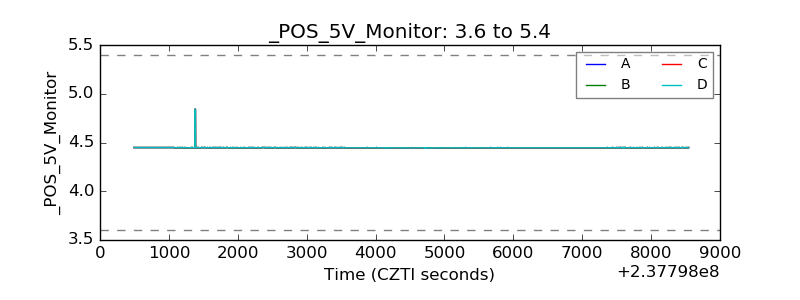 |
| _ROLL_ROT | 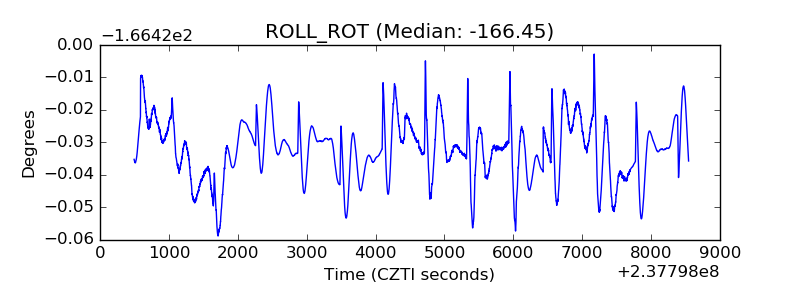 |
| _Roll_DEC | 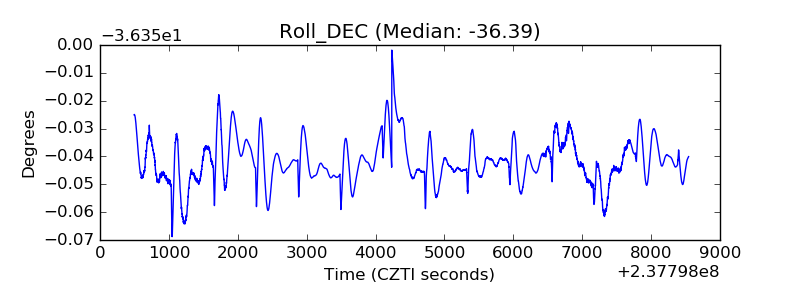 |
| _Roll_RA | 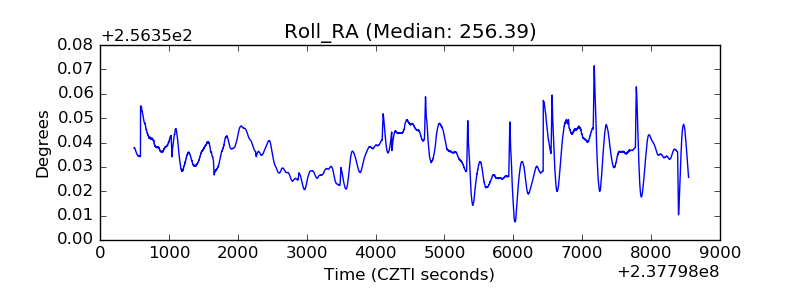 |
| Veto Counter | 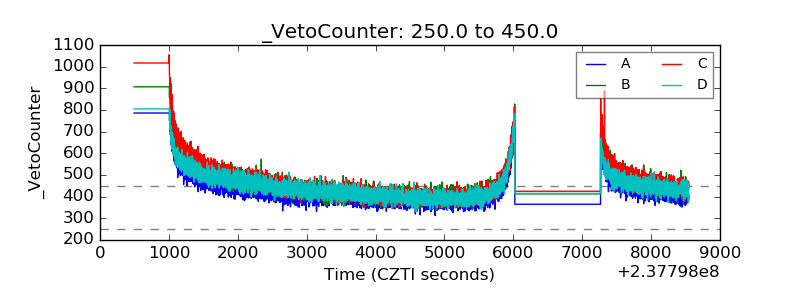 |