| Param | Original file | Final file |
|---|---|---|
| Filename | modeM0/AS1A03_029T01_9000001384_09715cztM0_level2.evt | modeM0/AS1A03_029T01_9000001384_09715cztM0_level2_quad_clean.evt |
| Size (bytes) | 516,764,160 | 94,924,800 |
| Size | 492.8 MB | 90.5 MB |
| Events in quadrant A | 3,592,393 | 591,038 |
| Events in quadrant B | 3,681,082 | 599,284 |
| Events in quadrant C | 3,725,080 | 590,325 |
| Events in quadrant D | 4,139,679 | 569,862 |
| Mode M0 | |||
|---|---|---|---|
| Quadrant | BADHDUFLAG | Total packets | Discarded packets |
| A | 0 | 15733 | 80 |
| B | 0 | 15837 | 109 |
| C | 0 | 16242 | 106 |
| D | 0 | 17422 | 128 |
| Mode M9 | |||
|---|---|---|---|
| Quadrant | BADHDUFLAG | Total packets | Discarded packets |
| A | 0 | 14 | 0 |
| B | 0 | 14 | 1 |
| C | 0 | 14 | 1 |
| D | 0 | 14 | 0 |
| Mode SS | |||
|---|---|---|---|
| Quadrant | BADHDUFLAG | Total packets | Discarded packets |
| A | 0 | 158 | 2 |
| B | 0 | 158 | 0 |
| C | 0 | 158 | 2 |
| D | 0 | 158 | 2 |
| Quadrant | Total seconds | Saturated seconds | Saturation percentage |
|---|---|---|---|
| A | 7538 | 246 | 3.263465% |
| B | 7523 | 259 | 3.442775% |
| C | 7525 | 226 | 3.003322% |
| D | 7526 | 243 | 3.228807% |
Noise dominated data is calculated using 1-second bins in cleaned event files. If a bin has >2000 counts, and if more than 50% of those come from <1% of pixels, then it is considered to be noise-dominated and hence unusable.
| Quadrant | # 1 sec bins | Bins with >0 counts | Bins with >2000 counts | High rate bins dominated by noise | Noise dominated (total time) | Noise dominated (detector-on time) | Marked lightcurve |
|---|---|---|---|---|---|---|---|
| A | 9105 | 7571 | 0 | 0 | 0.00% | 0.00% | 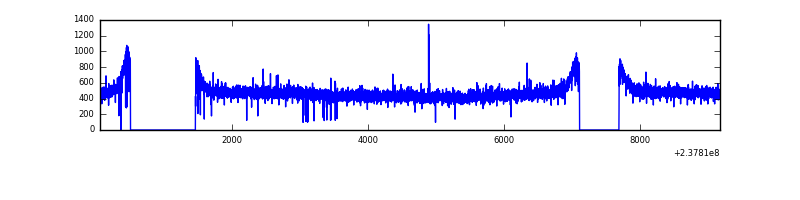 |
| B | 9105 | 7571 | 0 | 0 | 0.00% | 0.00% | 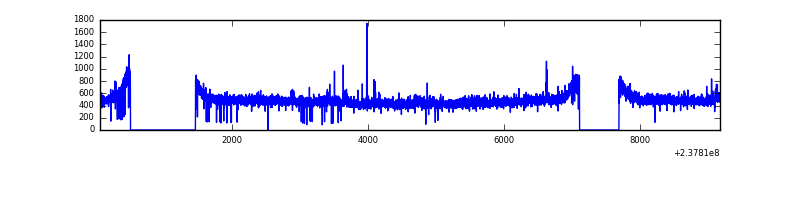 |
| C | 9105 | 7569 | 0 | 0 | 0.00% | 0.00% | 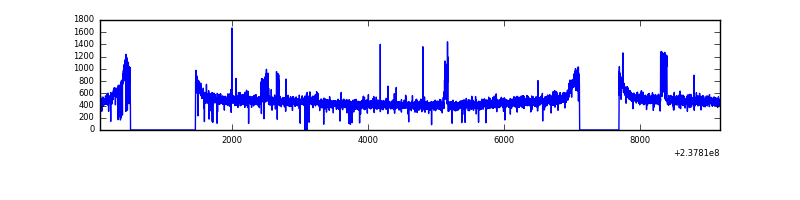 |
| D | 9105 | 7564 | 9 | 9 | 0.10% | 0.12% | 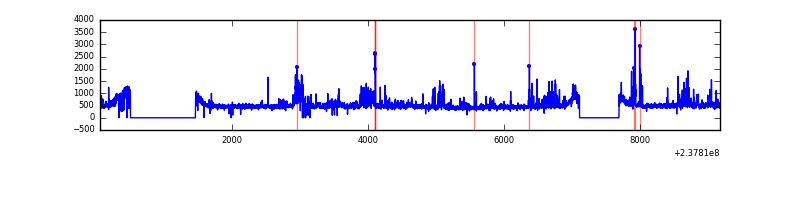 |
Top three noisy pixels from each quadrant. If the there are fewer than three noisy pixels in the level2.evt file, extra rows are filled as -1
| Pixel properties | Quadrant properties | ||||||
|---|---|---|---|---|---|---|---|
| Quadrant | DetID | PixID | Counts | Sigma | Mean | Median | Sigma |
| A | 0 | 226 | 8560 | 40.03 | 932 | 910 | 191.1 |
| A | 4 | 2 | 8184 | 38.06 | 932 | 910 | 191.1 |
| A | 12 | 194 | 7689 | 35.47 | 932 | 910 | 191.1 |
| B | 0 | 214 | 25042 | 135.05 | 932 | 910 | 178.7 |
| B | 12 | 111 | 19951 | 106.56 | 932 | 910 | 178.7 |
| B | 11 | 111 | 16267 | 85.94 | 932 | 910 | 178.7 |
| C | 9 | 68 | 150688 | 711.39 | 910 | 913 | 210.5 |
| C | 14 | 234 | 22382 | 101.97 | 910 | 913 | 210.5 |
| C | 13 | 61 | 6859 | 28.24 | 910 | 913 | 210.5 |
| D | 1 | 52 | 516106 | 2363.28 | 903 | 882 | 218.0 |
| D | 12 | 233 | 143637 | 654.8 | 903 | 882 | 218.0 |
| D | 2 | 234 | 22896 | 100.98 | 903 | 882 | 218.0 |
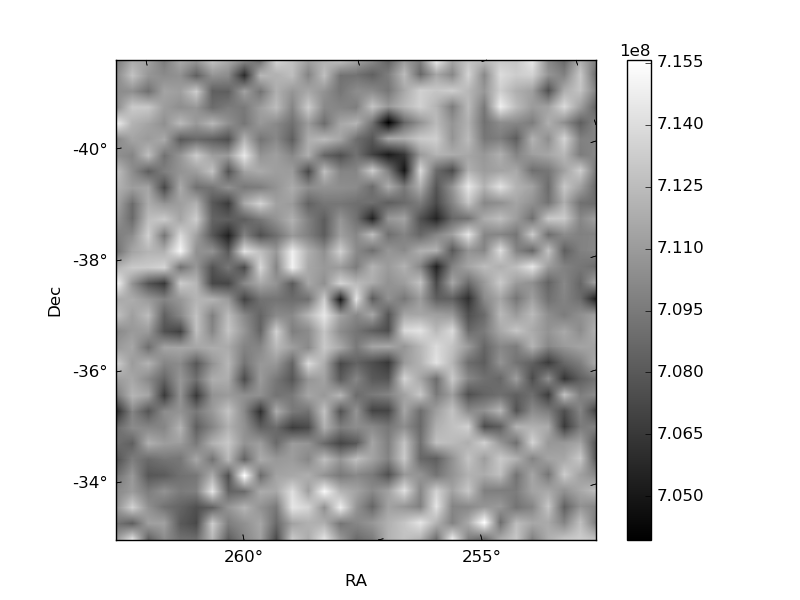
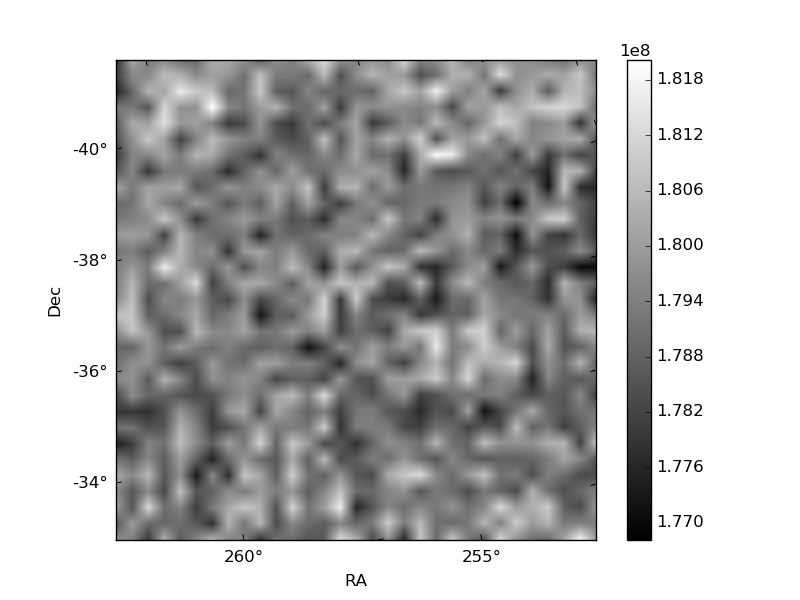
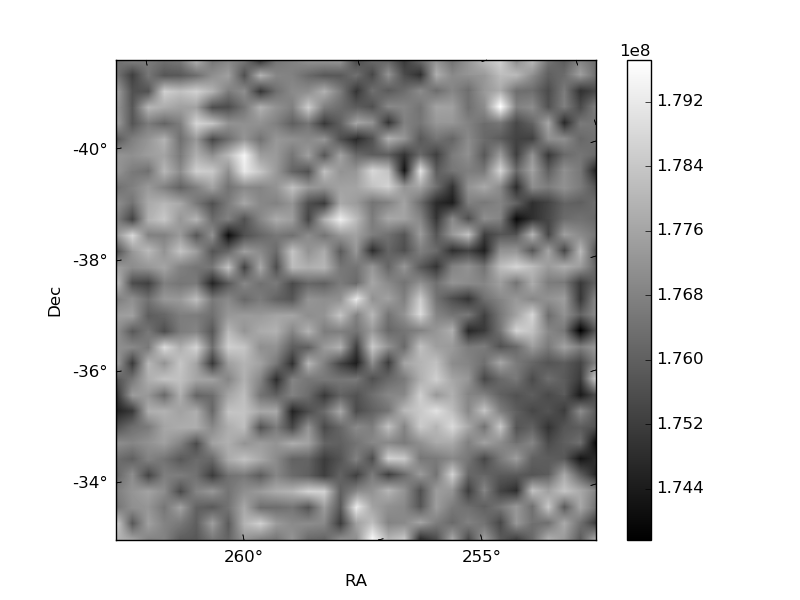
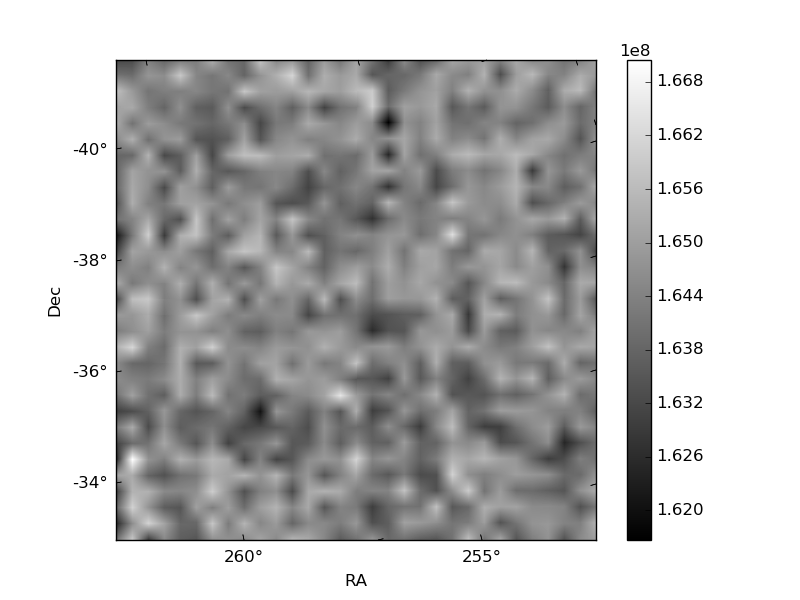
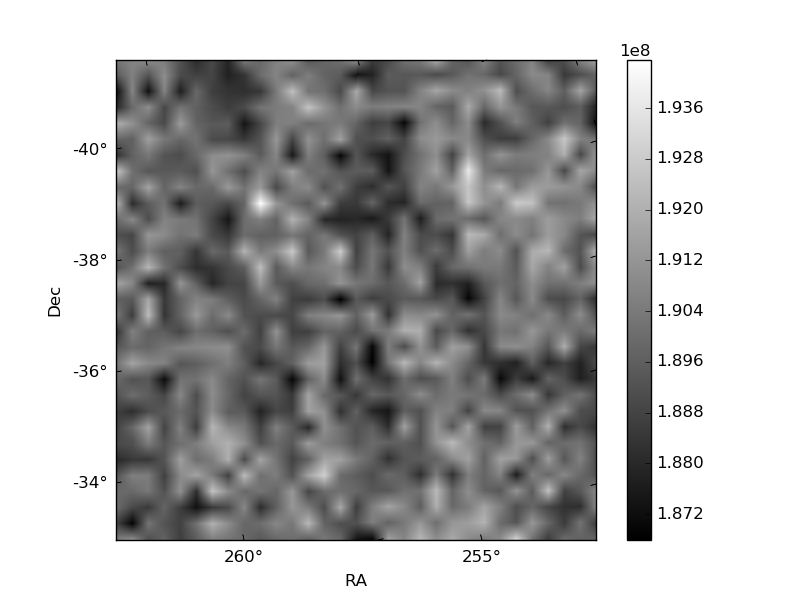
Histogram calculated using DETX and DETY for each event in the final _common_clean file
| Quadrant A | 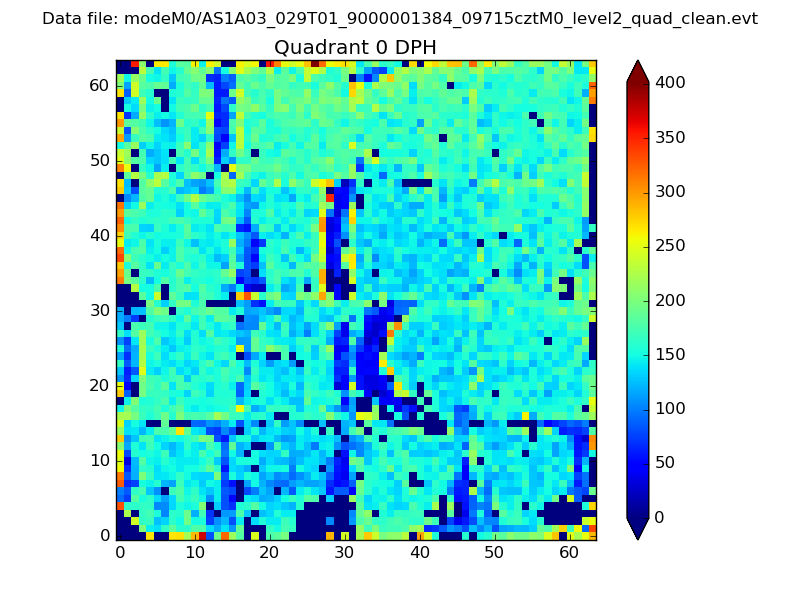 |
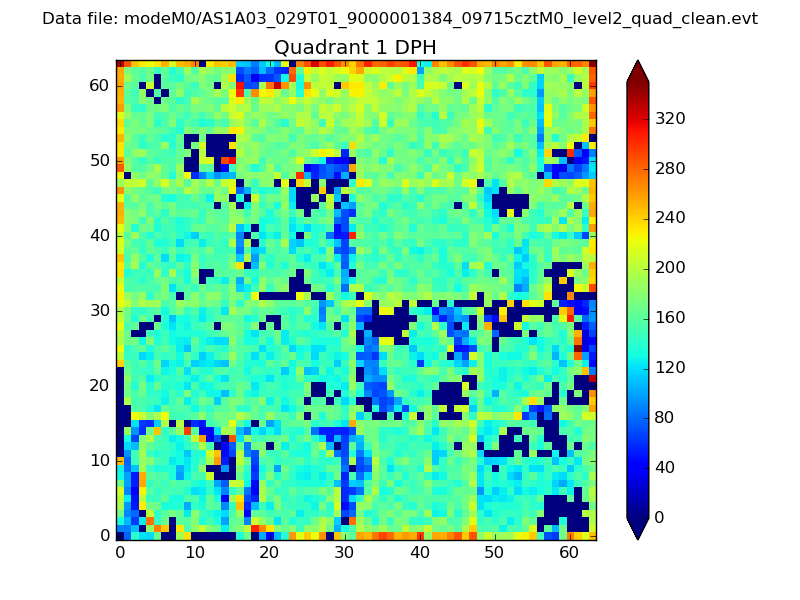 |
Quadrant B |
|---|---|---|---|
| Quadrant D | 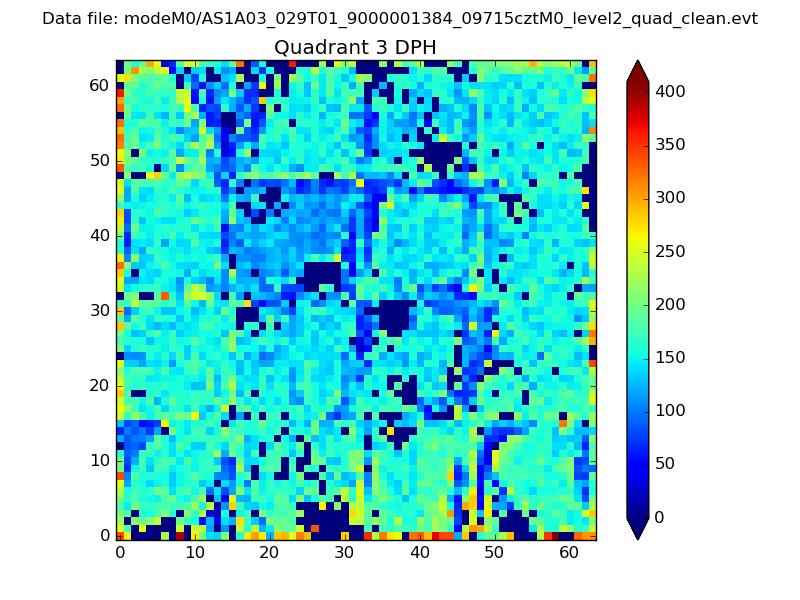 |
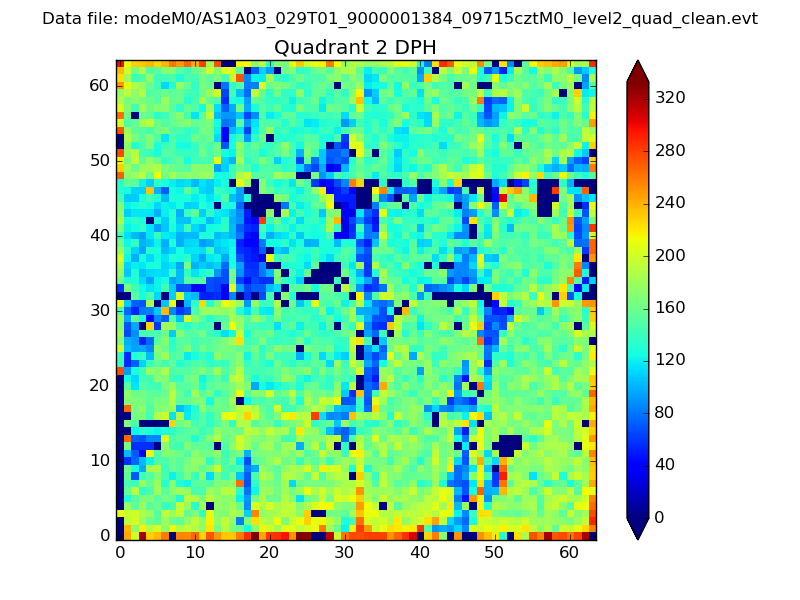 |
Quadrant C |
| Plot type | Count rate plots | Images |
|---|---|---|
| Comparison with Poisson distribution Blue bars denote a histogram of data divided into 1 sec bins. Red curve is a Poisson curve with rate = median count rate of data. |
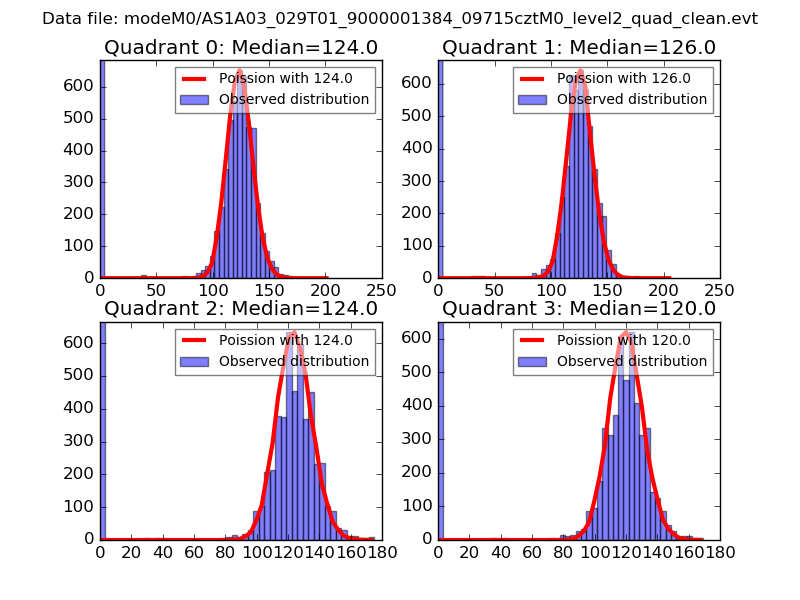 |
 |
| Quadrant-wise count rates Data is divided into 100 sec bins |
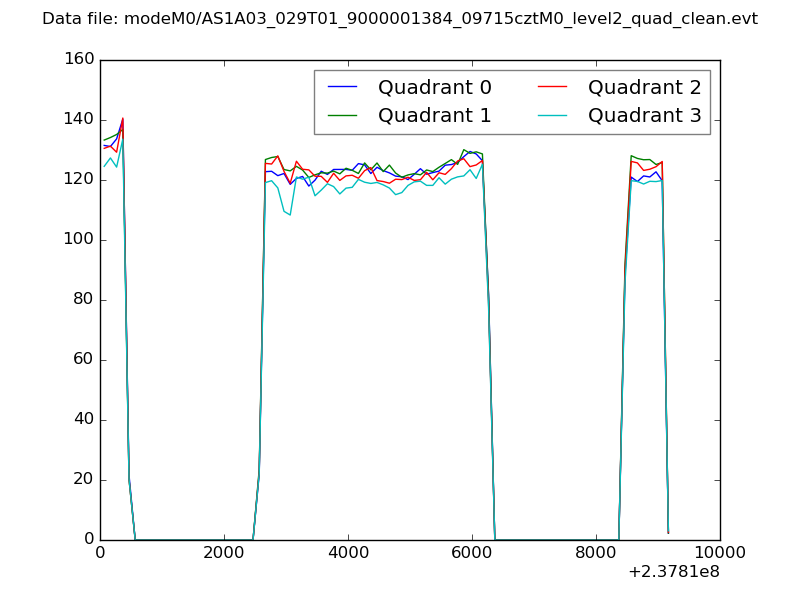 |
|
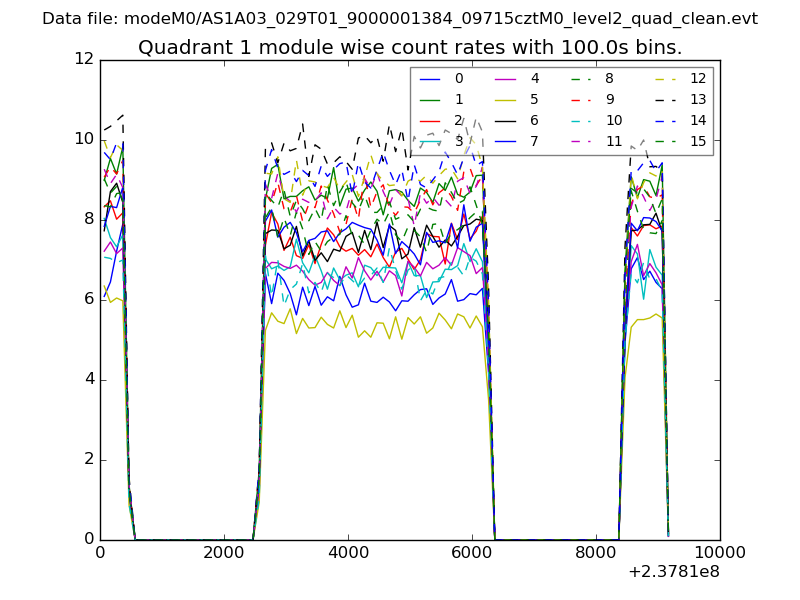
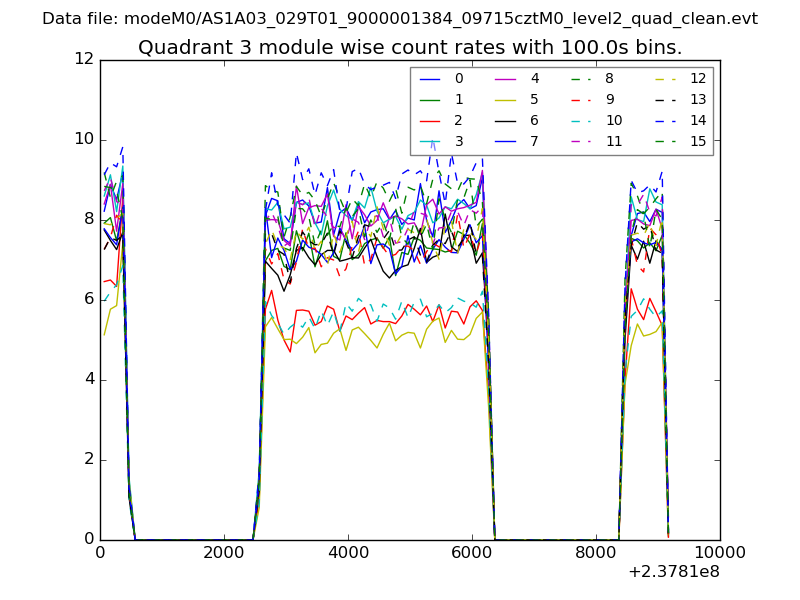
| Module-wise count rates for Quadrant A Data is divided into 100 sec bins |
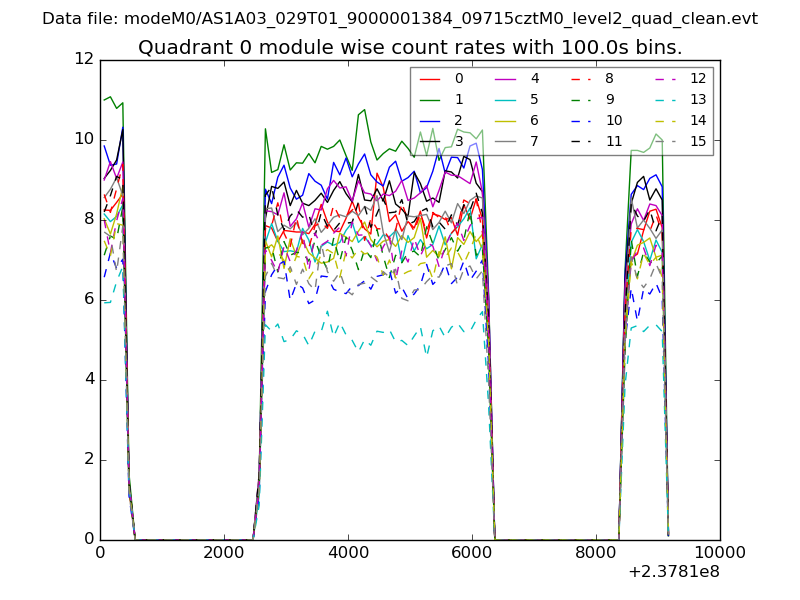 |
 |
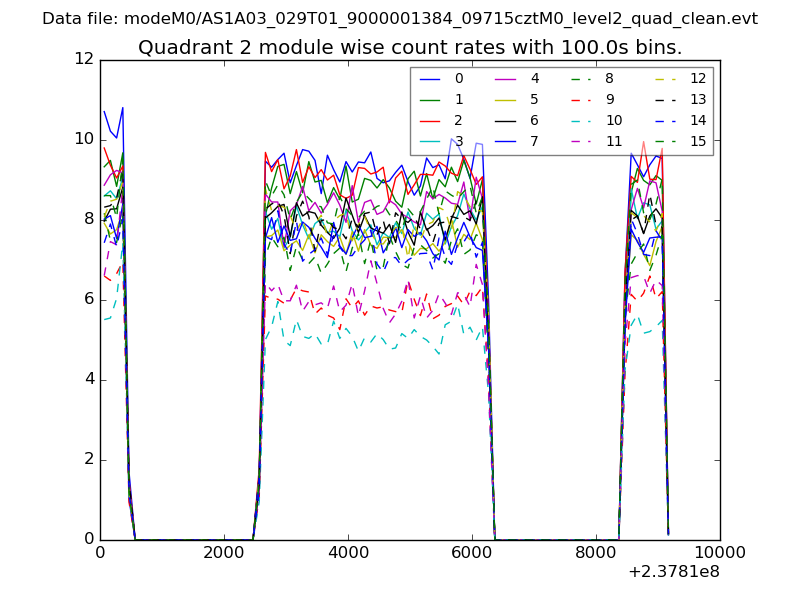
| Module-wise count rates for Quadrant B Data is divided into 100 sec bins |
 |
 |
| Module-wise count rates for Quadrant C Data is divided into 100 sec bins |
 |
 |
| Module-wise count rates for Quadrant D Data is divided into 100 sec bins |
 |
 |
| Parameter | Plot |
|---|---|
| CZT HV Monitor | 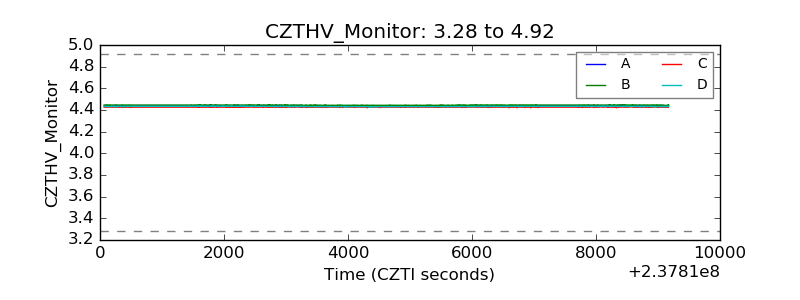 |
| D_VDD | 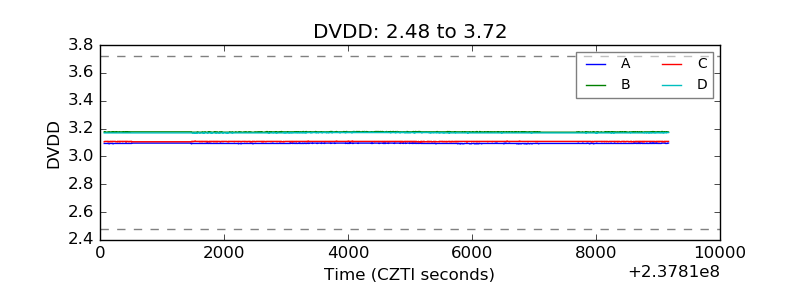 |
| Temperature 1 |  |
| Veto HV Monitor | 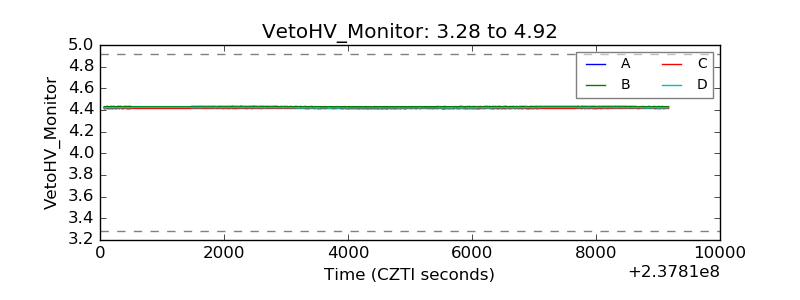 |
| Veto LLD | 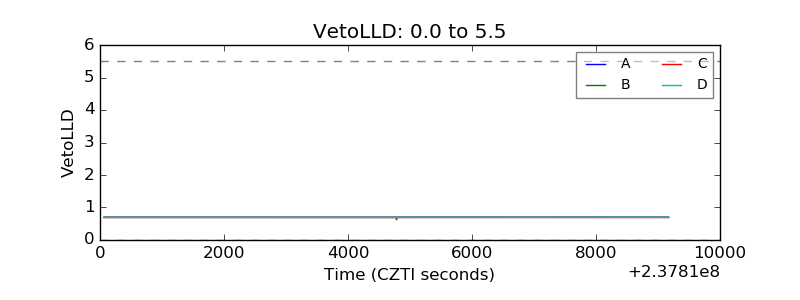 |
| Alpha Counter | 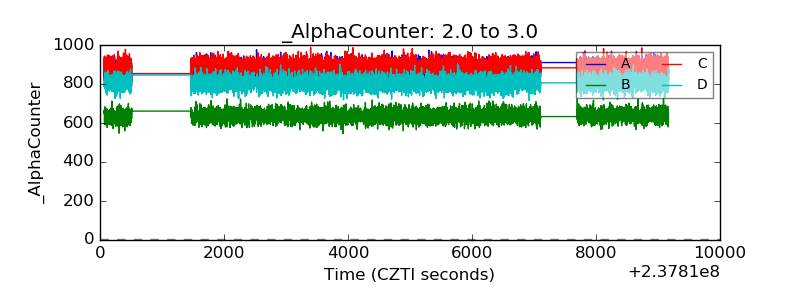 |
| _CPM_Rate | 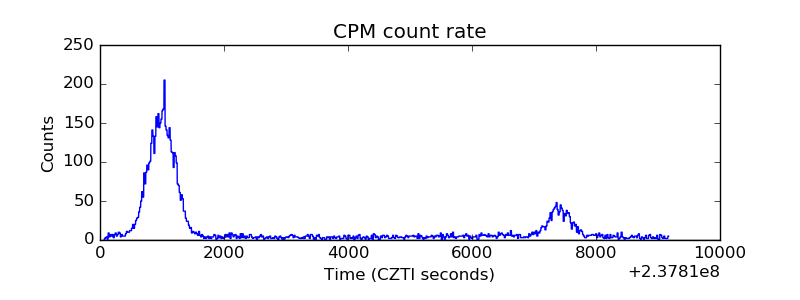 |
| CZT Counter | 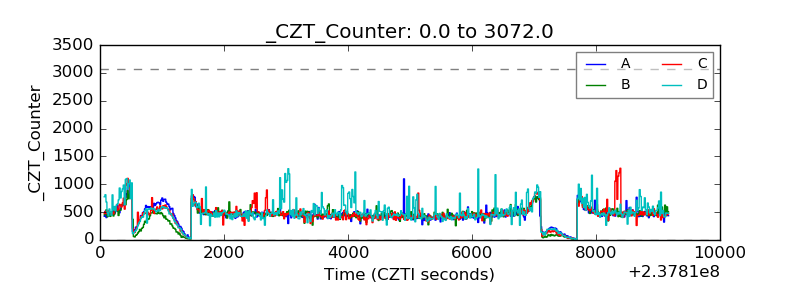 |
| +2.5 Volts monitor |  |
| +5 Volts monitor |  |
| _ROLL_ROT |  |
| _Roll_DEC | 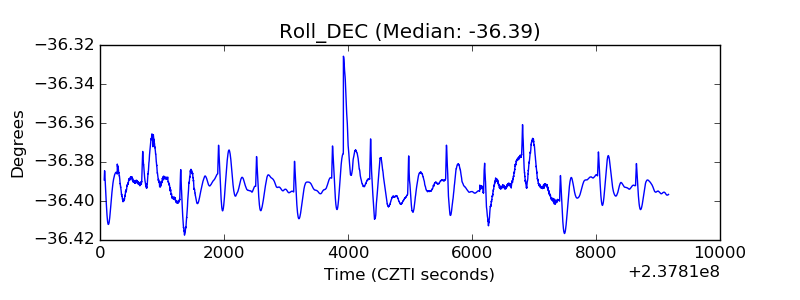 |
| _Roll_RA | 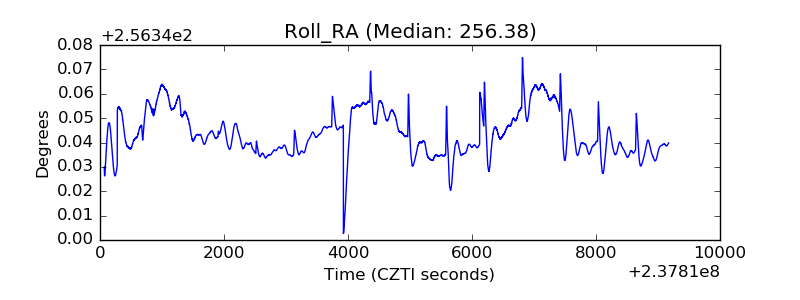 |
| Veto Counter | 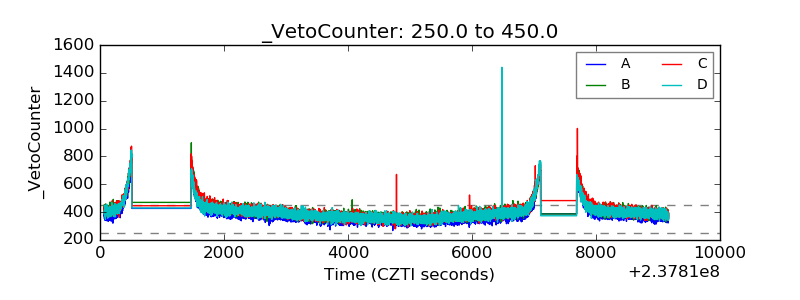 |