| Param | Original file | Final file |
|---|---|---|
| Filename | modeM0/AS1A03_029T01_9000001384_09716cztM0_level2.evt | modeM0/AS1A03_029T01_9000001384_09716cztM0_level2_quad_clean.evt |
| Size (bytes) | 464,040,000 | 92,131,200 |
| Size | 442.5 MB | 87.9 MB |
| Events in quadrant A | 3,126,404 | 586,460 |
| Events in quadrant B | 3,269,686 | 591,855 |
| Events in quadrant C | 3,158,115 | 586,529 |
| Events in quadrant D | 4,042,203 | 556,870 |
| Mode M0 | |||
|---|---|---|---|
| Quadrant | BADHDUFLAG | Total packets | Discarded packets |
| A | 0 | 13976 | 161 |
| B | 0 | 14199 | 192 |
| C | 0 | 14110 | 211 |
| D | 0 | 16767 | 332 |
| Mode M9 | |||
|---|---|---|---|
| Quadrant | BADHDUFLAG | Total packets | Discarded packets |
| A | 0 | 3 | 0 |
| B | 0 | 3 | 0 |
| C | 0 | 3 | 0 |
| D | 0 | 3 | 0 |
| Mode SS | |||
|---|---|---|---|
| Quadrant | BADHDUFLAG | Total packets | Discarded packets |
| A | 0 | 138 | 0 |
| B | 0 | 138 | 2 |
| C | 0 | 138 | 0 |
| D | 0 | 138 | 0 |
| Quadrant | Total seconds | Saturated seconds | Saturation percentage |
|---|---|---|---|
| A | 6730 | 108 | 1.604755% |
| B | 6721 | 109 | 1.621782% |
| C | 6707 | 56 | 0.834949% |
| D | 6707 | 270 | 4.025645% |
Noise dominated data is calculated using 1-second bins in cleaned event files. If a bin has >2000 counts, and if more than 50% of those come from <1% of pixels, then it is considered to be noise-dominated and hence unusable.
| Quadrant | # 1 sec bins | Bins with >0 counts | Bins with >2000 counts | High rate bins dominated by noise | Noise dominated (total time) | Noise dominated (detector-on time) | Marked lightcurve |
|---|---|---|---|---|---|---|---|
| A | 7128 | 6795 | 2 | 2 | 0.03% | 0.03% | 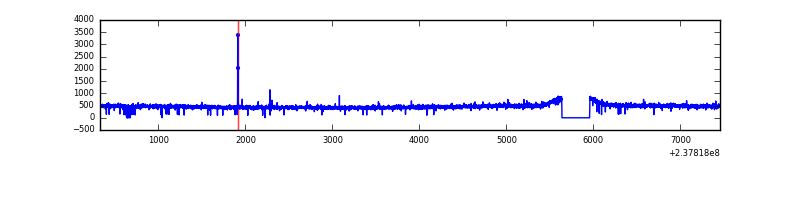 |
| B | 7128 | 6798 | 5 | 5 | 0.07% | 0.07% | 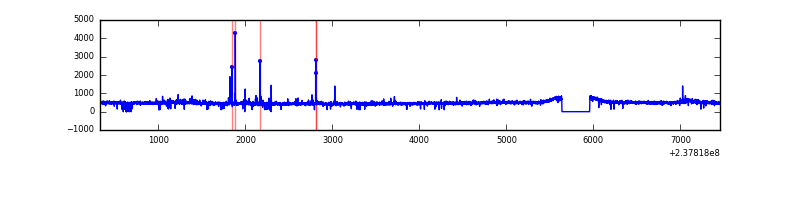 |
| C | 7128 | 6792 | 2 | 2 | 0.03% | 0.03% | 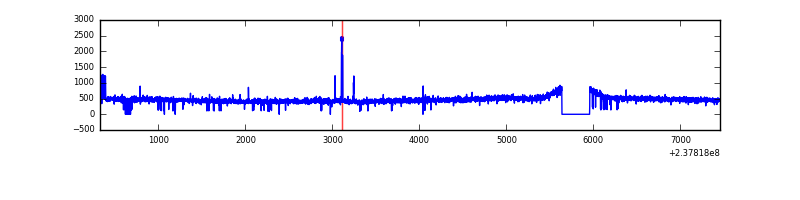 |
| D | 7128 | 6791 | 164 | 164 | 2.30% | 2.41% | 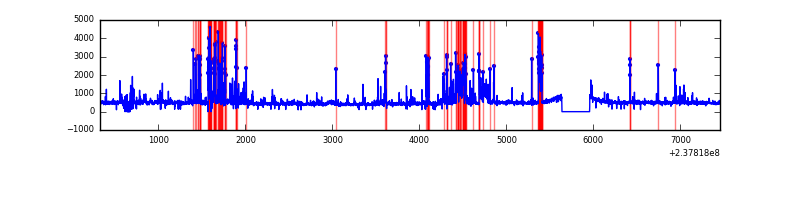 |
Top three noisy pixels from each quadrant. If the there are fewer than three noisy pixels in the level2.evt file, extra rows are filled as -1
| Pixel properties | Quadrant properties | ||||||
|---|---|---|---|---|---|---|---|
| Quadrant | DetID | PixID | Counts | Sigma | Mean | Median | Sigma |
| A | 15 | 174 | 12076 | 68.87 | 807 | 789 | 163.9 |
| A | 0 | 226 | 7572 | 41.39 | 807 | 789 | 163.9 |
| A | 12 | 194 | 6726 | 36.22 | 807 | 789 | 163.9 |
| B | 0 | 214 | 44943 | 285.95 | 808 | 787 | 154.4 |
| B | 0 | 246 | 24595 | 154.18 | 808 | 787 | 154.4 |
| B | 0 | 229 | 17046 | 105.29 | 808 | 787 | 154.4 |
| C | 9 | 68 | 81984 | 447.5 | 781 | 789 | 181.4 |
| C | 14 | 234 | 18970 | 100.2 | 781 | 789 | 181.4 |
| C | 13 | 61 | 5898 | 28.16 | 781 | 789 | 181.4 |
| D | 1 | 52 | 961331 | 5101.29 | 769 | 752 | 188.3 |
| D | 12 | 233 | 105523 | 556.4 | 769 | 752 | 188.3 |
| D | 2 | 234 | 25482 | 131.33 | 769 | 752 | 188.3 |
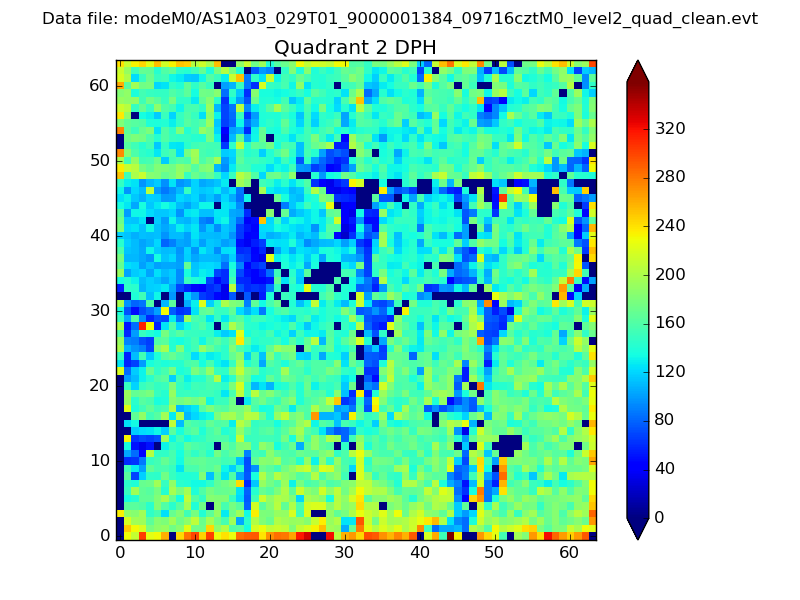
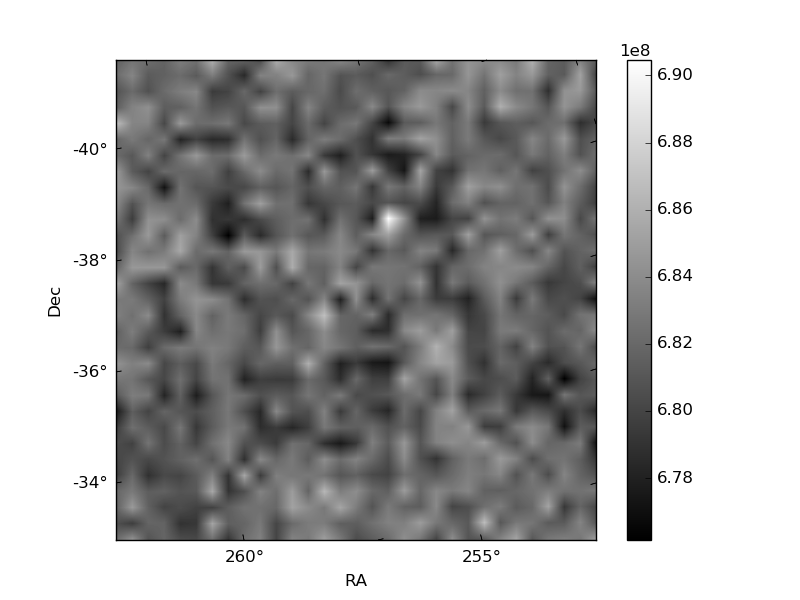
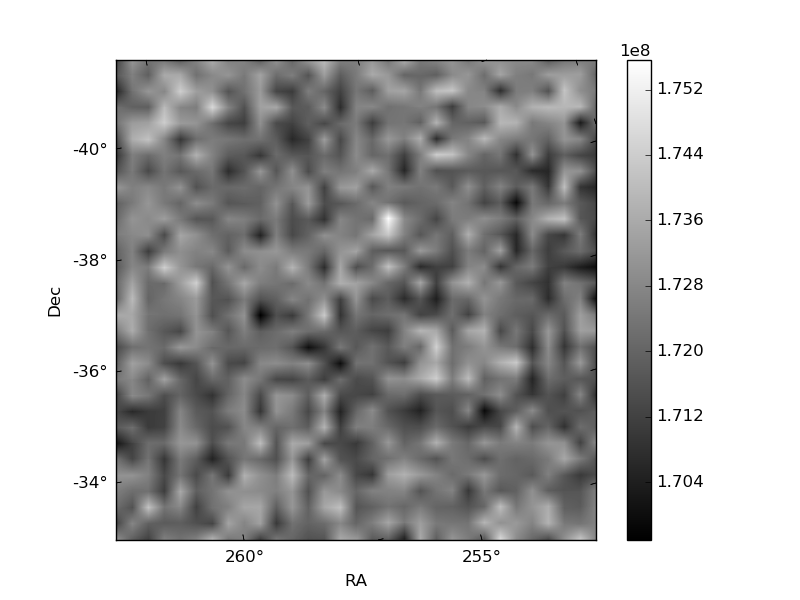
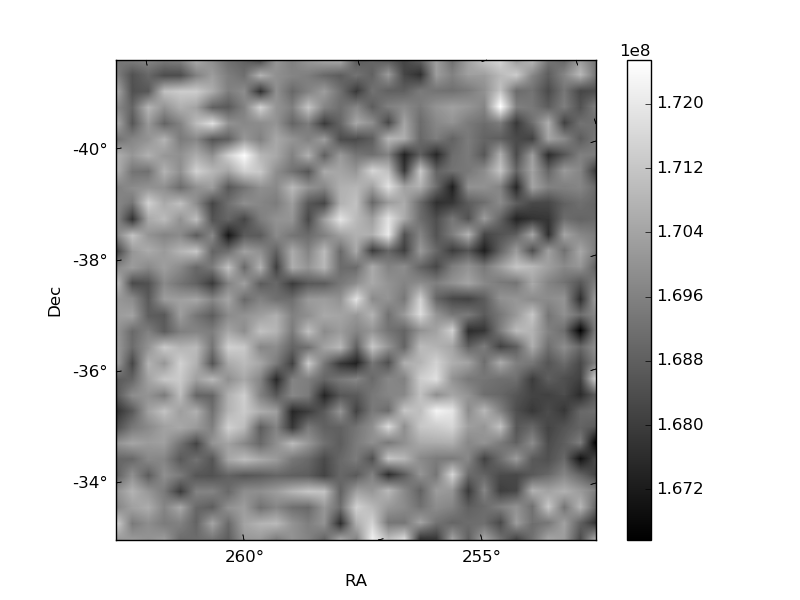
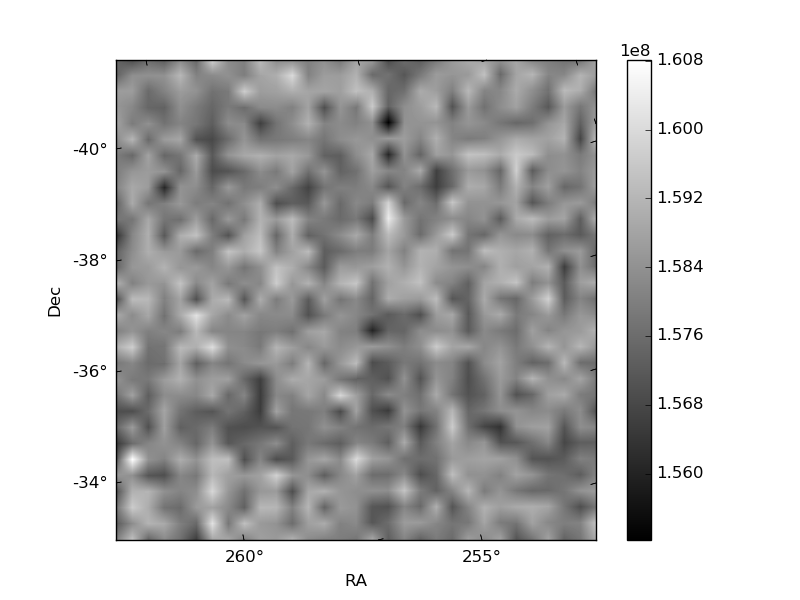
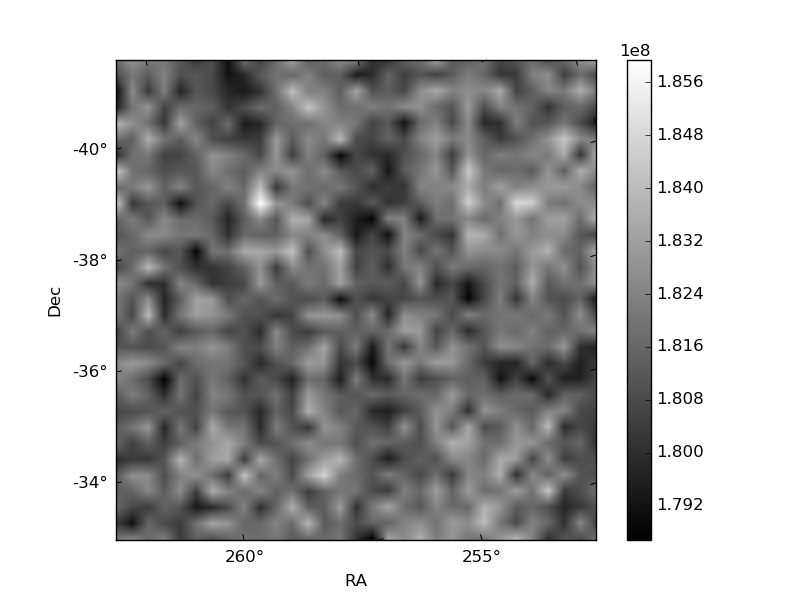
Histogram calculated using DETX and DETY for each event in the final _common_clean file
| Quadrant A | 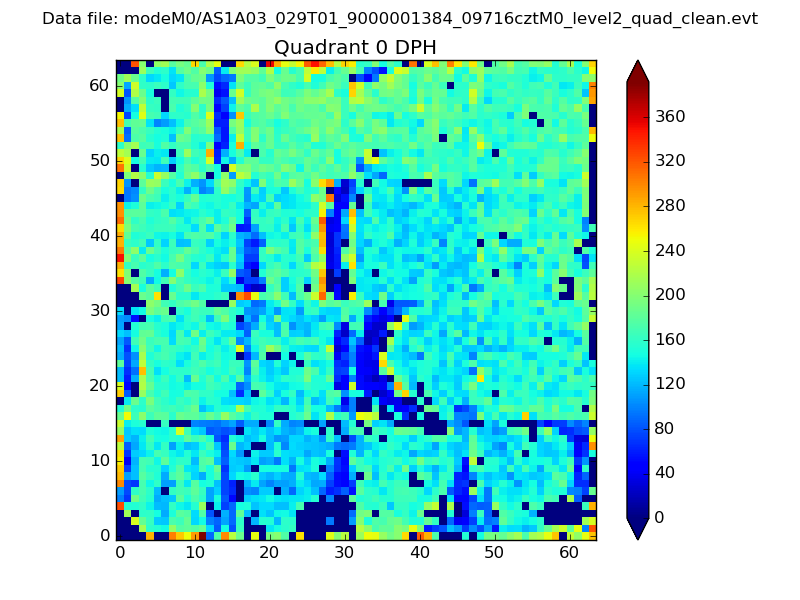 |
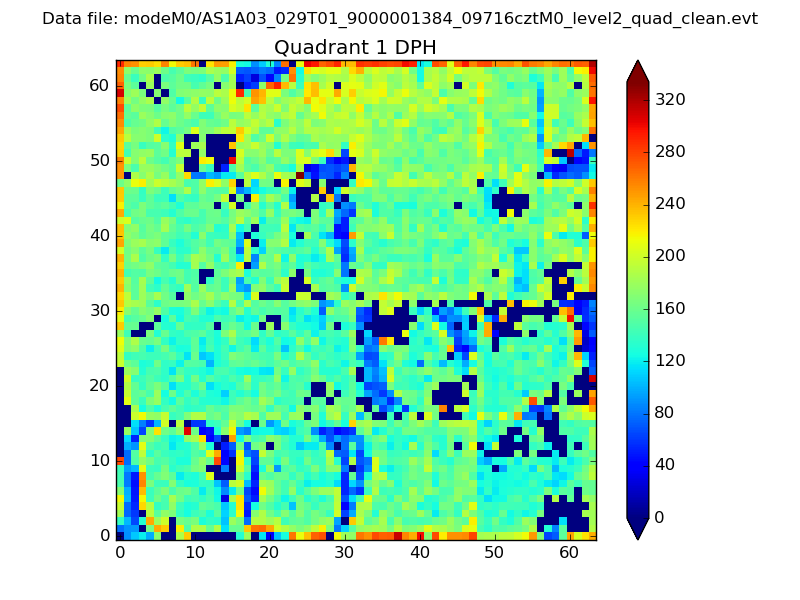 |
Quadrant B |
|---|---|---|---|
| Quadrant D | 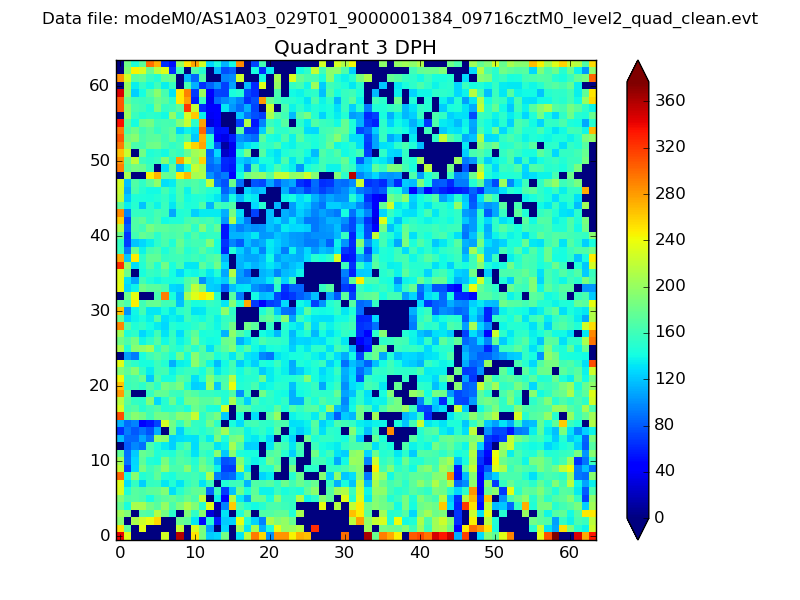 |
 |
Quadrant C |
| Plot type | Count rate plots | Images |
|---|---|---|
| Comparison with Poisson distribution Blue bars denote a histogram of data divided into 1 sec bins. Red curve is a Poisson curve with rate = median count rate of data. |
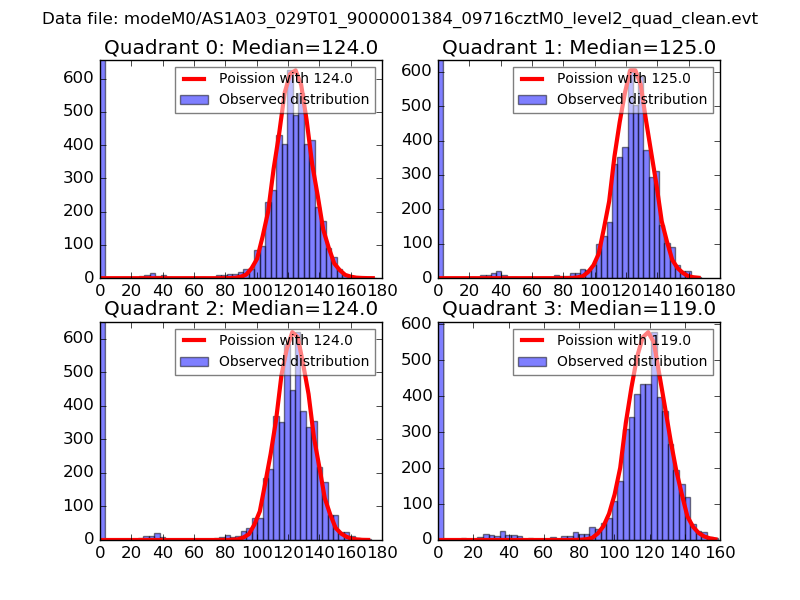 |
 |
| Quadrant-wise count rates Data is divided into 100 sec bins |
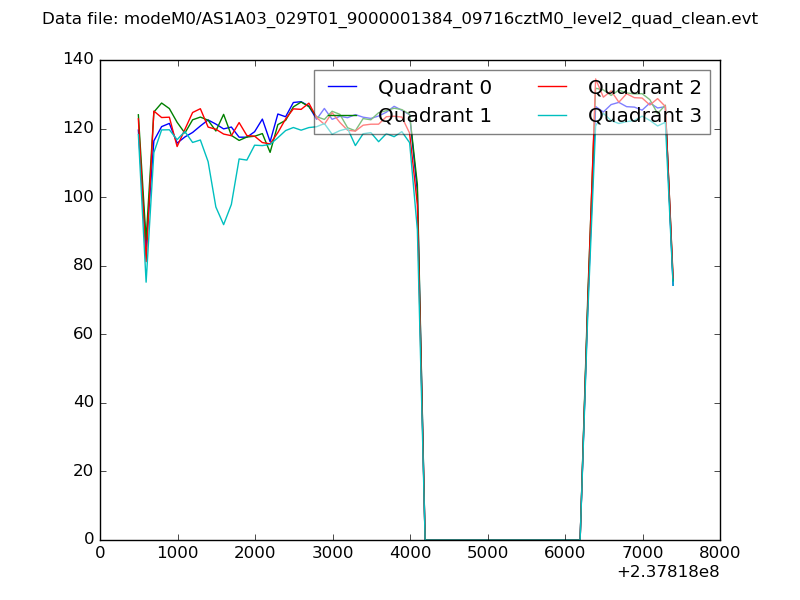 |
|
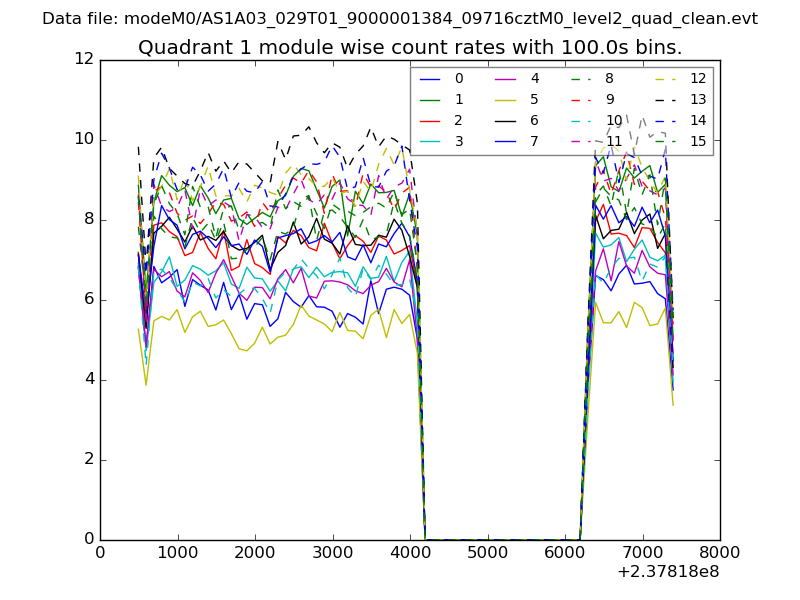
| Module-wise count rates for Quadrant A Data is divided into 100 sec bins |
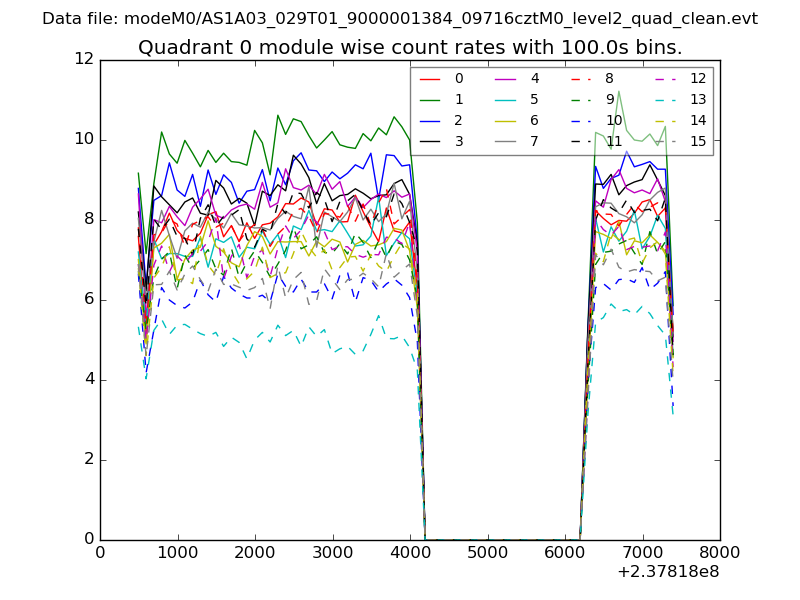 |
 |
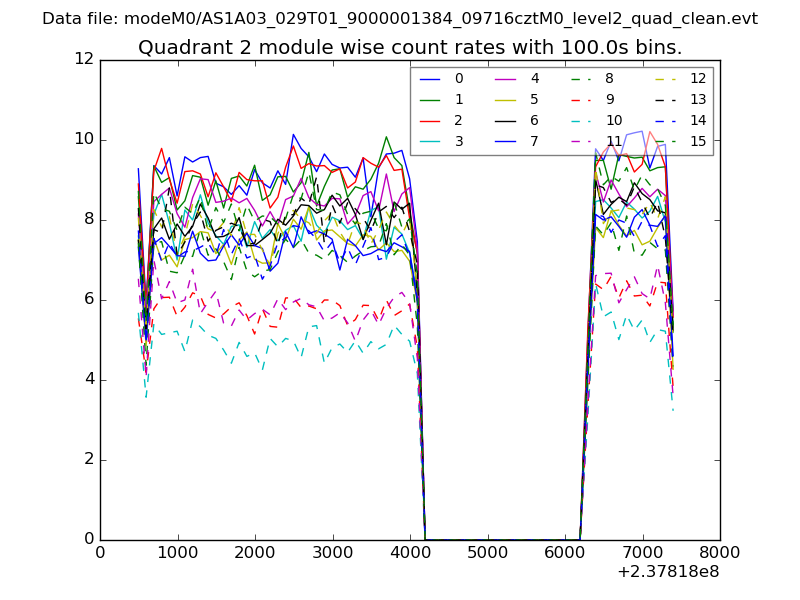
| Module-wise count rates for Quadrant B Data is divided into 100 sec bins |
 |
 |
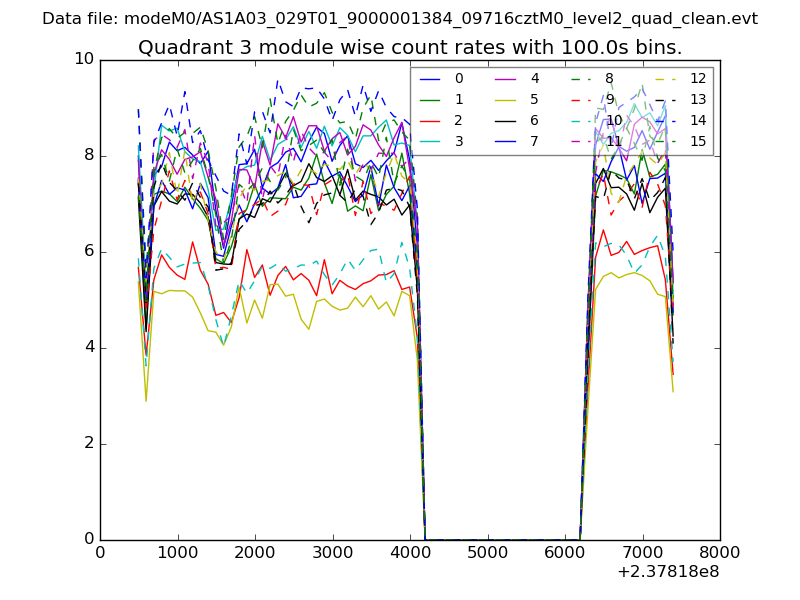
| Module-wise count rates for Quadrant C Data is divided into 100 sec bins |
 |
 |
| Module-wise count rates for Quadrant D Data is divided into 100 sec bins |
 |
 |
| Parameter | Plot |
|---|---|
| CZT HV Monitor | 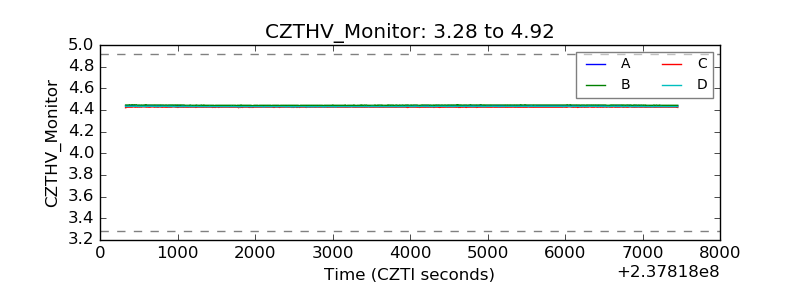 |
| D_VDD | 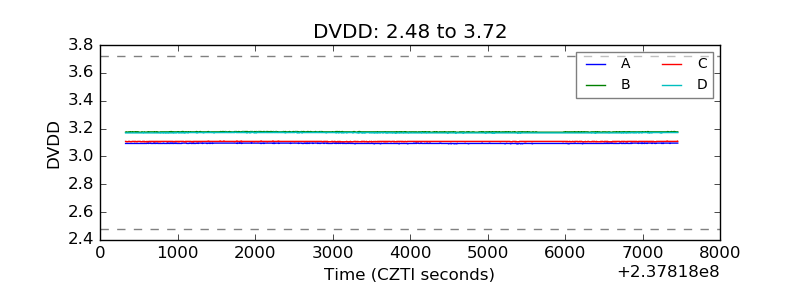 |
| Temperature 1 | 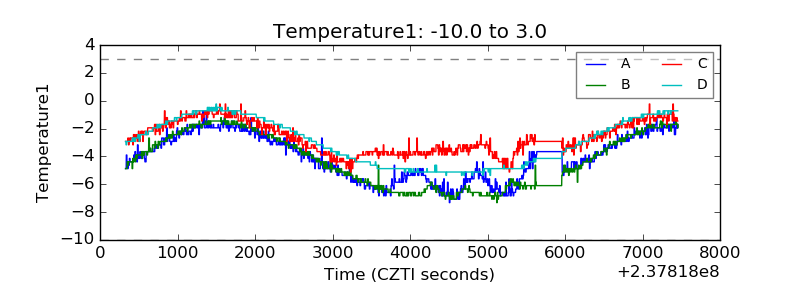 |
| Veto HV Monitor | 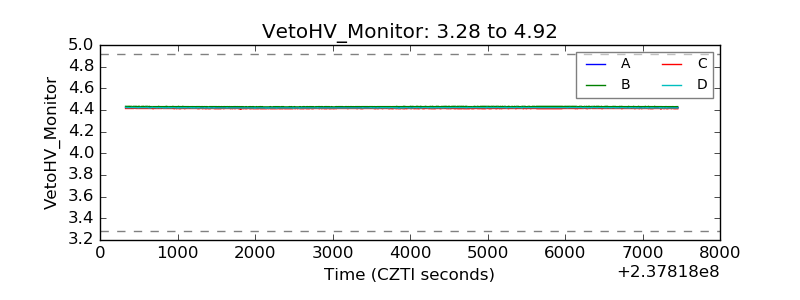 |
| Veto LLD | 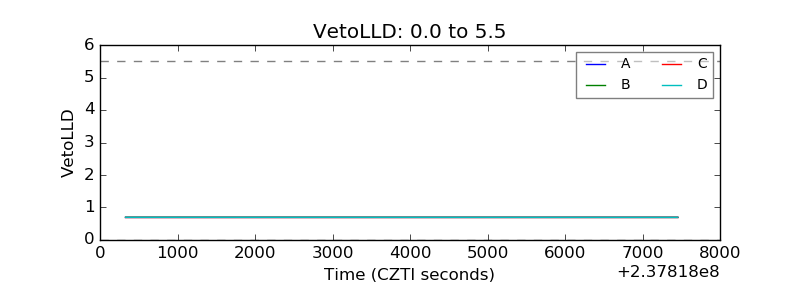 |
| Alpha Counter | 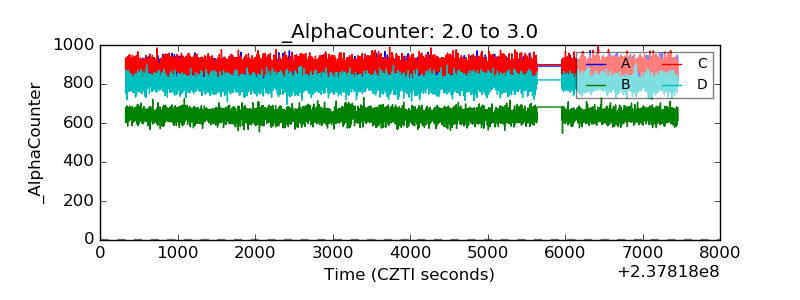 |
| _CPM_Rate | 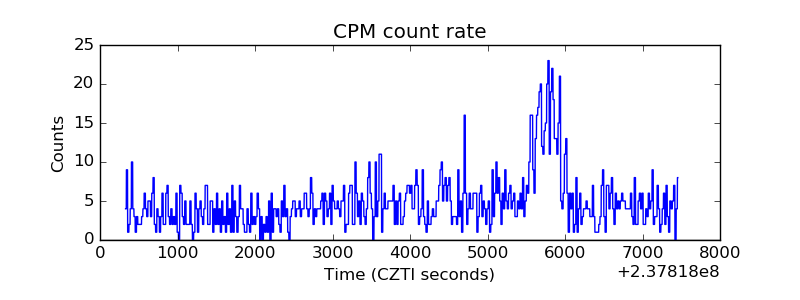 |
| CZT Counter | 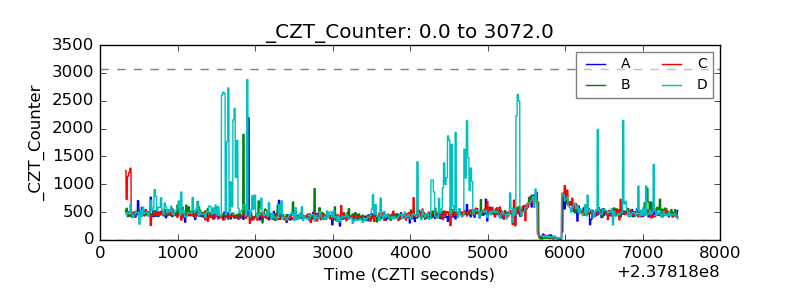 |
| +2.5 Volts monitor |  |
| +5 Volts monitor |  |
| _ROLL_ROT | 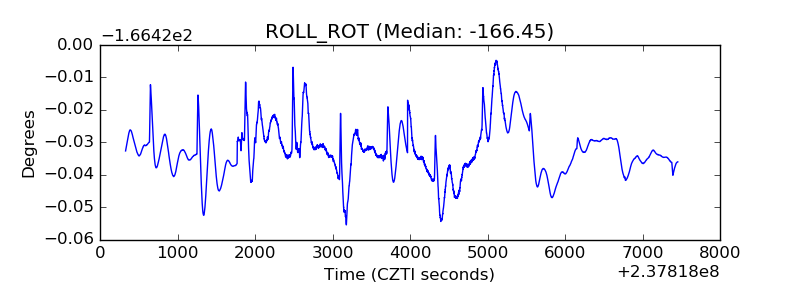 |
| _Roll_DEC | 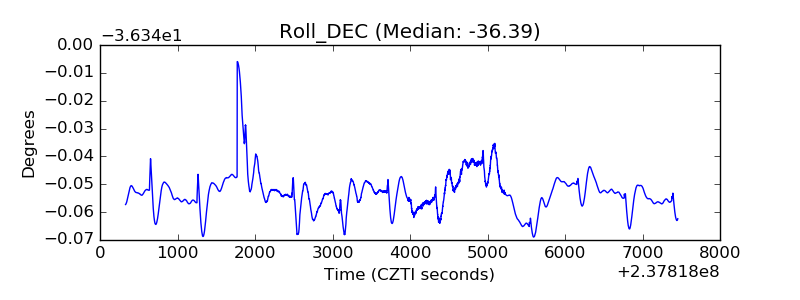 |
| _Roll_RA | 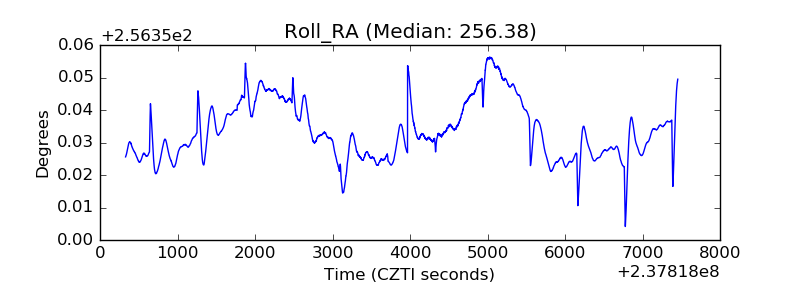 |
| Veto Counter | 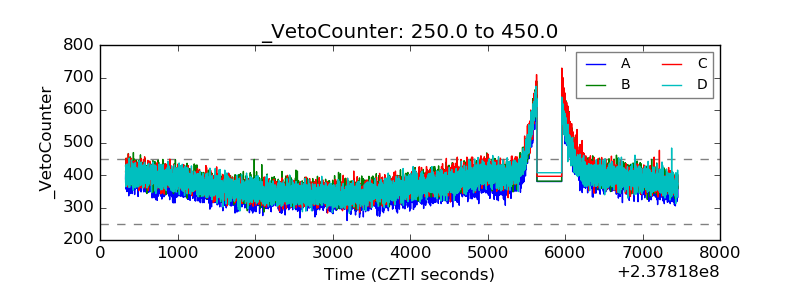 |