| Param | Original file | Final file |
|---|---|---|
| Filename | modeM0/AS1A03_029T01_9000001384_09720cztM0_level2.evt | modeM0/AS1A03_029T01_9000001384_09720cztM0_level2_quad_clean.evt |
| Size (bytes) | 1,180,255,680 | 218,638,080 |
| Size | 1.1 GB | 208.5 MB |
| Events in quadrant A | 8,106,733 | 1,367,027 |
| Events in quadrant B | 8,437,870 | 1,376,983 |
| Events in quadrant C | 8,533,962 | 1,355,518 |
| Events in quadrant D | 9,467,838 | 1,302,338 |
| Mode M0 | |||
|---|---|---|---|
| Quadrant | BADHDUFLAG | Total packets | Discarded packets |
| A | 0 | 37398 | 1220 |
| B | 0 | 38069 | 1317 |
| C | 0 | 38878 | 1214 |
| D | 0 | 42079 | 1498 |
| Mode M9 | |||
|---|---|---|---|
| Quadrant | BADHDUFLAG | Total packets | Discarded packets |
| A | 0 | 20 | 0 |
| B | 0 | 20 | 0 |
| C | 0 | 20 | 1 |
| D | 0 | 20 | 1 |
| Mode SS | |||
|---|---|---|---|
| Quadrant | BADHDUFLAG | Total packets | Discarded packets |
| A | 0 | 371 | 11 |
| B | 0 | 372 | 16 |
| C | 0 | 371 | 9 |
| D | 0 | 371 | 17 |
| Quadrant | Total seconds | Saturated seconds | Saturation percentage |
|---|---|---|---|
| A | 17722 | 89 | 0.502201% |
| B | 17688 | 115 | 0.650158% |
| C | 17724 | 70 | 0.394945% |
| D | 17681 | 276 | 1.560998% |
Noise dominated data is calculated using 1-second bins in cleaned event files. If a bin has >2000 counts, and if more than 50% of those come from <1% of pixels, then it is considered to be noise-dominated and hence unusable.
| Quadrant | # 1 sec bins | Bins with >0 counts | Bins with >2000 counts | High rate bins dominated by noise | Noise dominated (total time) | Noise dominated (detector-on time) | Marked lightcurve |
|---|---|---|---|---|---|---|---|
| A | 20321 | 17939 | 4 | 4 | 0.02% | 0.02% | 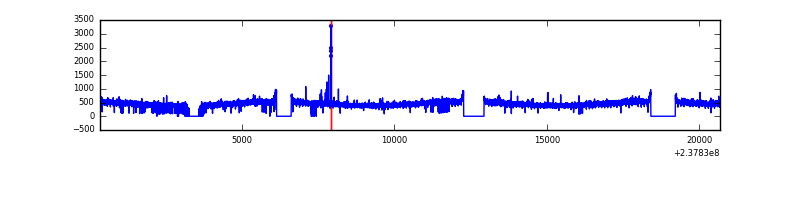 |
| B | 20321 | 17944 | 4 | 4 | 0.02% | 0.02% | 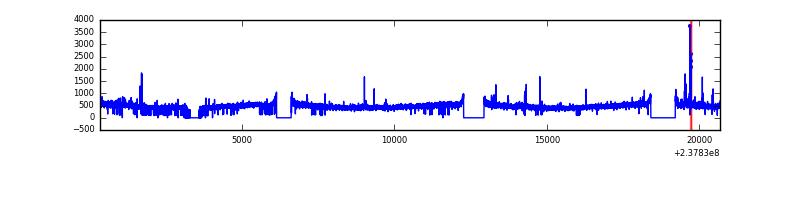 |
| C | 20321 | 17937 | 32 | 32 | 0.16% | 0.18% | 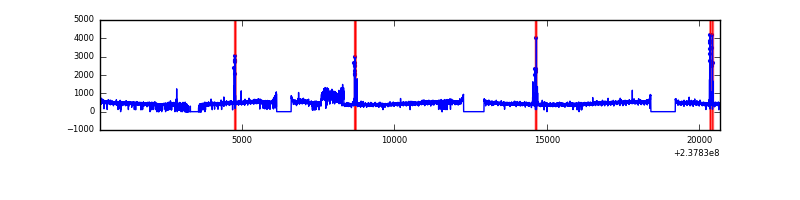 |
| D | 20321 | 17921 | 139 | 139 | 0.68% | 0.78% | 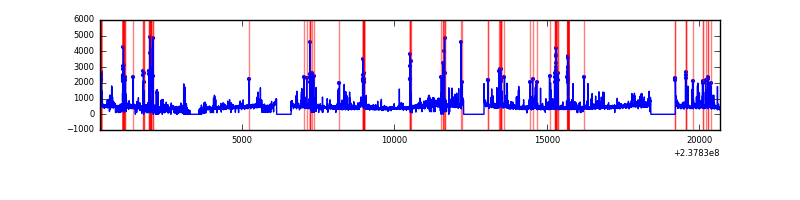 |
Top three noisy pixels from each quadrant. If the there are fewer than three noisy pixels in the level2.evt file, extra rows are filled as -1
| Pixel properties | Quadrant properties | ||||||
|---|---|---|---|---|---|---|---|
| Quadrant | DetID | PixID | Counts | Sigma | Mean | Median | Sigma |
| A | 15 | 174 | 39128 | 87.06 | 2087 | 2041 | 426.0 |
| A | 0 | 226 | 19499 | 40.98 | 2087 | 2041 | 426.0 |
| A | 1 | 162 | 18344 | 38.27 | 2087 | 2041 | 426.0 |
| B | 0 | 219 | 68098 | 165.38 | 2092 | 2043 | 399.4 |
| B | 0 | 214 | 63254 | 153.25 | 2092 | 2043 | 399.4 |
| B | 0 | 246 | 61074 | 147.79 | 2092 | 2043 | 399.4 |
| C | 9 | 68 | 454600 | 970.53 | 2012 | 2020 | 466.3 |
| C | 14 | 234 | 175877 | 372.83 | 2012 | 2020 | 466.3 |
| C | 8 | 128 | 19212 | 36.87 | 2012 | 2020 | 466.3 |
| D | 1 | 52 | 1427612 | 2827.21 | 1990 | 1936 | 504.3 |
| D | 12 | 233 | 149205 | 292.04 | 1990 | 1936 | 504.3 |
| D | 7 | 71 | 89459 | 173.56 | 1990 | 1936 | 504.3 |
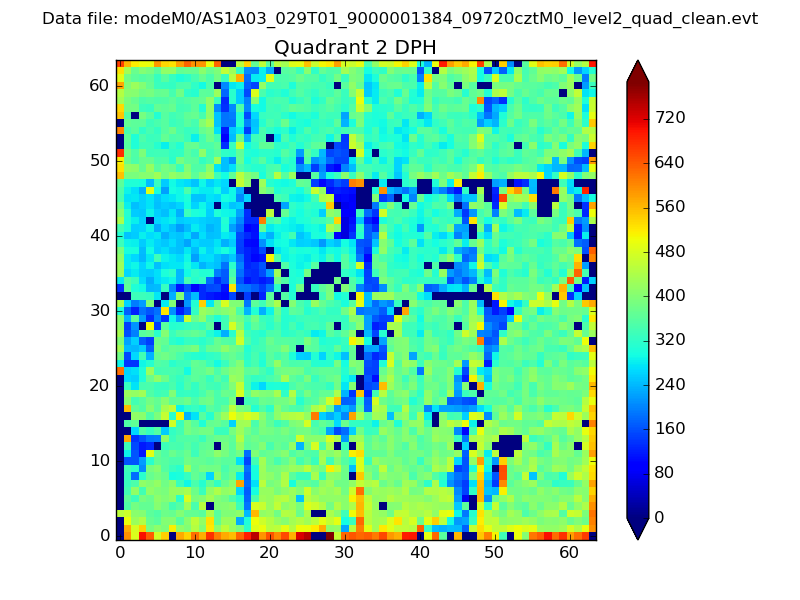
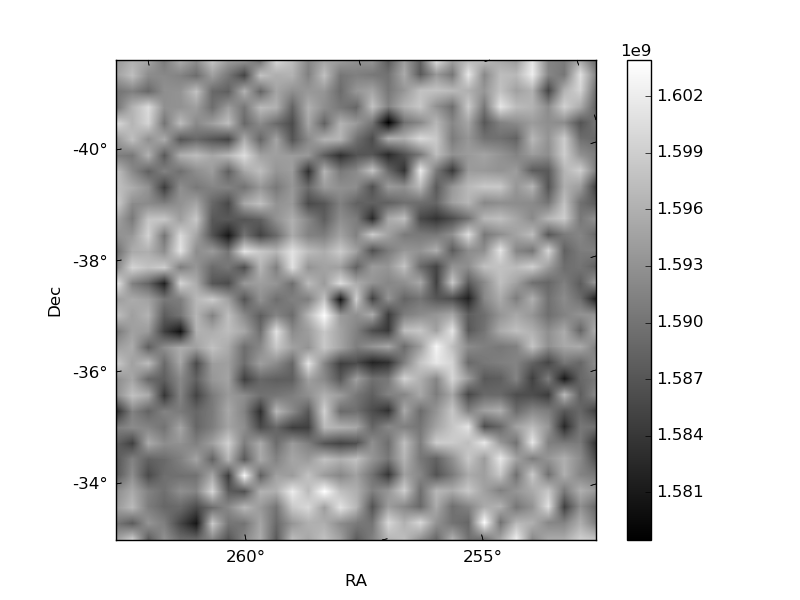
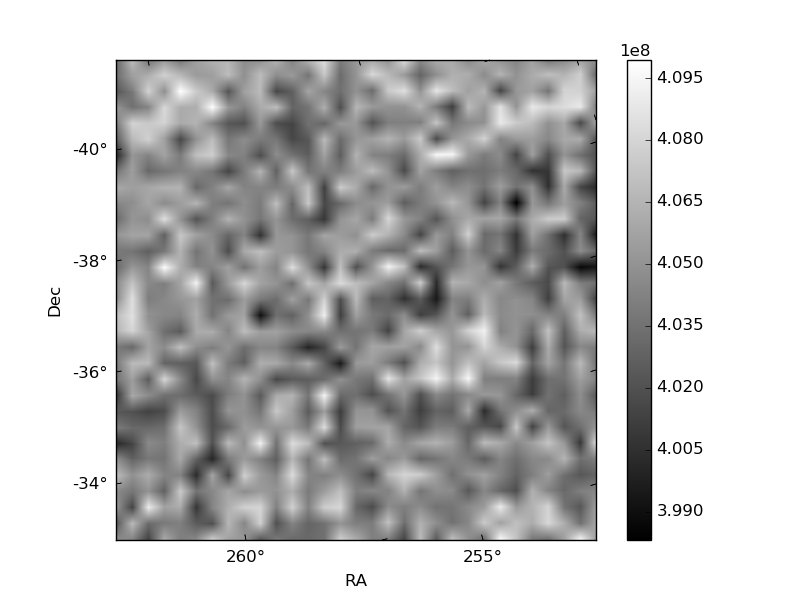
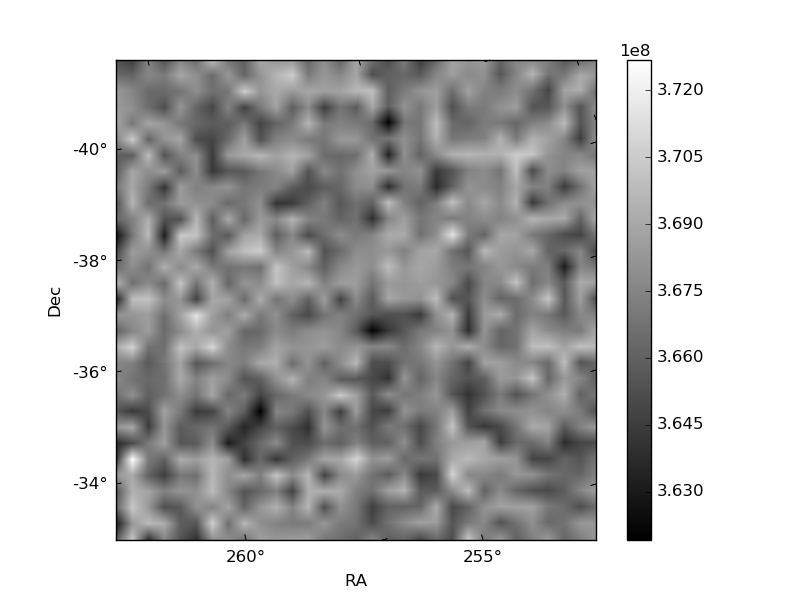
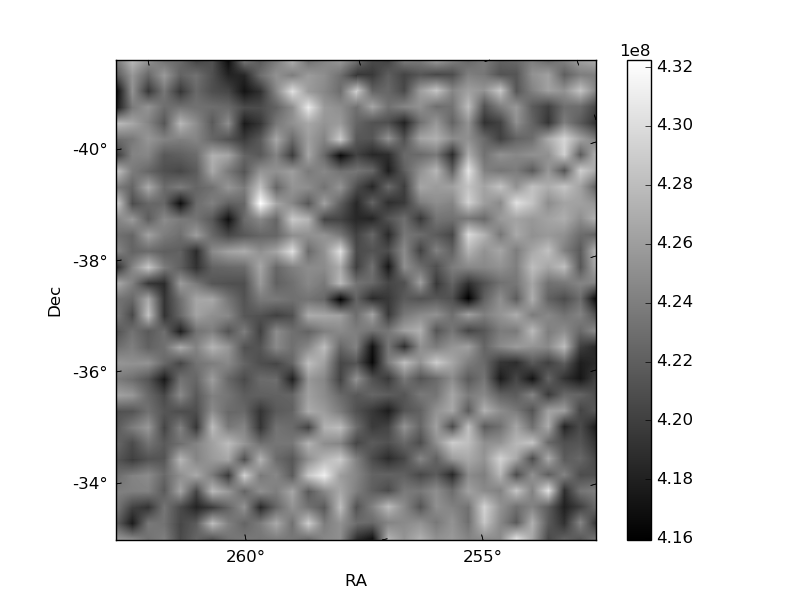
Histogram calculated using DETX and DETY for each event in the final _common_clean file
| Quadrant A | 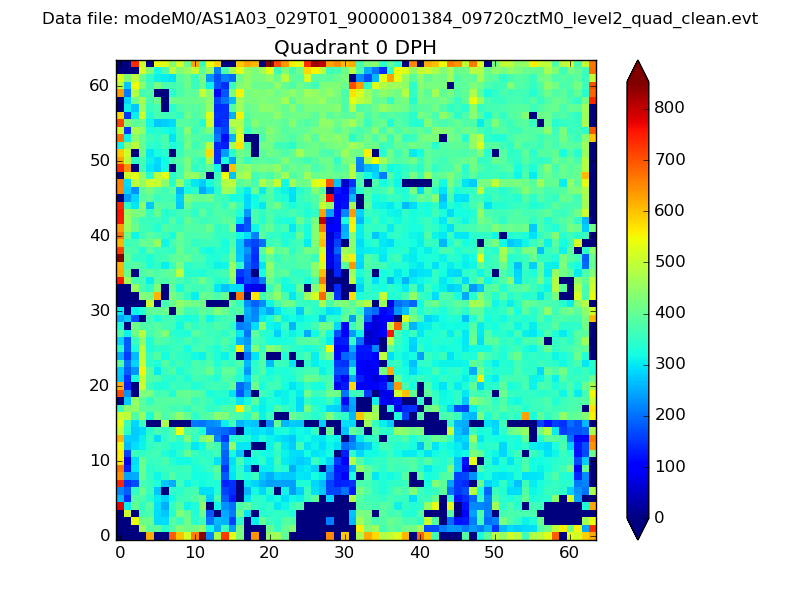 |
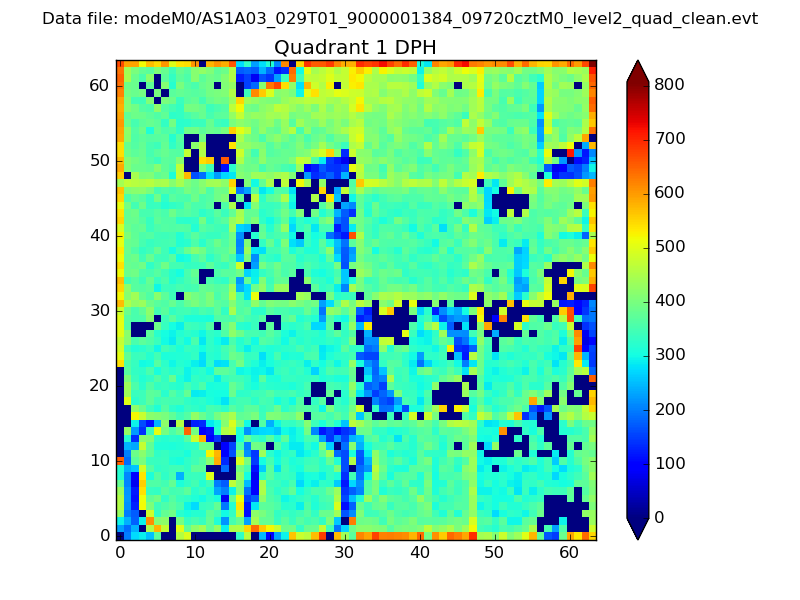 |
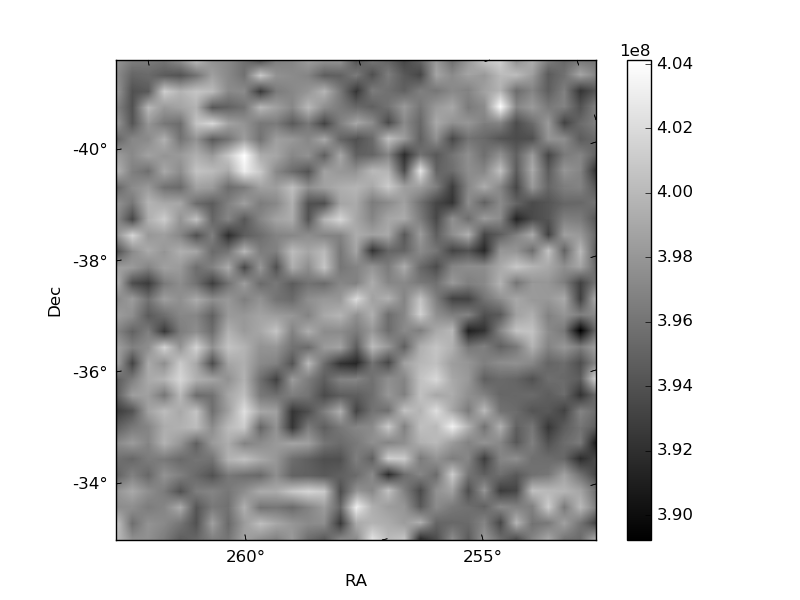
Quadrant B |
|---|---|---|---|
| Quadrant D | 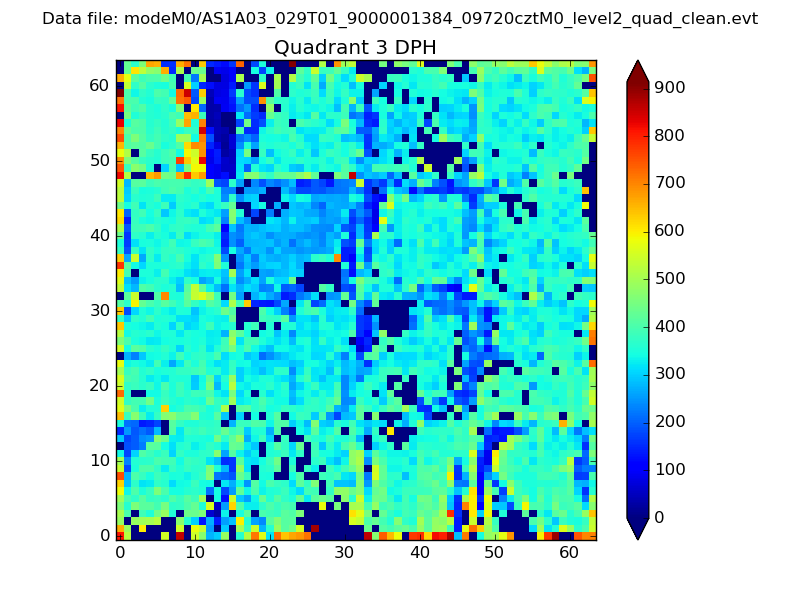 |
 |
Quadrant C |
| Plot type | Count rate plots | Images |
|---|---|---|
| Comparison with Poisson distribution Blue bars denote a histogram of data divided into 1 sec bins. Red curve is a Poisson curve with rate = median count rate of data. |
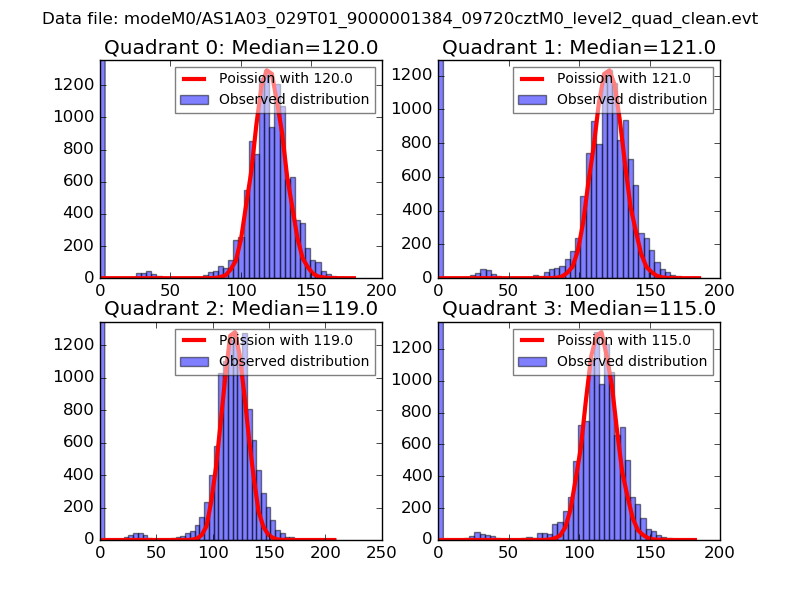 |
 |
| Quadrant-wise count rates Data is divided into 100 sec bins |
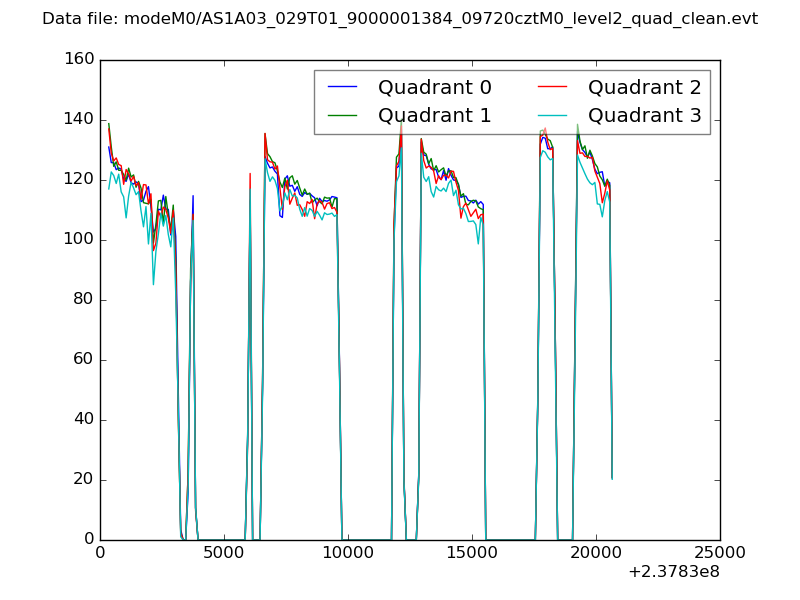 |
|
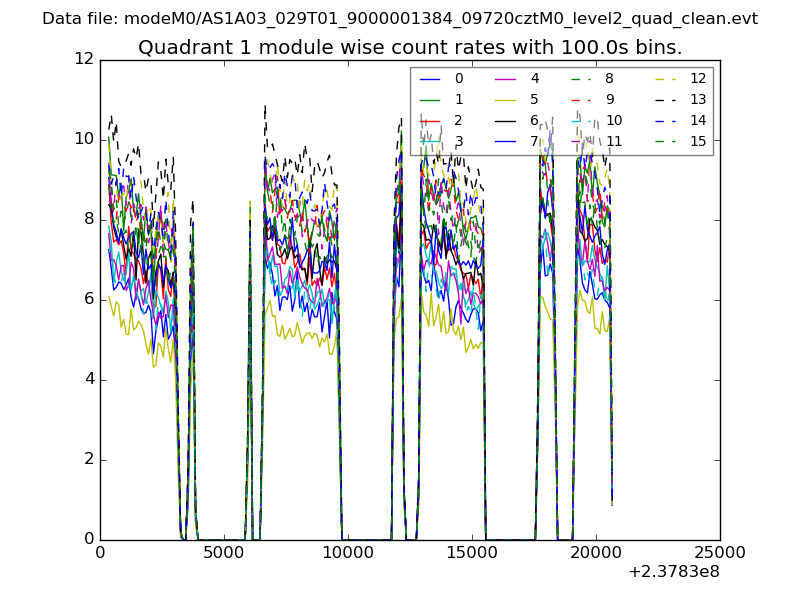
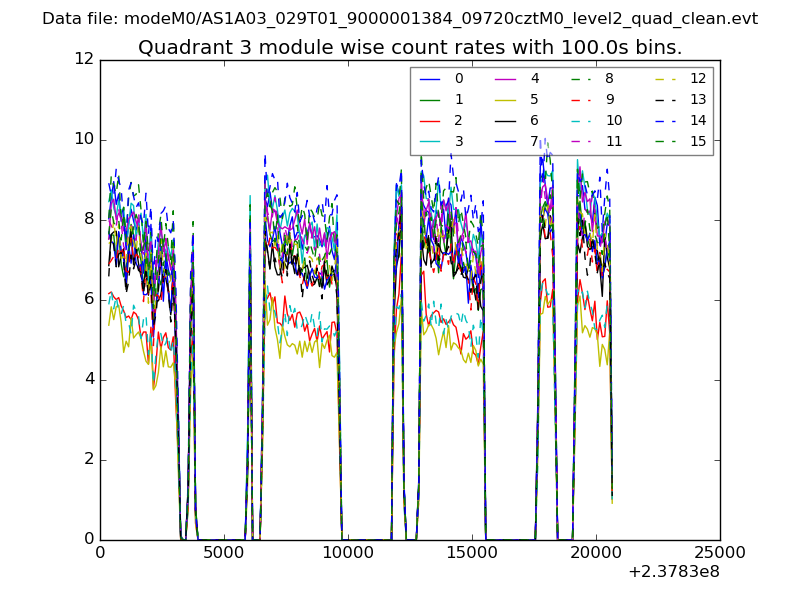
| Module-wise count rates for Quadrant A Data is divided into 100 sec bins |
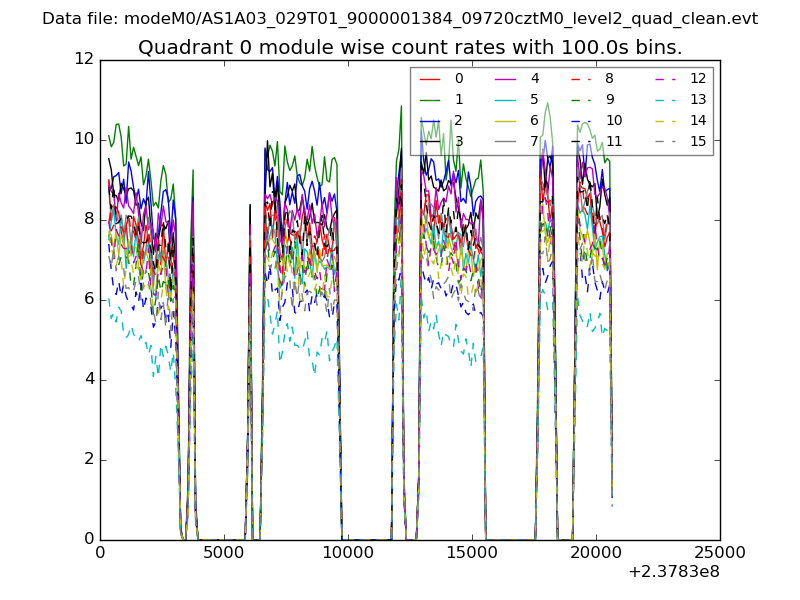 |
 |
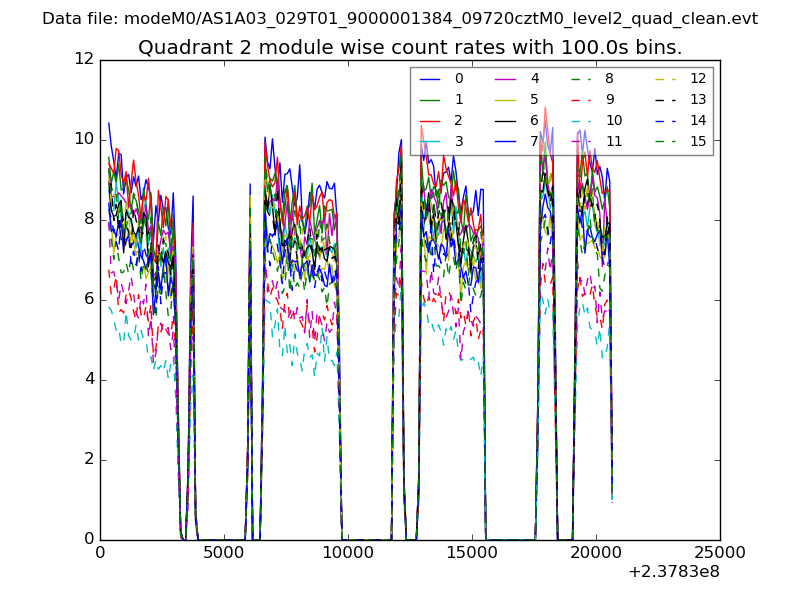
| Module-wise count rates for Quadrant B Data is divided into 100 sec bins |
 |
 |
| Module-wise count rates for Quadrant C Data is divided into 100 sec bins |
 |
 |
| Module-wise count rates for Quadrant D Data is divided into 100 sec bins |
 |
 |
| Parameter | Plot |
|---|---|
| CZT HV Monitor | 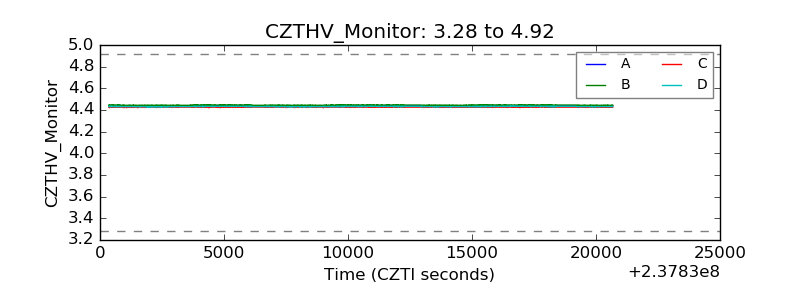 |
| D_VDD | 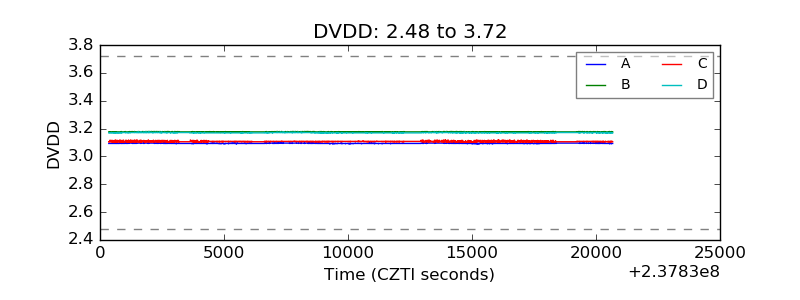 |
| Temperature 1 | 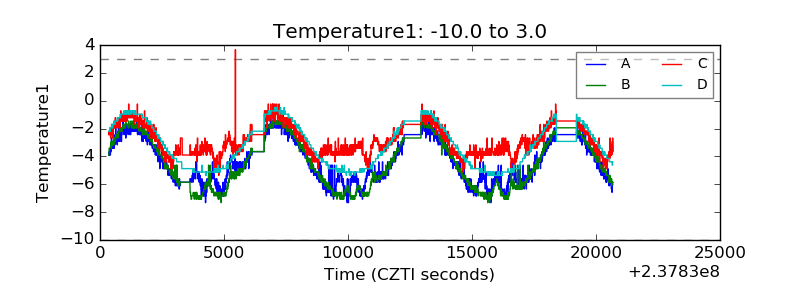 |
| Veto HV Monitor | 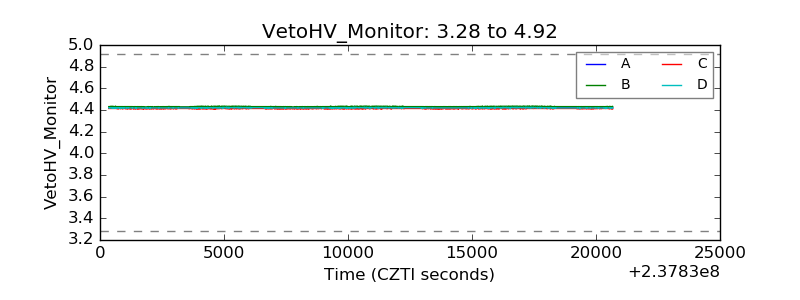 |
| Veto LLD | 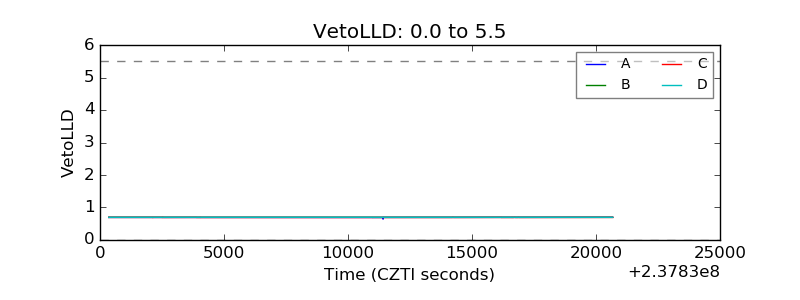 |
| Alpha Counter | 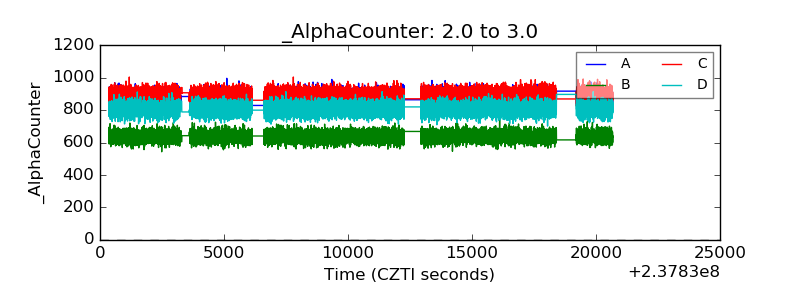 |
| _CPM_Rate | 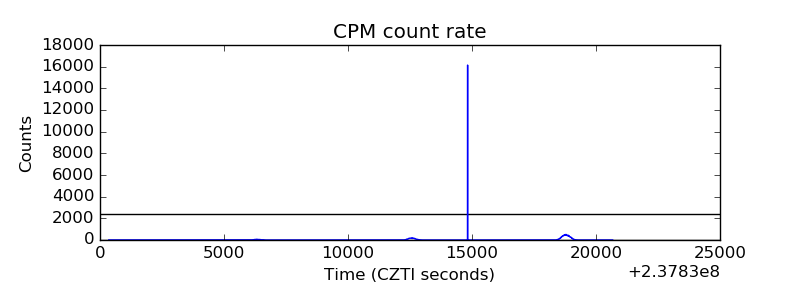 |
| CZT Counter | 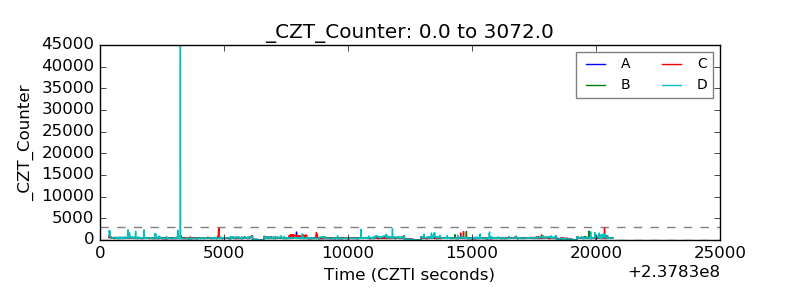 |
| +2.5 Volts monitor |  |
| +5 Volts monitor |  |
| _ROLL_ROT | 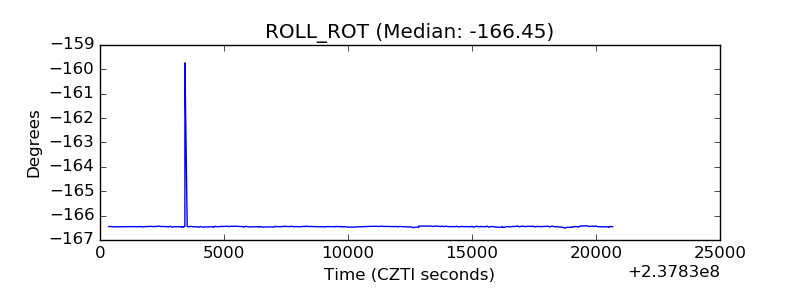 |
| _Roll_DEC | 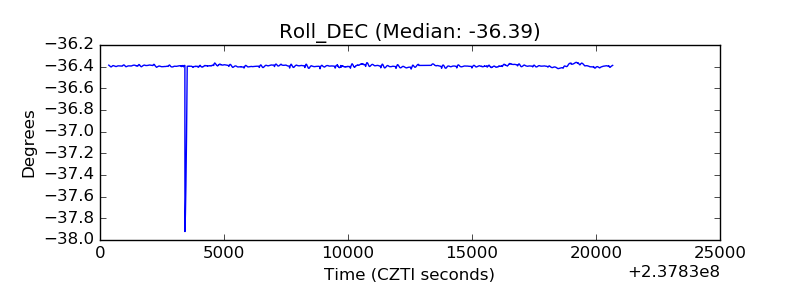 |
| _Roll_RA | 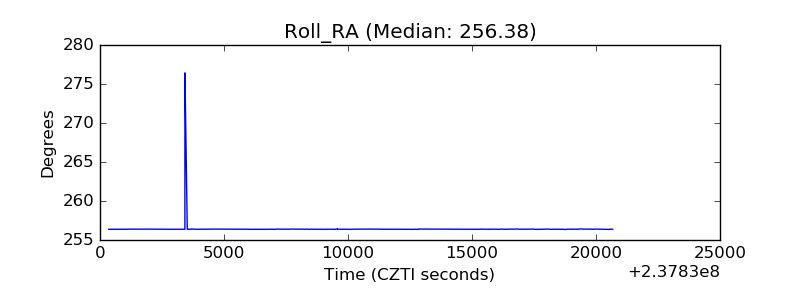 |
| Veto Counter | 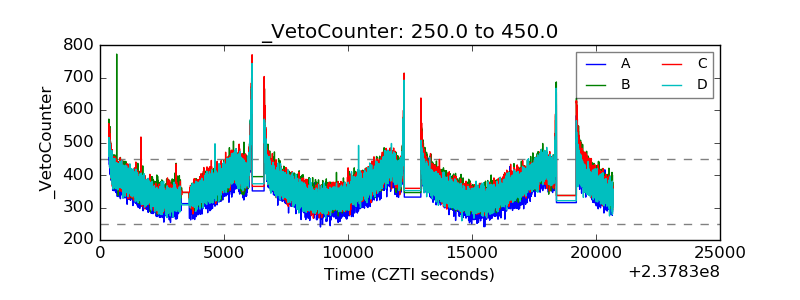 |