| Param | Original file | Final file |
|---|---|---|
| Filename | modeM0/AS1A03_029T01_9000001384_09723cztM0_level2.evt | modeM0/AS1A03_029T01_9000001384_09723cztM0_level2_quad_clean.evt |
| Size (bytes) | 456,304,320 | 89,614,080 |
| Size | 435.2 MB | 85.5 MB |
| Events in quadrant A | 3,161,801 | 569,508 |
| Events in quadrant B | 3,275,510 | 575,883 |
| Events in quadrant C | 3,011,644 | 568,139 |
| Events in quadrant D | 3,916,262 | 534,575 |
| Mode M0 | |||
|---|---|---|---|
| Quadrant | BADHDUFLAG | Total packets | Discarded packets |
| A | 0 | 13764 | 14 |
| B | 0 | 14321 | 35 |
| C | 0 | 13649 | 32 |
| D | 0 | 16290 | 34 |
| Mode M9 | |||
|---|---|---|---|
| Quadrant | BADHDUFLAG | Total packets | Discarded packets |
| A | 0 | 11 | 0 |
| B | 0 | 11 | 0 |
| C | 0 | 11 | 0 |
| D | 0 | 12 | 0 |
| Mode SS | |||
|---|---|---|---|
| Quadrant | BADHDUFLAG | Total packets | Discarded packets |
| A | 0 | 134 | 0 |
| B | 0 | 134 | 0 |
| C | 0 | 134 | 0 |
| D | 0 | 134 | 0 |
| Quadrant | Total seconds | Saturated seconds | Saturation percentage |
|---|---|---|---|
| A | 6689 | 45 | 0.672746% |
| B | 6682 | 36 | 0.538761% |
| C | 6683 | 25 | 0.374083% |
| D | 6686 | 237 | 3.544720% |
Noise dominated data is calculated using 1-second bins in cleaned event files. If a bin has >2000 counts, and if more than 50% of those come from <1% of pixels, then it is considered to be noise-dominated and hence unusable.
| Quadrant | # 1 sec bins | Bins with >0 counts | Bins with >2000 counts | High rate bins dominated by noise | Noise dominated (total time) | Noise dominated (detector-on time) | Marked lightcurve |
|---|---|---|---|---|---|---|---|
| A | 7655 | 6696 | 17 | 17 | 0.22% | 0.25% | 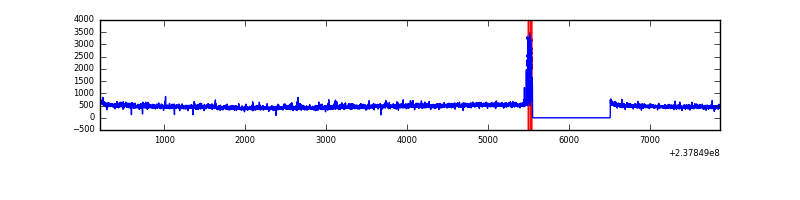 |
| B | 7655 | 6695 | 4 | 4 | 0.05% | 0.06% | 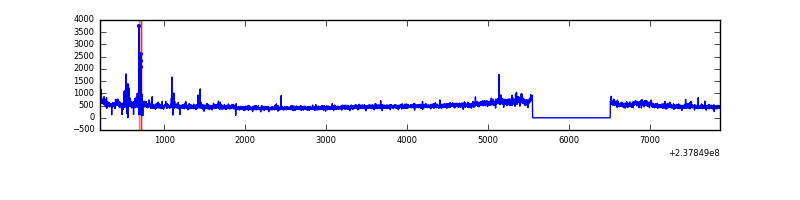 |
| C | 7655 | 6695 | 10 | 10 | 0.13% | 0.15% | 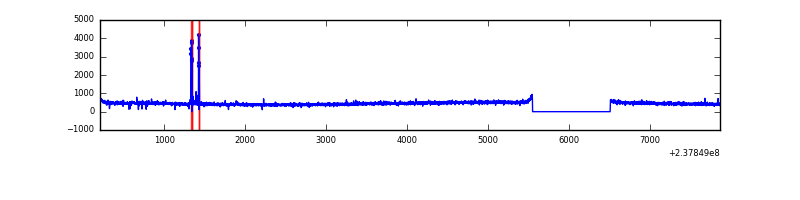 |
| D | 7655 | 6696 | 164 | 164 | 2.14% | 2.45% | 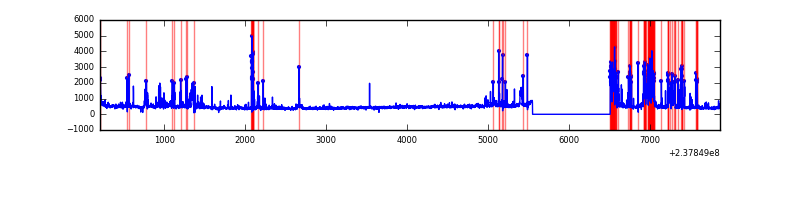 |
Top three noisy pixels from each quadrant. If the there are fewer than three noisy pixels in the level2.evt file, extra rows are filled as -1
| Pixel properties | Quadrant properties | ||||||
|---|---|---|---|---|---|---|---|
| Quadrant | DetID | PixID | Counts | Sigma | Mean | Median | Sigma |
| A | 15 | 174 | 56110 | 348.0 | 780 | 764 | 159.0 |
| A | 1 | 162 | 50408 | 312.14 | 780 | 764 | 159.0 |
| A | 1 | 178 | 20688 | 125.27 | 780 | 764 | 159.0 |
| B | 0 | 219 | 60255 | 393.97 | 788 | 767 | 151.0 |
| B | 0 | 187 | 44255 | 288.01 | 788 | 767 | 151.0 |
| B | 0 | 246 | 43236 | 281.26 | 788 | 767 | 151.0 |
| C | 14 | 234 | 46520 | 260.46 | 756 | 760 | 175.7 |
| C | 10 | 22 | 14154 | 76.24 | 756 | 760 | 175.7 |
| C | 13 | 61 | 5660 | 27.89 | 756 | 760 | 175.7 |
| D | 1 | 52 | 736163 | 3995.93 | 738 | 720 | 184.0 |
| D | 10 | 199 | 287630 | 1558.89 | 738 | 720 | 184.0 |
| D | 7 | 46 | 41931 | 223.91 | 738 | 720 | 184.0 |
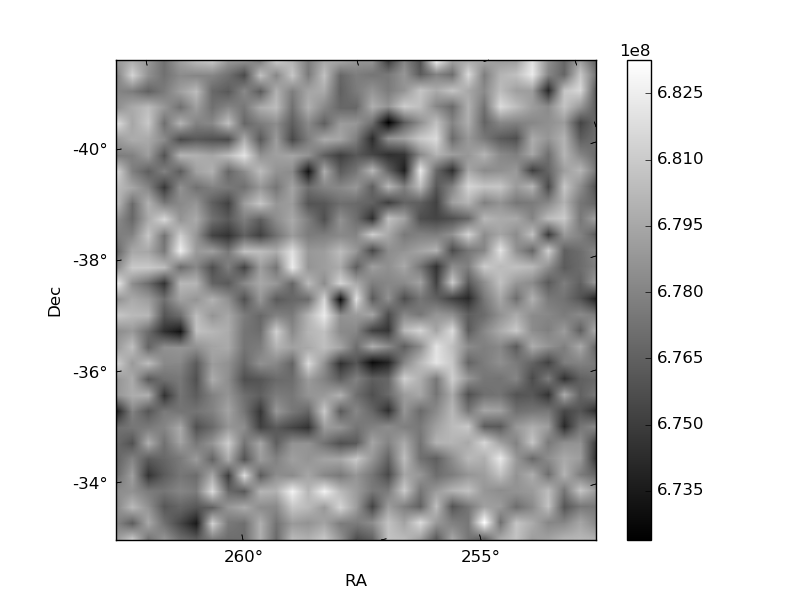
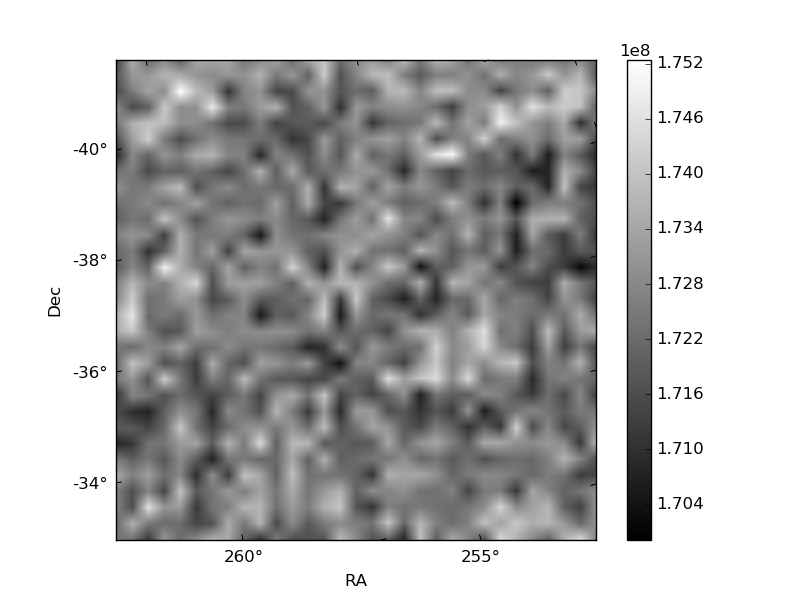
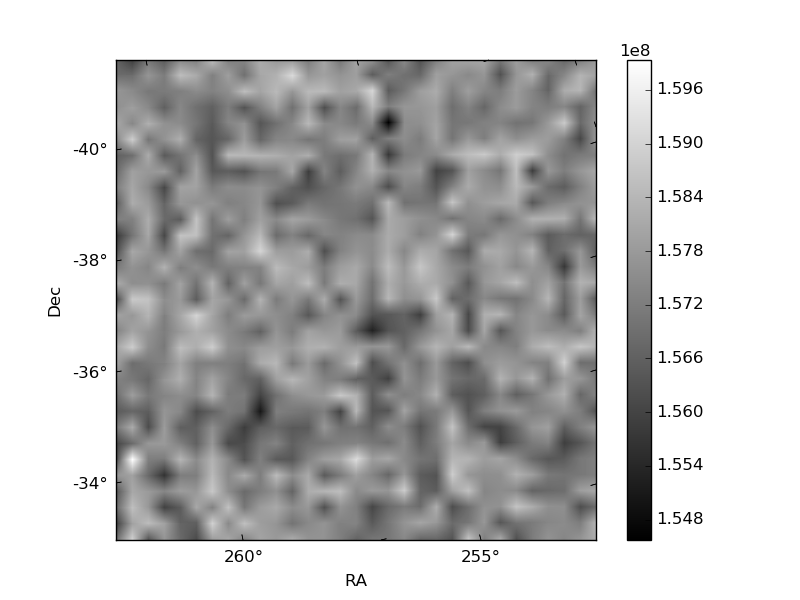
Histogram calculated using DETX and DETY for each event in the final _common_clean file
| Quadrant A | 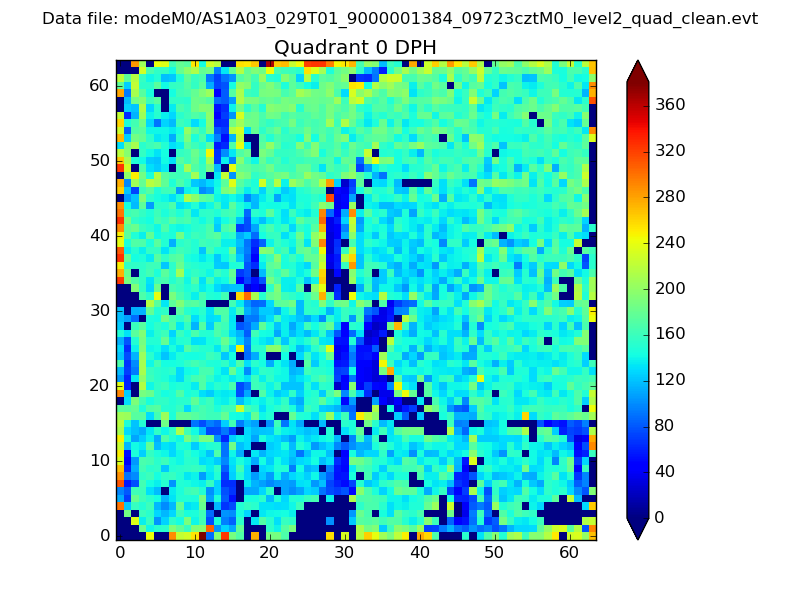 |
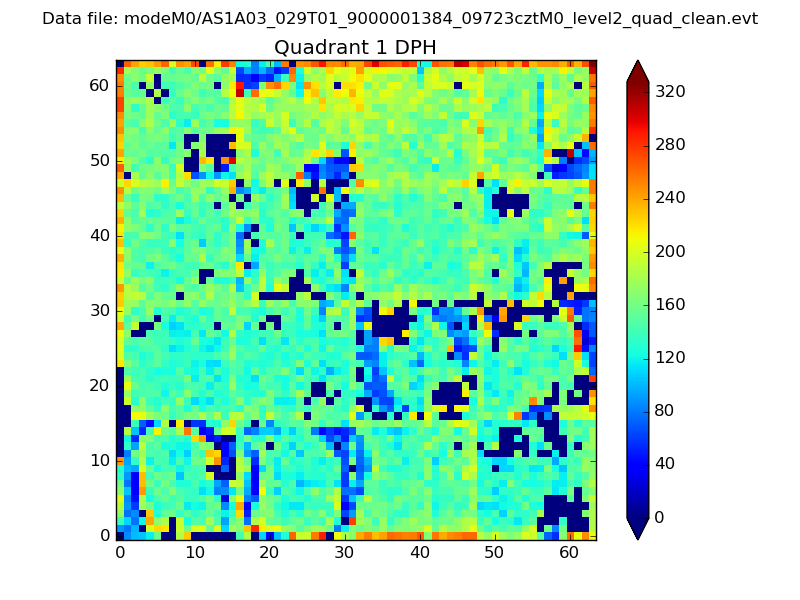 |
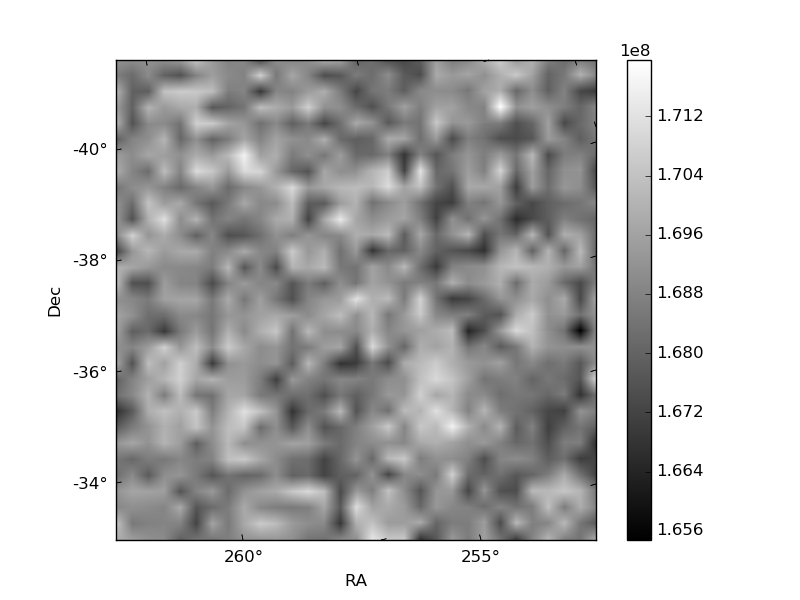
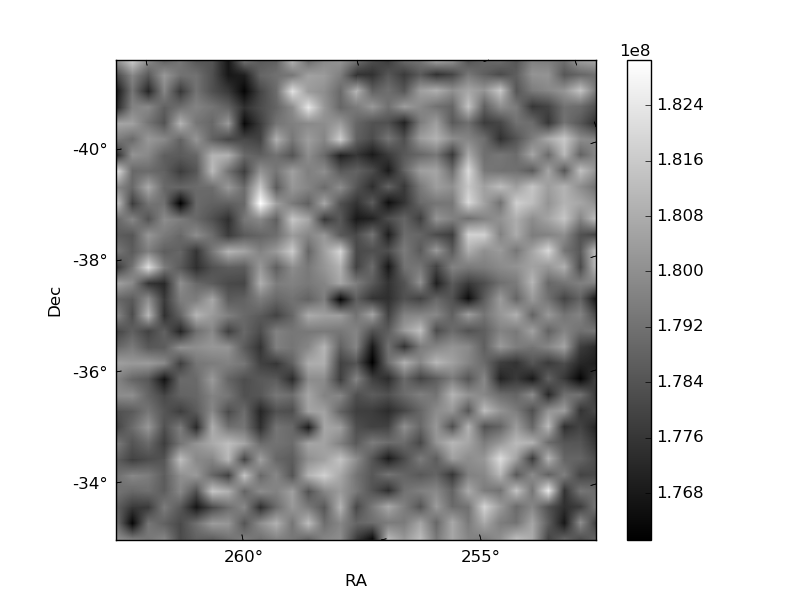
Quadrant B |
|---|---|---|---|
| Quadrant D | 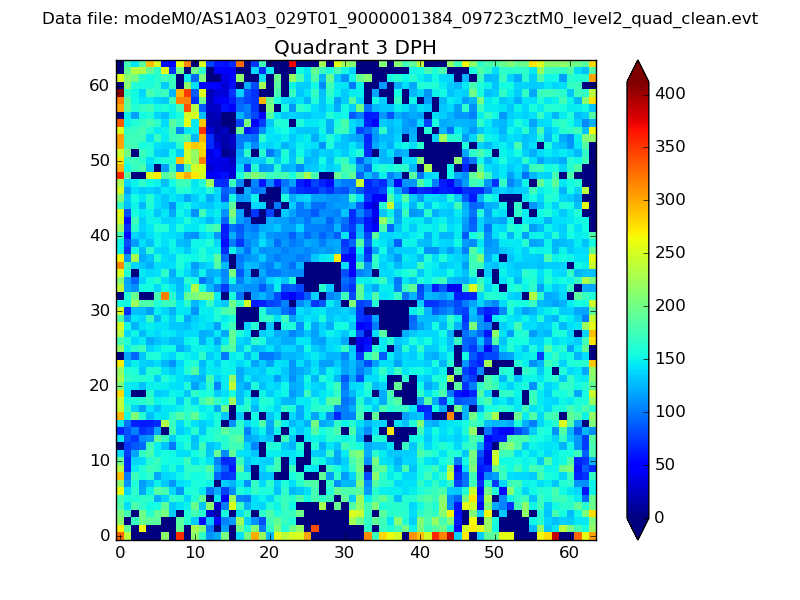 |
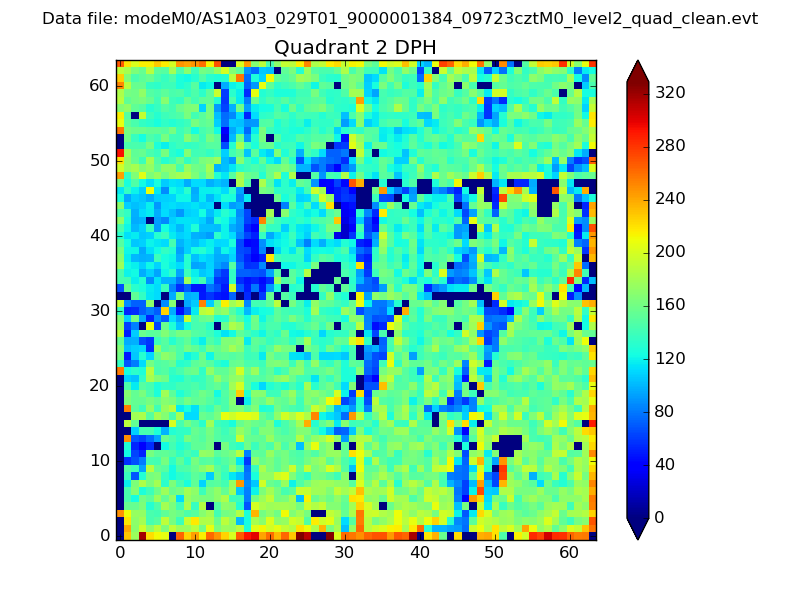 |
Quadrant C |
| Plot type | Count rate plots | Images |
|---|---|---|
| Comparison with Poisson distribution Blue bars denote a histogram of data divided into 1 sec bins. Red curve is a Poisson curve with rate = median count rate of data. |
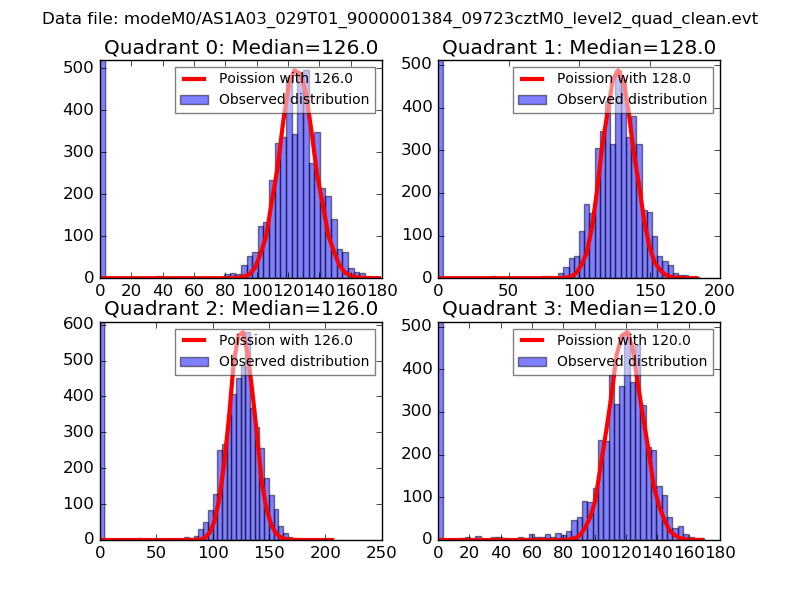 |
 |
| Quadrant-wise count rates Data is divided into 100 sec bins |
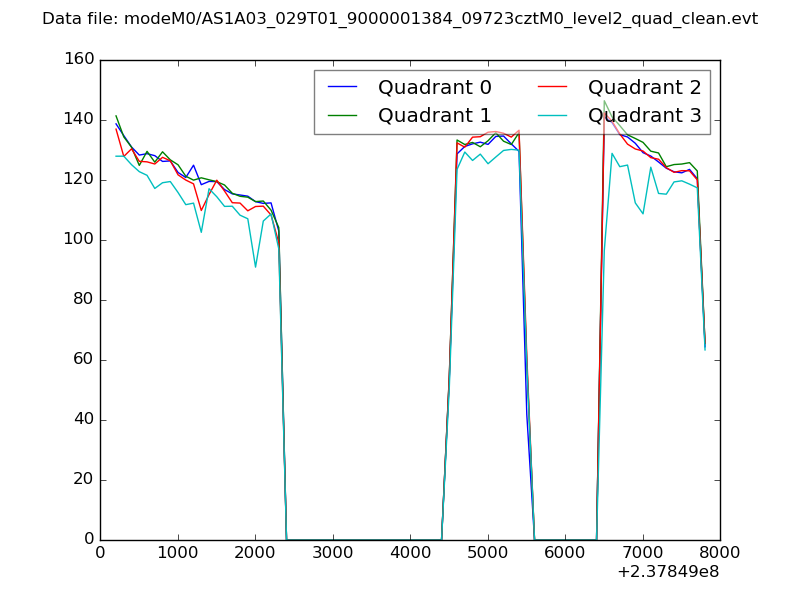 |
|
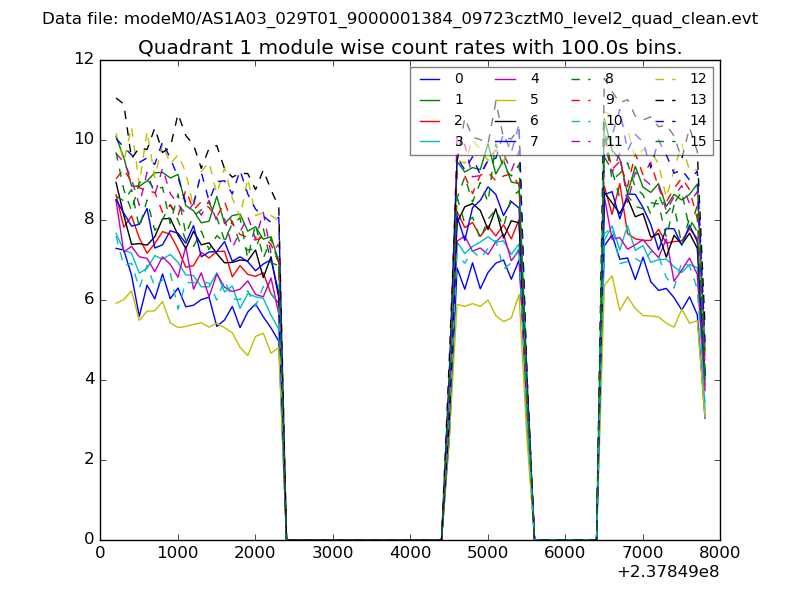
| Module-wise count rates for Quadrant A Data is divided into 100 sec bins |
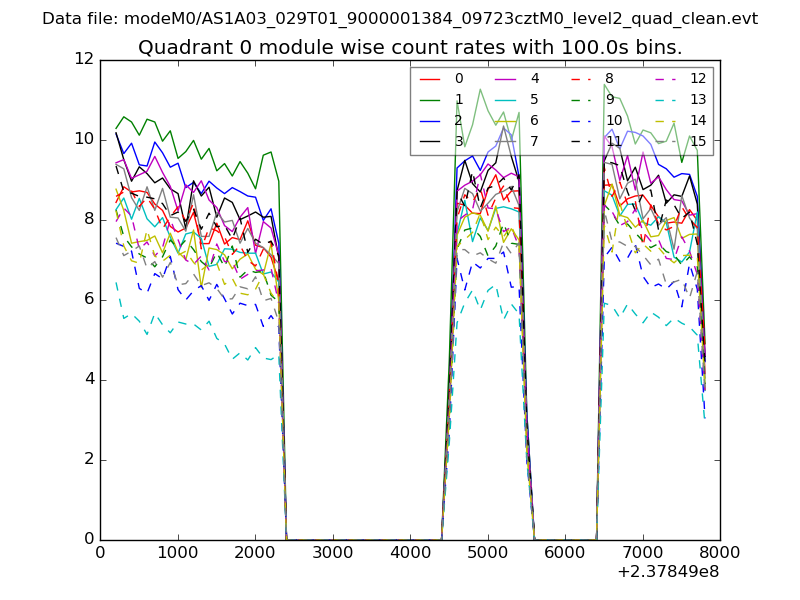 |
 |
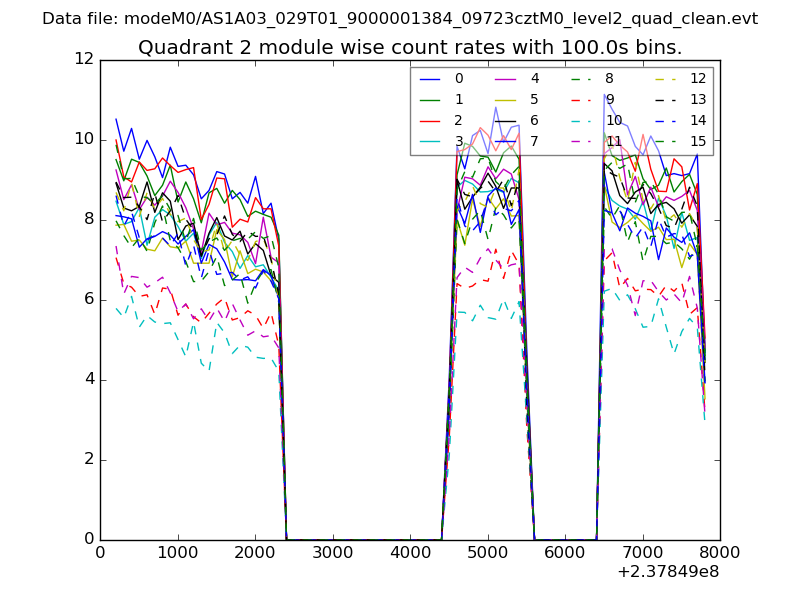
| Module-wise count rates for Quadrant B Data is divided into 100 sec bins |
 |
 |
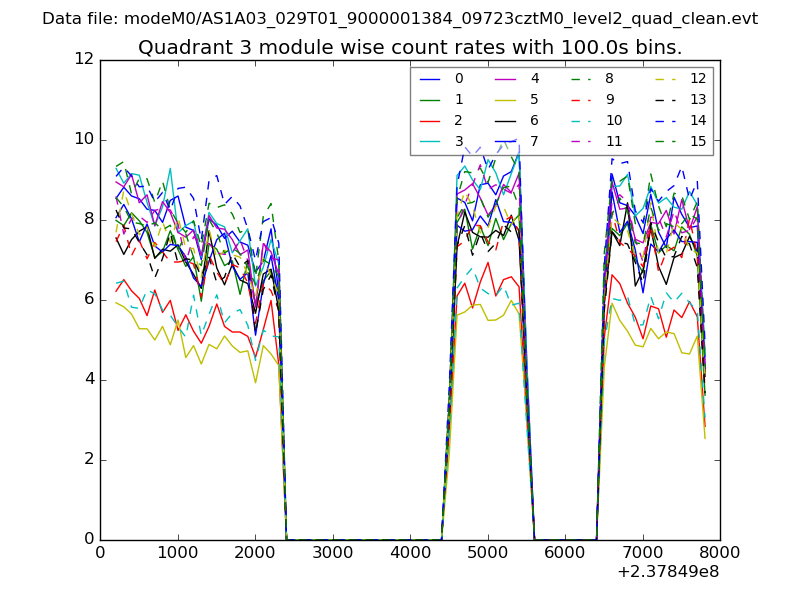
| Module-wise count rates for Quadrant C Data is divided into 100 sec bins |
 |
 |
| Module-wise count rates for Quadrant D Data is divided into 100 sec bins |
 |
 |
| Parameter | Plot |
|---|---|
| CZT HV Monitor | 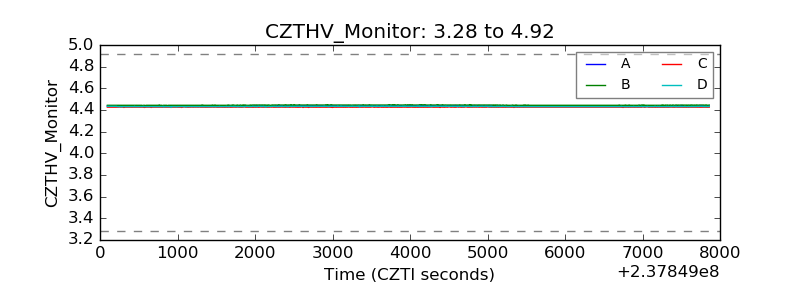 |
| D_VDD | 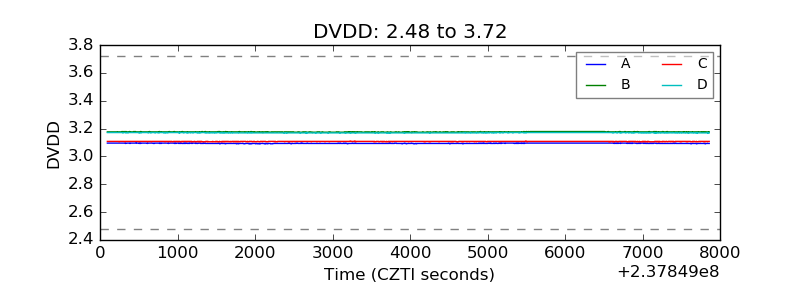 |
| Temperature 1 | 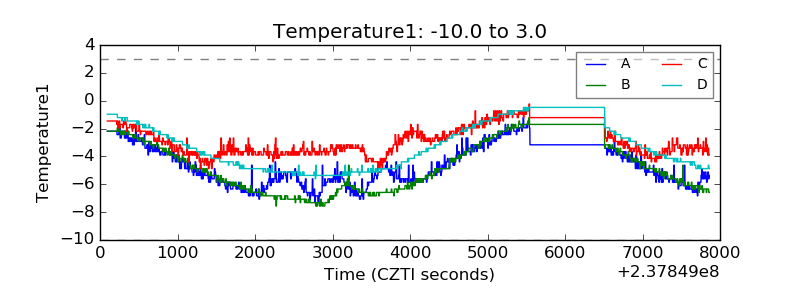 |
| Veto HV Monitor | 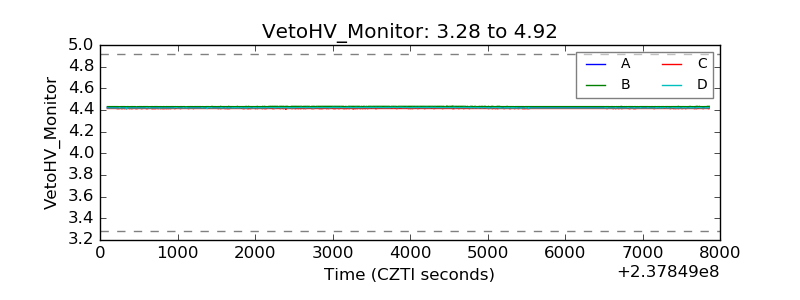 |
| Veto LLD | 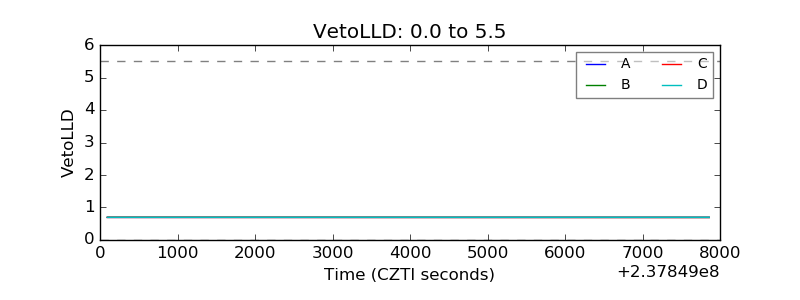 |
| Alpha Counter | 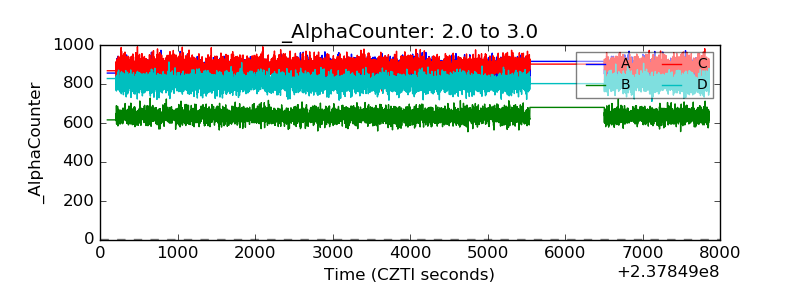 |
| _CPM_Rate | 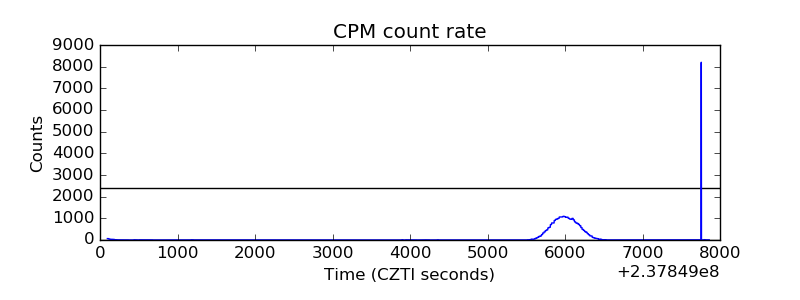 |
| CZT Counter | 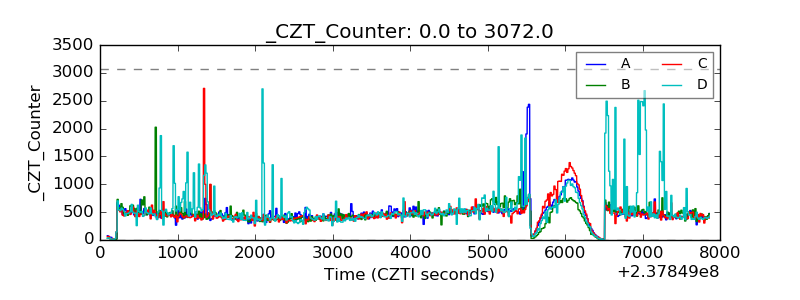 |
| +2.5 Volts monitor |  |
| +5 Volts monitor | 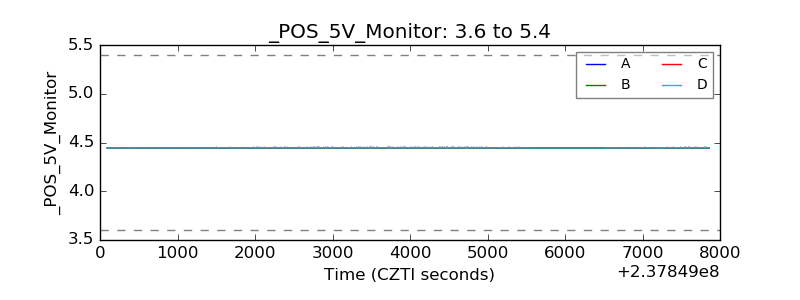 |
| _ROLL_ROT | 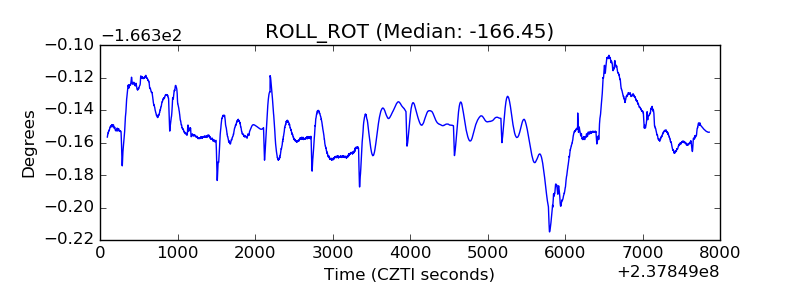 |
| _Roll_DEC | 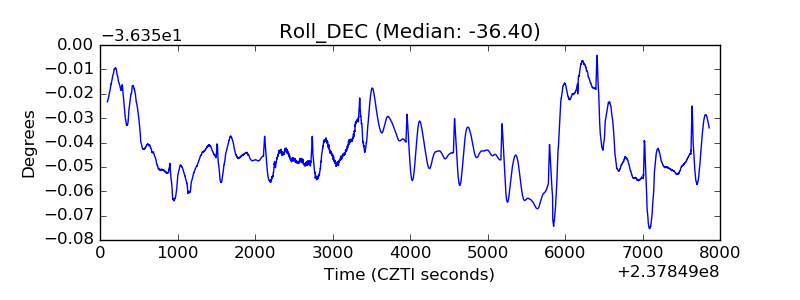 |
| _Roll_RA | 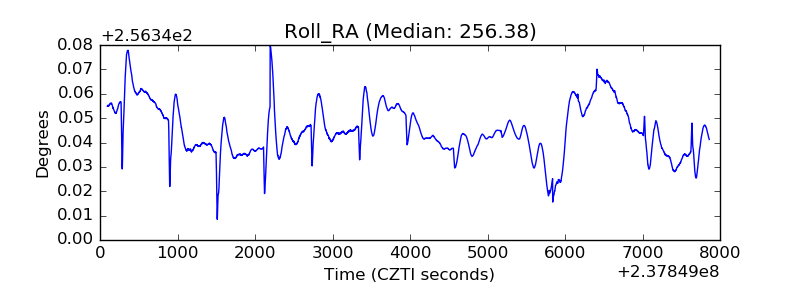 |
| Veto Counter | 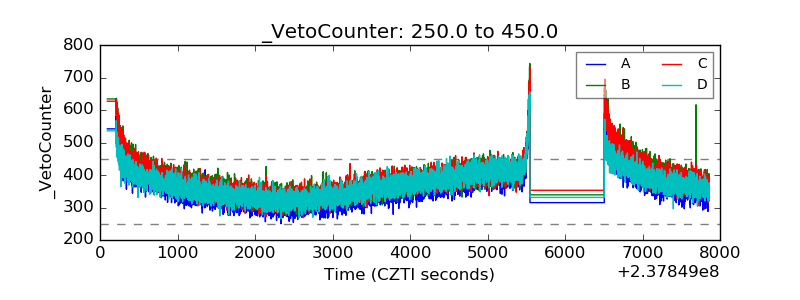 |