| Param | Original file | Final file |
|---|---|---|
| Filename | modeM0/AS1A03_084T01_9000001382cztM0_level2.fits | modeM0/AS1A03_084T01_9000001382cztM0_level2_quad_clean.evt |
| Size (bytes) | 183,147,840 | 176,244,480 |
| Size | 174.7 MB | 168.1 MB |
| Events in quadrant A | 1,104,296 | 1,044,759 |
| Events in quadrant B | 1,070,782 | 1,049,307 |
| Events in quadrant C | 1,075,526 | 973,216 |
| Events in quadrant D | 945,494 | 919,461 |
| Mode SS | |||
|---|---|---|---|
| Quadrant | BADHDUFLAG | Total packets | Discarded packets |
| A | 0 | 400 | 0 |
| B | 0 | 400 | 0 |
| C | 0 | 400 | 0 |
| D | 0 | 400 | 0 |
| Mode M0 | |||
|---|---|---|---|
| Quadrant | BADHDUFLAG | Total packets | Discarded packets |
| A | 0 | 41771 | 0 |
| B | 0 | 41326 | 0 |
| C | 0 | 44109 | 0 |
| D | 0 | 44308 | 0 |
| Mode M9 | |||
|---|---|---|---|
| Quadrant | BADHDUFLAG | Total packets | Discarded packets |
| A | 0 | 22 | 0 |
| B | 0 | 22 | 0 |
| C | 0 | 22 | 0 |
| D | 0 | 22 | 0 |
| Quadrant | Total seconds | Saturated seconds | Saturation percentage |
|---|---|---|---|
| A | 19601 | 485 | 2.474364% |
| B | 19601 | 470 | 2.397837% |
| C | 19601 | 684 | 3.489618% |
| D | 19600 | 466 | 2.377551% |
Noise dominated data is calculated using 1-second bins in cleaned event files. If a bin has >2000 counts, and if more than 50% of those come from <1% of pixels, then it is considered to be noise-dominated and hence unusable.
| Quadrant | # 1 sec bins | Bins with >0 counts | Bins with >2000 counts | High rate bins dominated by noise | Noise dominated (total time) | Noise dominated (detector-on time) | Marked lightcurve |
|---|---|---|---|---|---|---|---|
| A | 21040 | 19600 | 0 | 0 | 0.00% | 0.00% |  |
| B | 21040 | 19601 | 0 | 0 | 0.00% | 0.00% |  |
| C | 21040 | 19596 | 0 | 0 | 0.00% | 0.00% |  |
| D | 21040 | 19600 | 0 | 0 | 0.00% | 0.00% |  |
Top three noisy pixels from each quadrant. If the there are fewer than three noisy pixels in the level2.evt file, extra rows are filled as -1
| Pixel properties | Quadrant properties | ||||||
|---|---|---|---|---|---|---|---|
| Quadrant | DetID | PixID | Counts | Sigma | Mean | Median | Sigma |
| A | 0 | 29 | 1096 | 11.02 | 288 | 269 | 75.0 |
| A | 7 | 110 | 904 | 8.46 | 288 | 269 | 75.0 |
| A | 0 | 30 | 844 | 7.66 | 288 | 269 | 75.0 |
| B | 2 | 9 | 903 | 10.86 | 282 | 268 | 58.5 |
| B | 5 | 128 | 713 | 7.61 | 282 | 268 | 58.5 |
| B | 2 | 8 | 690 | 7.21 | 282 | 268 | 58.5 |
| C | 12 | 241 | 835 | 7.52 | 284 | 263 | 76.1 |
| C | 1 | 80 | 792 | 6.95 | 284 | 263 | 76.1 |
| C | 1 | 81 | 776 | 6.74 | 284 | 263 | 76.1 |
| D | 3 | 14 | 728 | 6.64 | 269 | 244 | 72.9 |
| D | 6 | 231 | 704 | 6.31 | 269 | 244 | 72.9 |
| D | 3 | 159 | 676 | 5.93 | 269 | 244 | 72.9 |
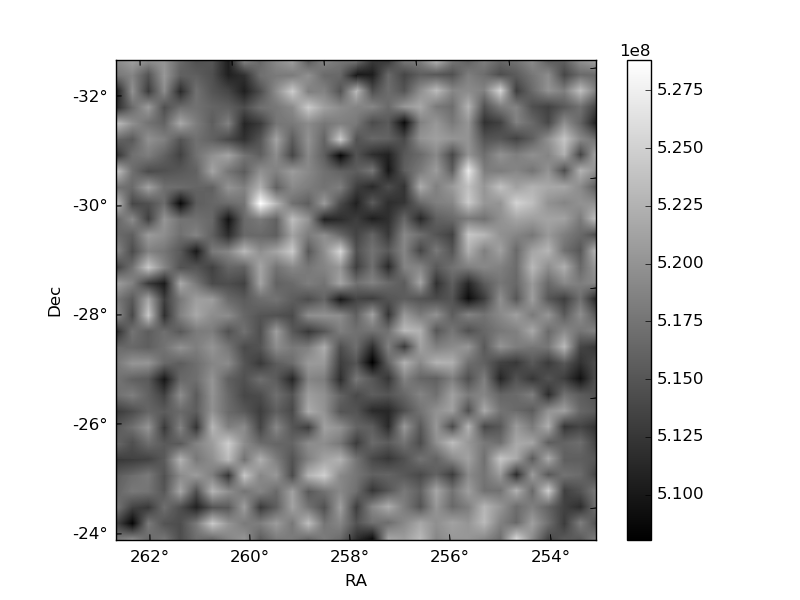
Histogram calculated using DETX and DETY for each event in the final _common_clean file
| Quadrant A | 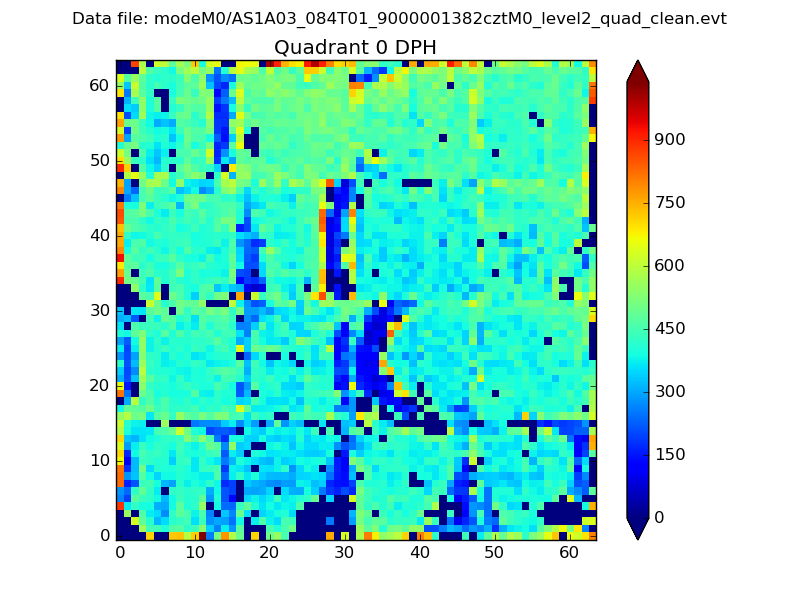 |
 |
Quadrant B |
|---|---|---|---|
| Quadrant D |  |
 |
Quadrant C |
| Plot type | Count rate plots | Images |
|---|---|---|
| Comparison with Poisson distribution Blue bars denote a histogram of data divided into 1 sec bins. Red curve is a Poisson curve with rate = median count rate of data. |
 |
 |
| Quadrant-wise count rates Data is divided into 100 sec bins |
 |
|
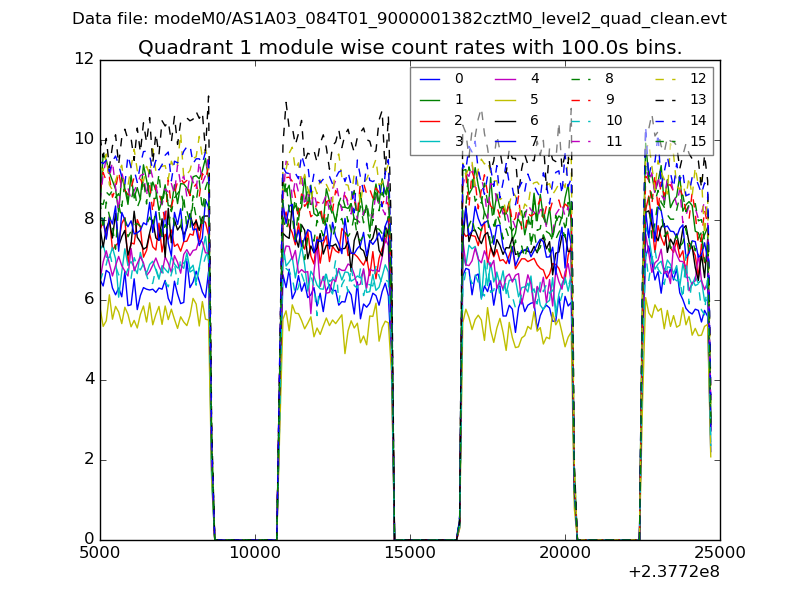
| Module-wise count rates for Quadrant A Data is divided into 100 sec bins |
 |
 |
| Module-wise count rates for Quadrant B Data is divided into 100 sec bins |
 |
 |
| Module-wise count rates for Quadrant C Data is divided into 100 sec bins |
 |
 |
| Module-wise count rates for Quadrant D Data is divided into 100 sec bins |
 |
 |
| Parameter | Plot |
|---|---|
| CZT HV Monitor | 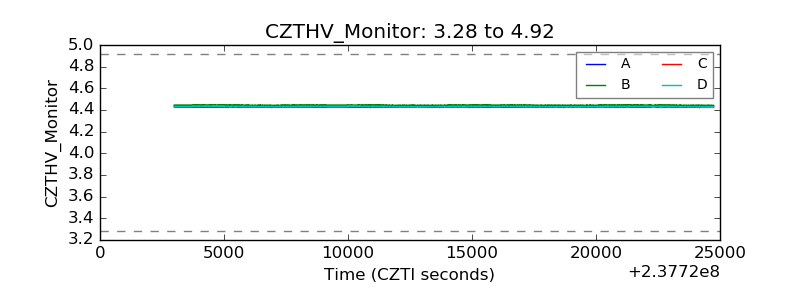 |
| D_VDD |  |
| Temperature 1 |  |
| Veto HV Monitor |  |
| Veto LLD |  |
| Alpha Counter | 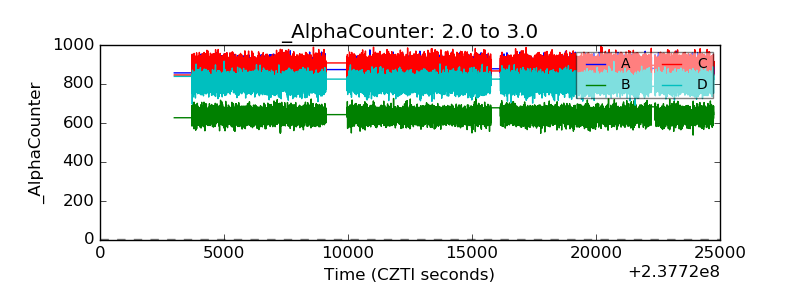 |
| _CPM_Rate | 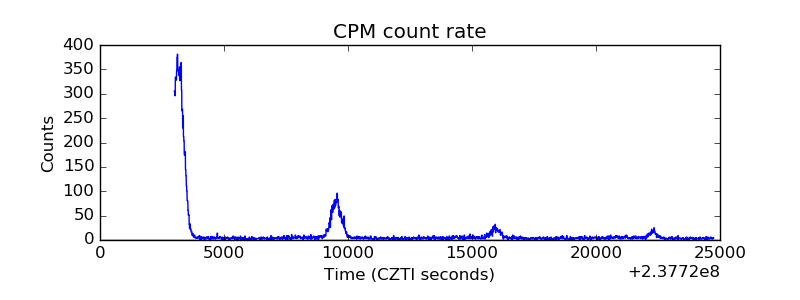 |
| CZT Counter |  |
| +2.5 Volts monitor |  |
| +5 Volts monitor |  |
| _ROLL_ROT | 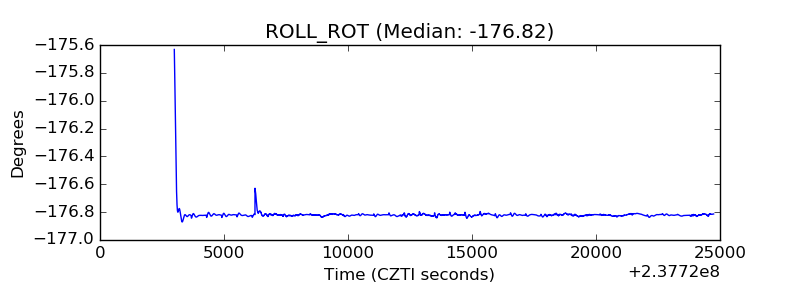 |
| _Roll_DEC |  |
| _Roll_RA |  |
| Veto Counter |  |