| Param | Original file | Final file |
|---|---|---|
| Filename | modeM0/AS1A03_084T01_9000001382_09700cztM0_level2.evt | modeM0/AS1A03_084T01_9000001382_09700cztM0_level2_quad_clean.evt |
| Size (bytes) | 477,025,920 | 83,738,880 |
| Size | 454.9 MB | 79.9 MB |
| Events in quadrant A | 3,563,053 | 519,866 |
| Events in quadrant B | 3,347,458 | 528,235 |
| Events in quadrant C | 3,342,431 | 516,986 |
| Events in quadrant D | 3,731,665 | 496,695 |
| Mode SS | |||
|---|---|---|---|
| Quadrant | BADHDUFLAG | Total packets | Discarded packets |
| A | 0 | 138 | 0 |
| B | 0 | 138 | 0 |
| C | 0 | 138 | 0 |
| D | 0 | 138 | 0 |
| Mode M0 | |||
|---|---|---|---|
| Quadrant | BADHDUFLAG | Total packets | Discarded packets |
| A | 0 | 14619 | 3 |
| B | 0 | 14120 | 2 |
| C | 0 | 14454 | 2 |
| D | 0 | 15350 | 2 |
| Mode M9 | |||
|---|---|---|---|
| Quadrant | BADHDUFLAG | Total packets | Discarded packets |
| A | 0 | 16 | 0 |
| B | 0 | 16 | 0 |
| C | 0 | 16 | 0 |
| D | 0 | 16 | 0 |
| Quadrant | Total seconds | Saturated seconds | Saturation percentage |
|---|---|---|---|
| A | 6802 | 131 | 1.925904% |
| B | 6802 | 119 | 1.749485% |
| C | 6802 | 140 | 2.058218% |
| D | 6802 | 112 | 1.646575% |
Noise dominated data is calculated using 1-second bins in cleaned event files. If a bin has >2000 counts, and if more than 50% of those come from <1% of pixels, then it is considered to be noise-dominated and hence unusable.
| Quadrant | # 1 sec bins | Bins with >0 counts | Bins with >2000 counts | High rate bins dominated by noise | Noise dominated (total time) | Noise dominated (detector-on time) | Marked lightcurve |
|---|---|---|---|---|---|---|---|
| A | 7652 | 6803 | 0 | 0 | 0.00% | 0.00% | 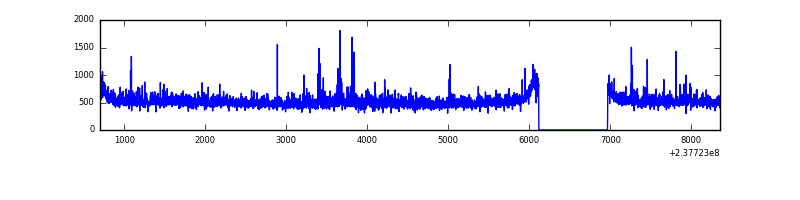 |
| B | 7652 | 6803 | 0 | 0 | 0.00% | 0.00% |  |
| C | 7652 | 6803 | 25 | 25 | 0.33% | 0.37% | 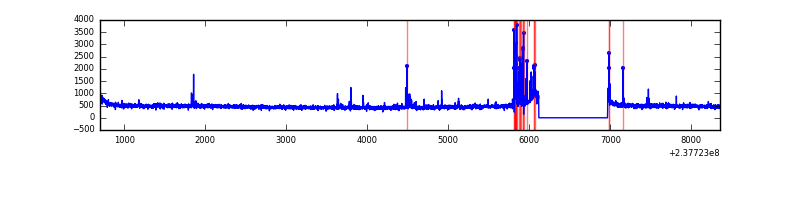 |
| D | 7652 | 6803 | 26 | 26 | 0.34% | 0.38% | 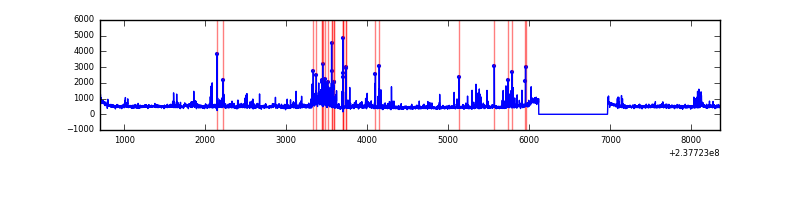 |
Top three noisy pixels from each quadrant. If the there are fewer than three noisy pixels in the level2.evt file, extra rows are filled as -1
| Pixel properties | Quadrant properties | ||||||
|---|---|---|---|---|---|---|---|
| Quadrant | DetID | PixID | Counts | Sigma | Mean | Median | Sigma |
| A | 1 | 162 | 149949 | 861.69 | 838 | 819 | 173.1 |
| A | 1 | 178 | 59501 | 339.07 | 838 | 819 | 173.1 |
| A | 1 | 161 | 55209 | 314.27 | 838 | 819 | 173.1 |
| B | 0 | 214 | 22419 | 134.77 | 837 | 818 | 160.3 |
| B | 10 | 245 | 20975 | 125.77 | 837 | 818 | 160.3 |
| B | 12 | 111 | 18166 | 108.24 | 837 | 818 | 160.3 |
| C | 14 | 234 | 177472 | 937.72 | 808 | 810 | 188.4 |
| C | 9 | 237 | 6498 | 30.19 | 808 | 810 | 188.4 |
| C | 13 | 61 | 6076 | 27.95 | 808 | 810 | 188.4 |
| D | 1 | 52 | 285638 | 1450.59 | 806 | 788 | 196.4 |
| D | 12 | 233 | 145183 | 735.33 | 806 | 788 | 196.4 |
| D | 2 | 152 | 51799 | 259.77 | 806 | 788 | 196.4 |
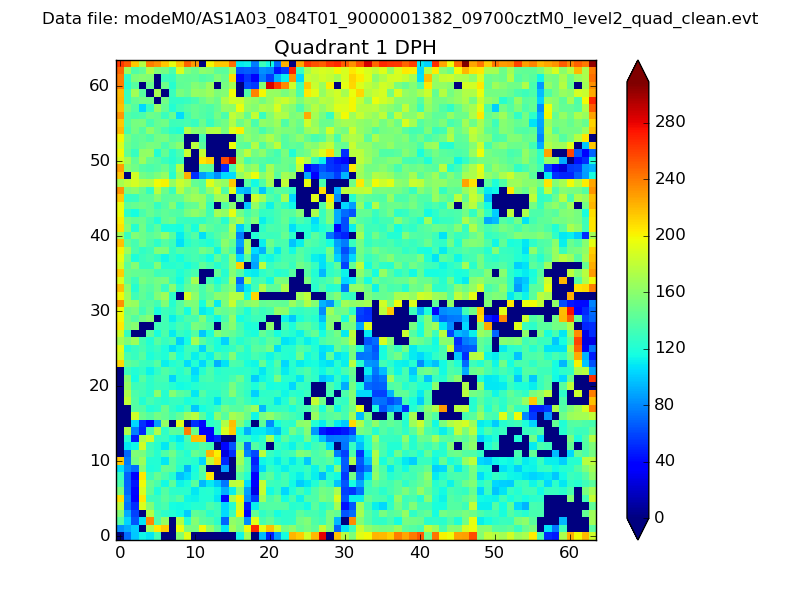
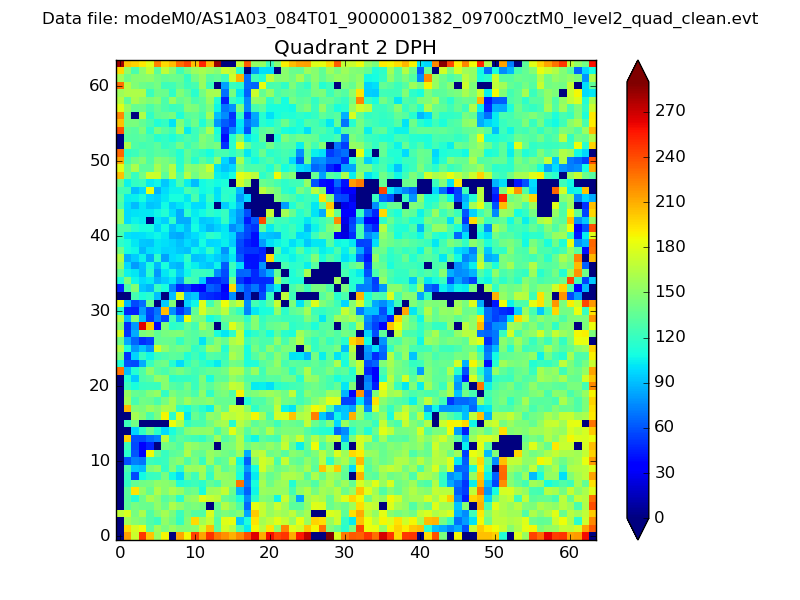
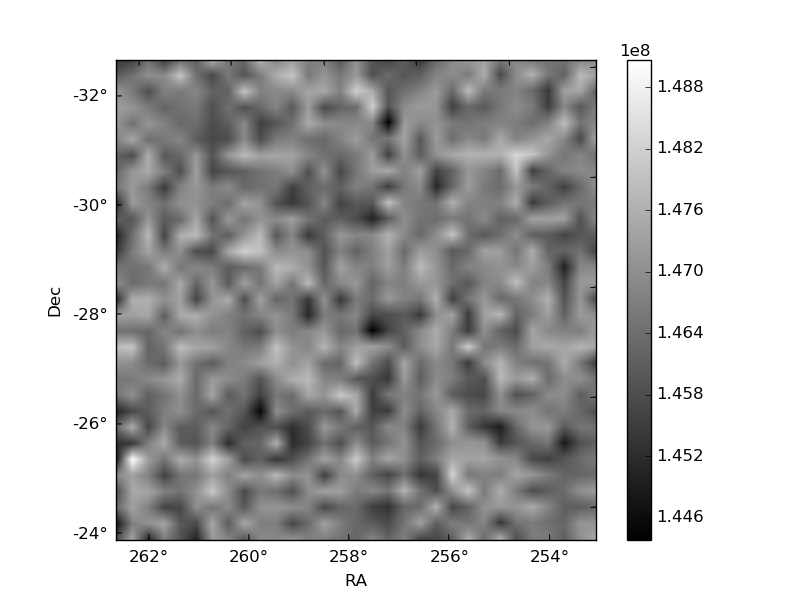
Histogram calculated using DETX and DETY for each event in the final _common_clean file
| Quadrant A |  |
 |
Quadrant B |
|---|---|---|---|
| Quadrant D | 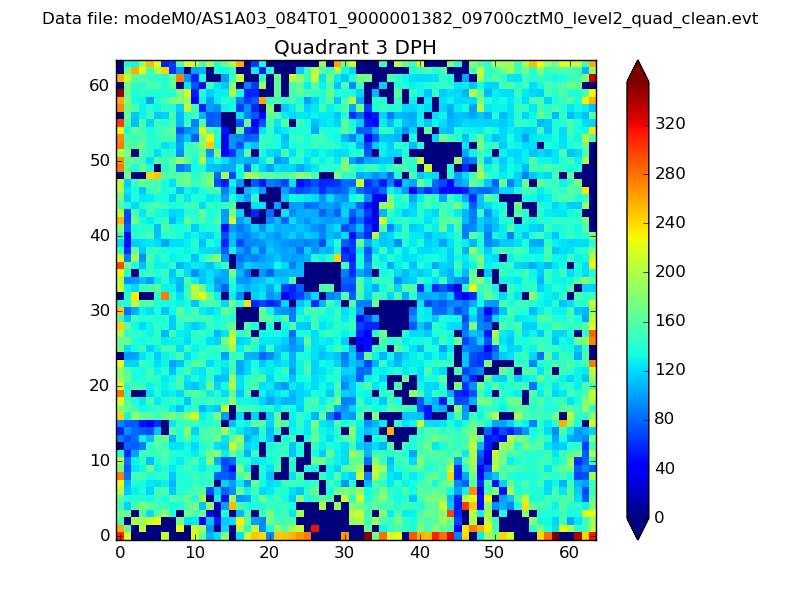 |
 |
Quadrant C |
| Plot type | Count rate plots | Images |
|---|---|---|
| Comparison with Poisson distribution Blue bars denote a histogram of data divided into 1 sec bins. Red curve is a Poisson curve with rate = median count rate of data. |
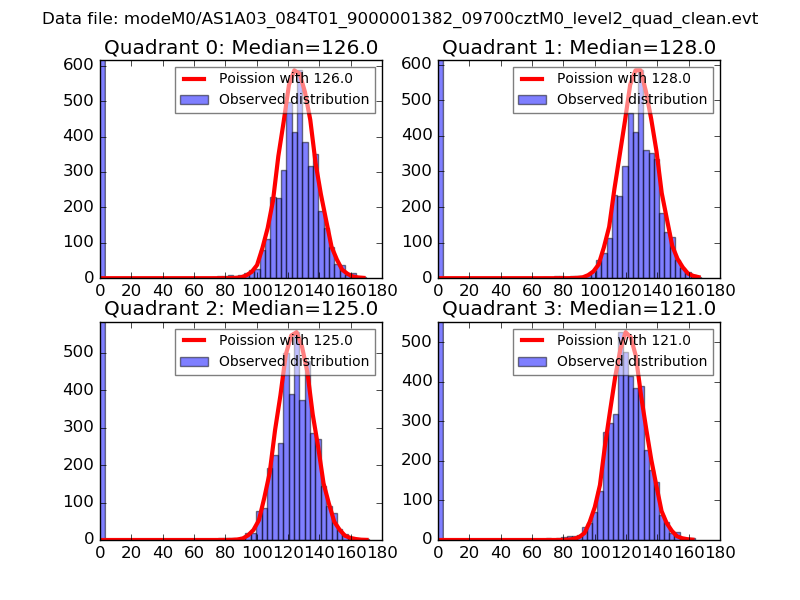 |
 |
| Quadrant-wise count rates Data is divided into 100 sec bins |
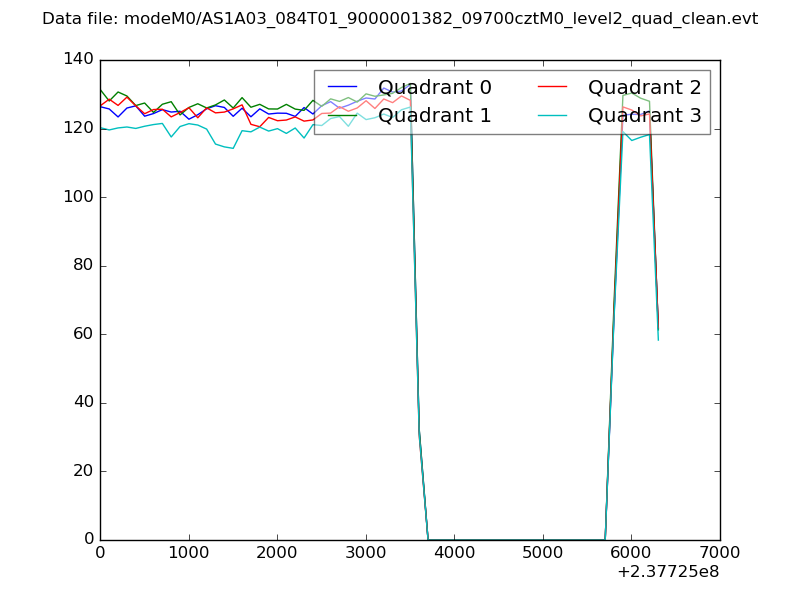 |
|
| Module-wise count rates for Quadrant A Data is divided into 100 sec bins |
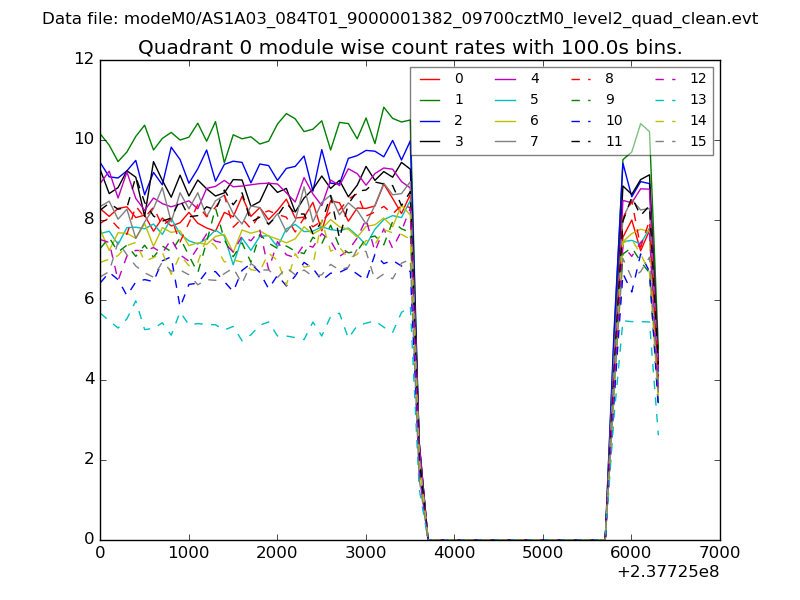 |
 |
| Module-wise count rates for Quadrant B Data is divided into 100 sec bins |
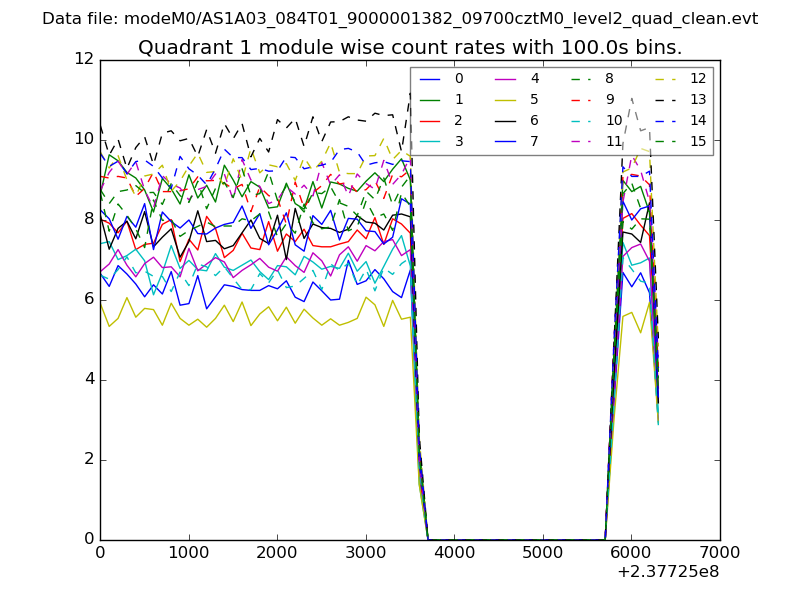 |
 |
| Module-wise count rates for Quadrant C Data is divided into 100 sec bins |
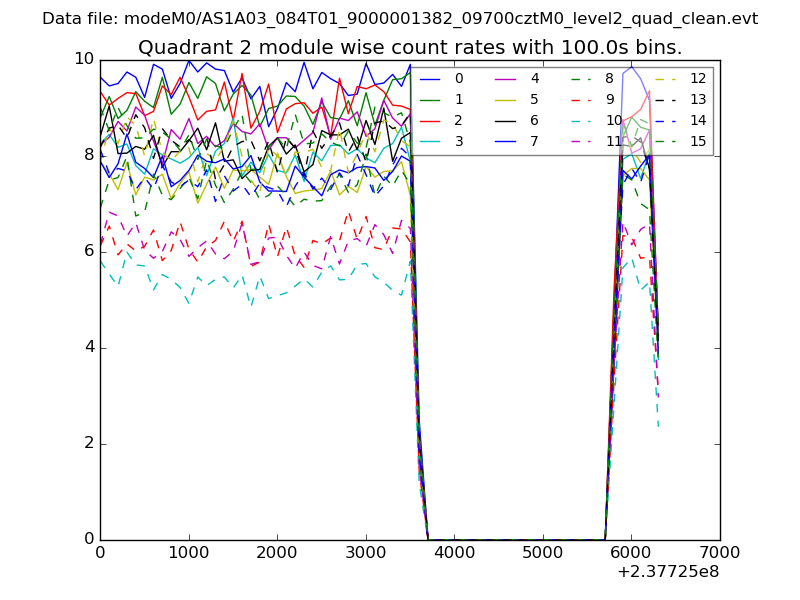 |
 |
| Module-wise count rates for Quadrant D Data is divided into 100 sec bins |
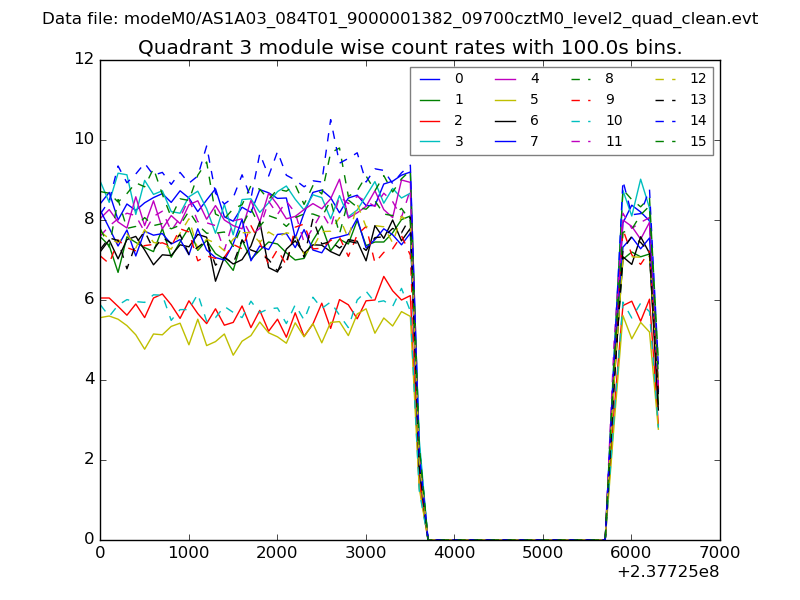 |
 |
| Parameter | Plot |
|---|---|
| CZT HV Monitor | 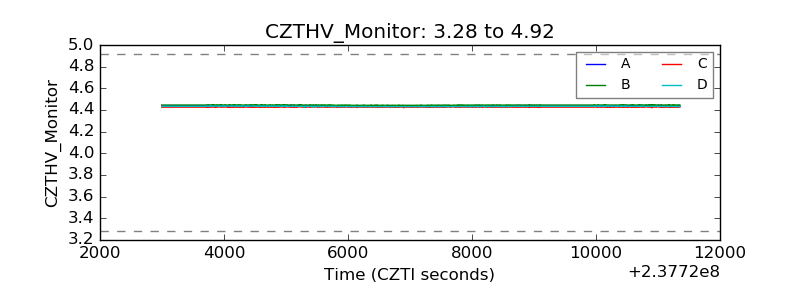 |
| D_VDD | 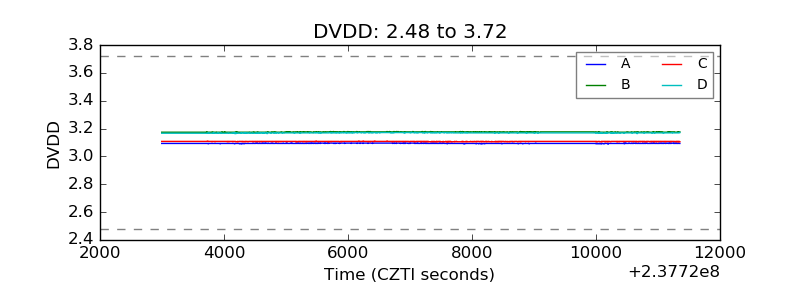 |
| Temperature 1 | 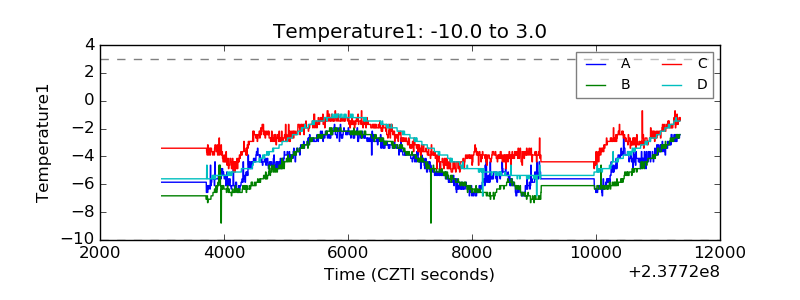 |
| Veto HV Monitor | 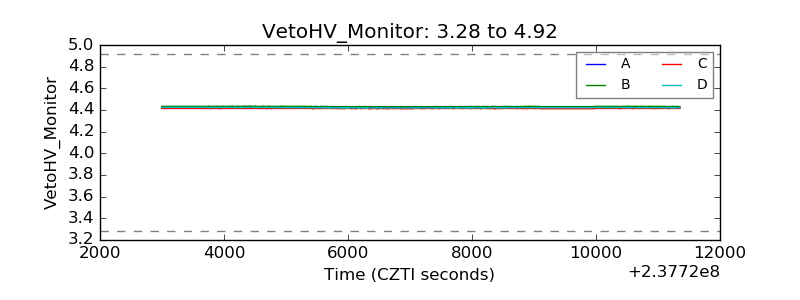 |
| Veto LLD | 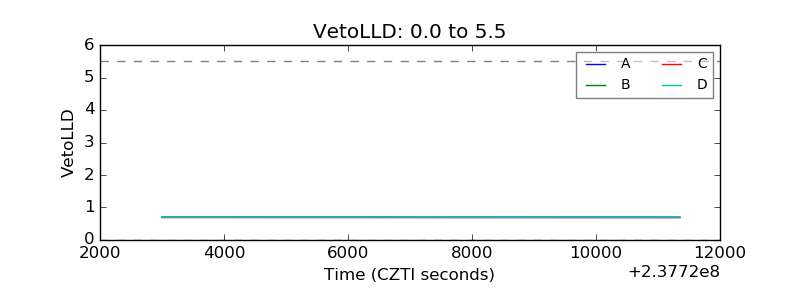 |
| Alpha Counter | 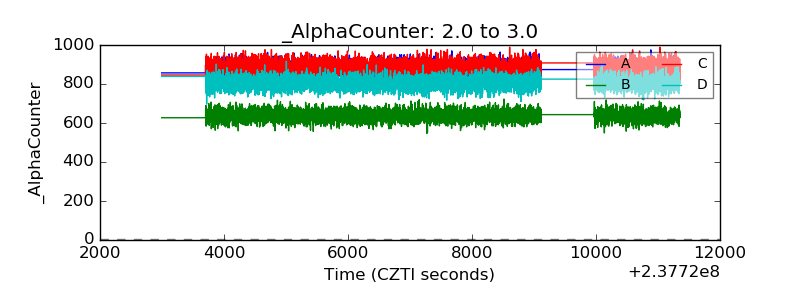 |
| _CPM_Rate | 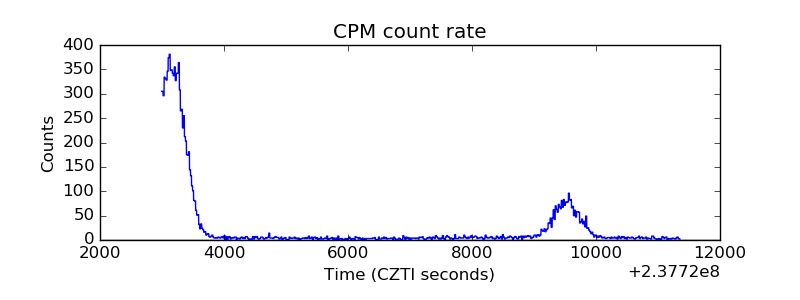 |
| CZT Counter |  |
| +2.5 Volts monitor |  |
| +5 Volts monitor |  |
| _ROLL_ROT | 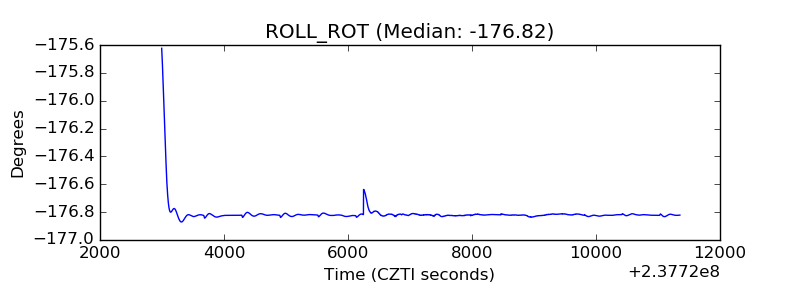 |
| _Roll_DEC | 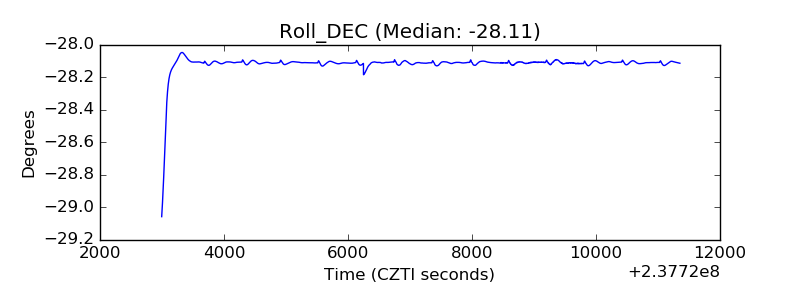 |
| _Roll_RA | 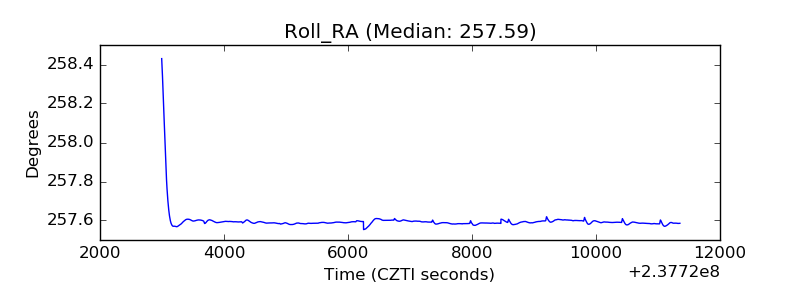 |
| Veto Counter | 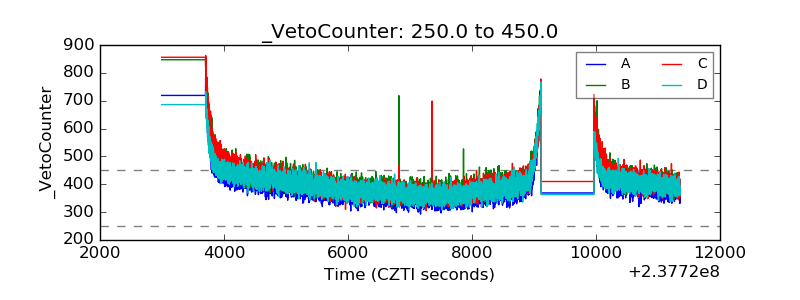 |