| Param | Original file | Final file |
|---|---|---|
| Filename | modeM0/AS1A03_084T01_9000001382_09701cztM0_level2.evt | modeM0/AS1A03_084T01_9000001382_09701cztM0_level2_quad_clean.evt |
| Size (bytes) | 493,732,800 | 87,016,320 |
| Size | 470.9 MB | 83.0 MB |
| Events in quadrant A | 3,500,411 | 546,494 |
| Events in quadrant B | 3,392,369 | 557,202 |
| Events in quadrant C | 4,134,040 | 523,968 |
| Events in quadrant D | 3,458,715 | 528,394 |
| Mode SS | |||
|---|---|---|---|
| Quadrant | BADHDUFLAG | Total packets | Discarded packets |
| A | 0 | 140 | 0 |
| B | 0 | 140 | 0 |
| C | 0 | 140 | 0 |
| D | 0 | 140 | 0 |
| Mode M0 | |||
|---|---|---|---|
| Quadrant | BADHDUFLAG | Total packets | Discarded packets |
| A | 0 | 14591 | 2 |
| B | 0 | 14444 | 1 |
| C | 0 | 16979 | 1 |
| D | 0 | 14865 | 1 |
| Mode M9 | |||
|---|---|---|---|
| Quadrant | BADHDUFLAG | Total packets | Discarded packets |
| A | 0 | 4 | 0 |
| B | 0 | 4 | 0 |
| C | 0 | 4 | 0 |
| D | 0 | 4 | 0 |
| Quadrant | Total seconds | Saturated seconds | Saturation percentage |
|---|---|---|---|
| A | 6872 | 164 | 2.386496% |
| B | 6872 | 171 | 2.488359% |
| C | 6872 | 405 | 5.893481% |
| D | 6872 | 159 | 2.313737% |
Noise dominated data is calculated using 1-second bins in cleaned event files. If a bin has >2000 counts, and if more than 50% of those come from <1% of pixels, then it is considered to be noise-dominated and hence unusable.
| Quadrant | # 1 sec bins | Bins with >0 counts | Bins with >2000 counts | High rate bins dominated by noise | Noise dominated (total time) | Noise dominated (detector-on time) | Marked lightcurve |
|---|---|---|---|---|---|---|---|
| A | 7277 | 6874 | 7 | 7 | 0.10% | 0.10% | 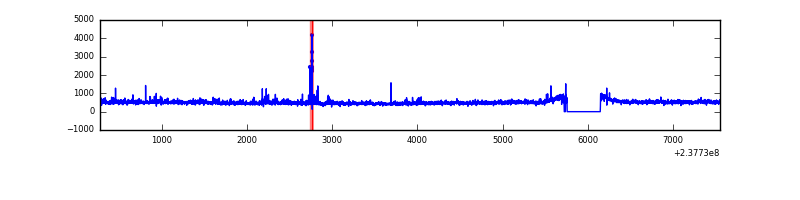 |
| B | 7277 | 6874 | 3 | 3 | 0.04% | 0.04% | 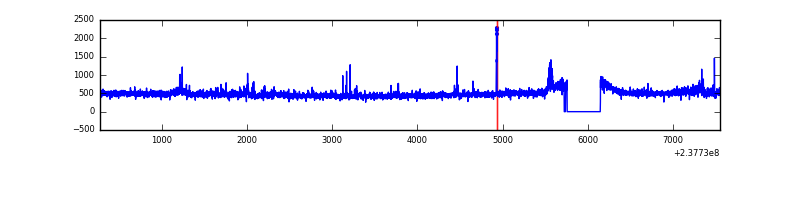 |
| C | 7277 | 6874 | 256 | 256 | 3.52% | 3.72% | 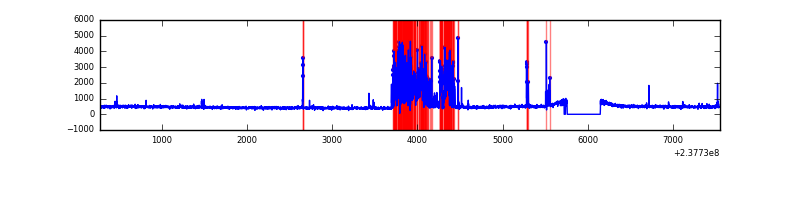 |
| D | 7277 | 6874 | 18 | 18 | 0.25% | 0.26% | 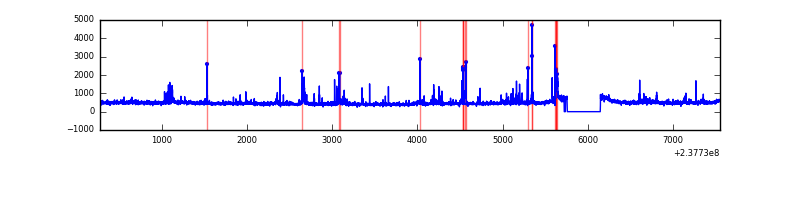 |
Top three noisy pixels from each quadrant. If the there are fewer than three noisy pixels in the level2.evt file, extra rows are filled as -1
| Pixel properties | Quadrant properties | ||||||
|---|---|---|---|---|---|---|---|
| Quadrant | DetID | PixID | Counts | Sigma | Mean | Median | Sigma |
| A | 1 | 162 | 111711 | 653.82 | 830 | 811 | 169.6 |
| A | 15 | 174 | 49147 | 284.97 | 830 | 811 | 169.6 |
| A | 1 | 178 | 41713 | 241.14 | 830 | 811 | 169.6 |
| B | 0 | 187 | 40451 | 248.87 | 831 | 811 | 159.3 |
| B | 0 | 214 | 37385 | 229.62 | 831 | 811 | 159.3 |
| B | 4 | 173 | 32743 | 200.48 | 831 | 811 | 159.3 |
| C | 14 | 234 | 1043898 | 5636.25 | 790 | 792 | 185.1 |
| C | 13 | 61 | 5825 | 27.19 | 790 | 792 | 185.1 |
| C | 9 | 237 | 4559 | 20.35 | 790 | 792 | 185.1 |
| D | 1 | 52 | 159602 | 815.0 | 801 | 781 | 194.9 |
| D | 12 | 233 | 83648 | 425.24 | 801 | 781 | 194.9 |
| D | 13 | 104 | 53449 | 270.27 | 801 | 781 | 194.9 |
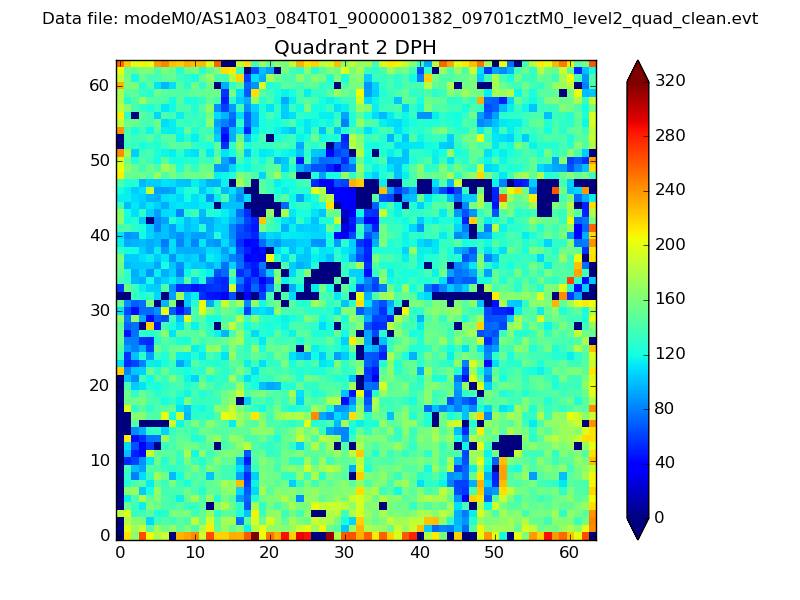
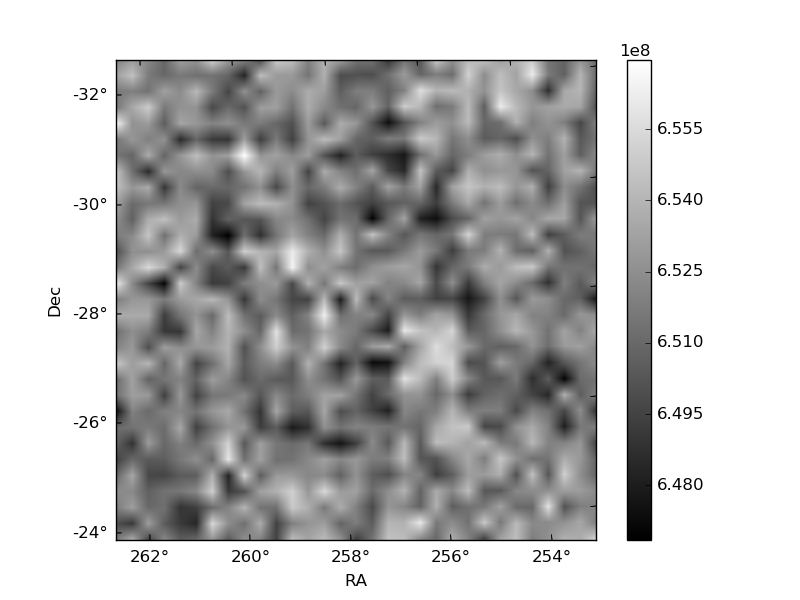
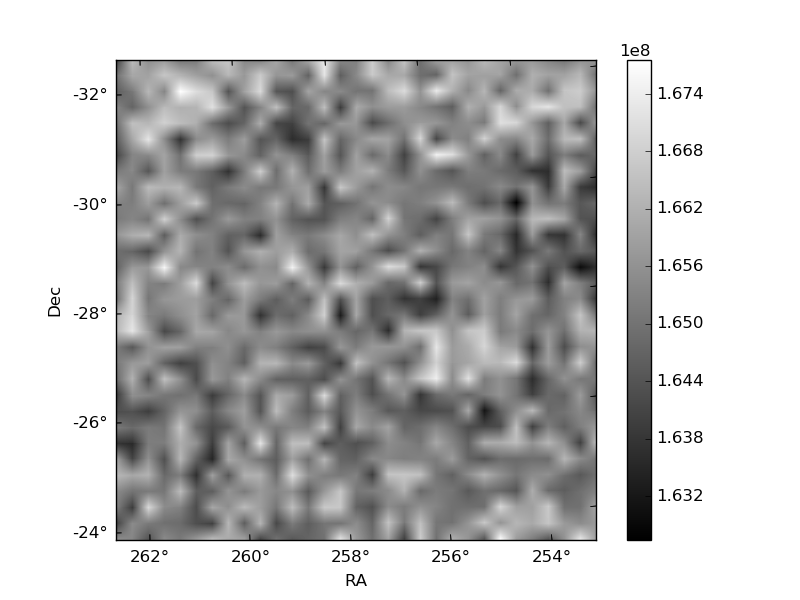
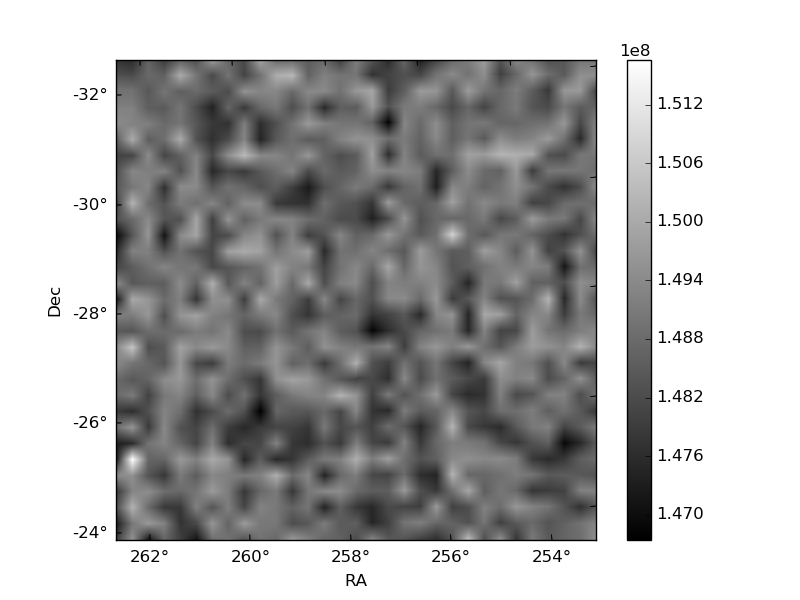
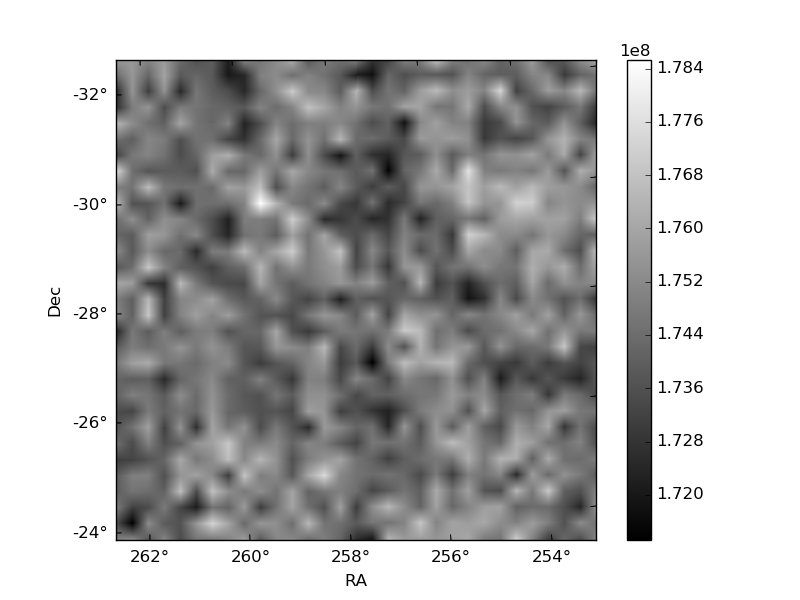
Histogram calculated using DETX and DETY for each event in the final _common_clean file
| Quadrant A | 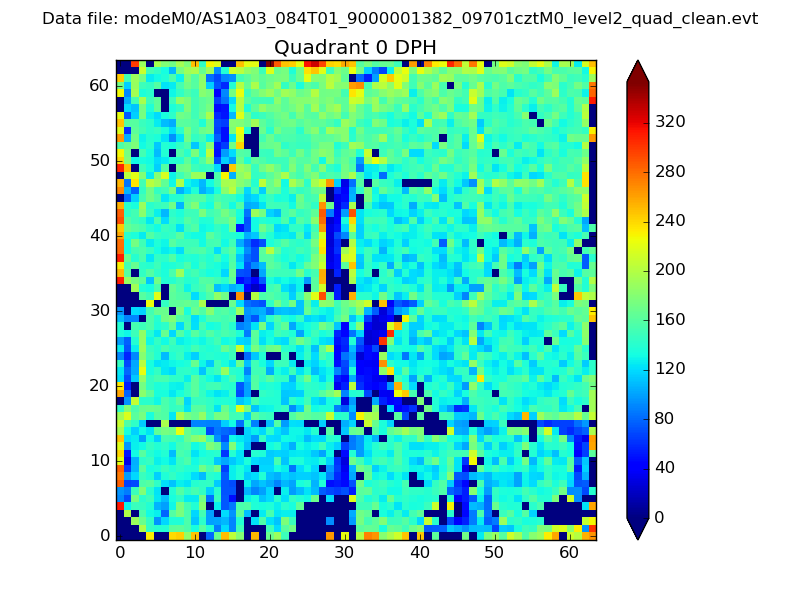 |
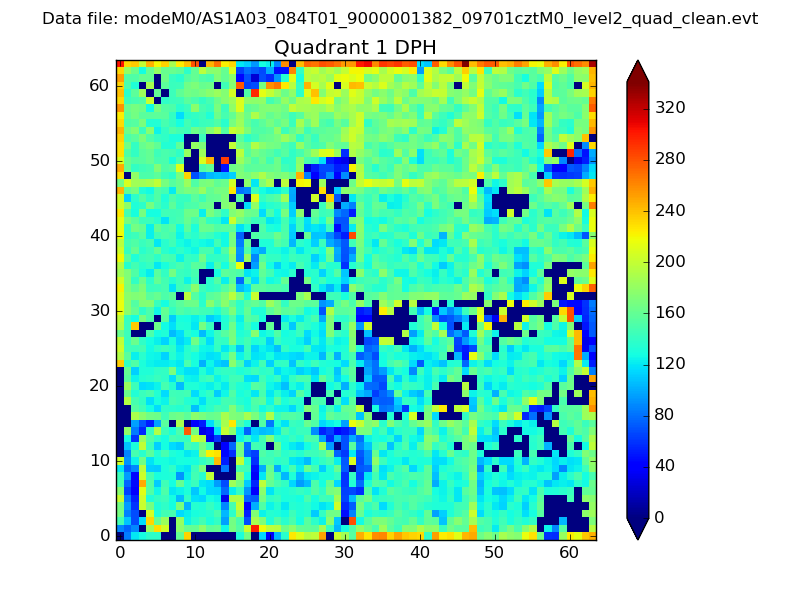 |
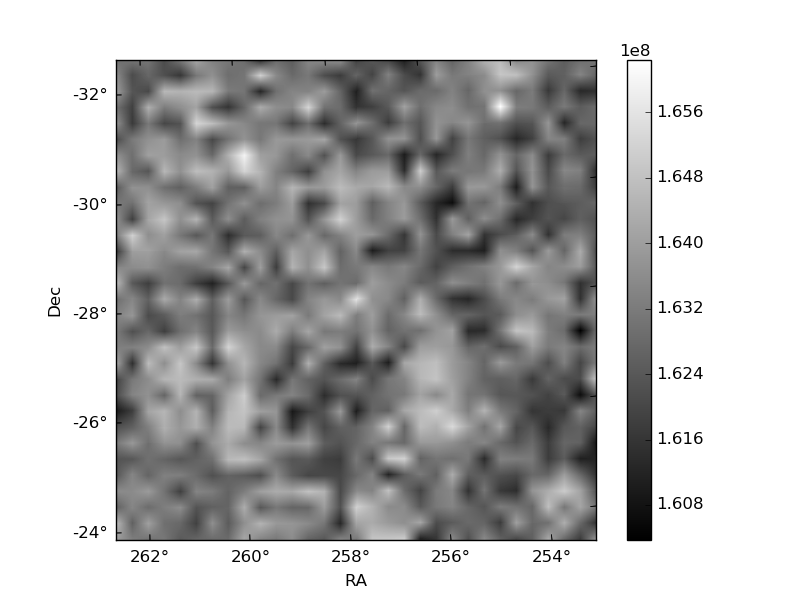
Quadrant B |
|---|---|---|---|
| Quadrant D | 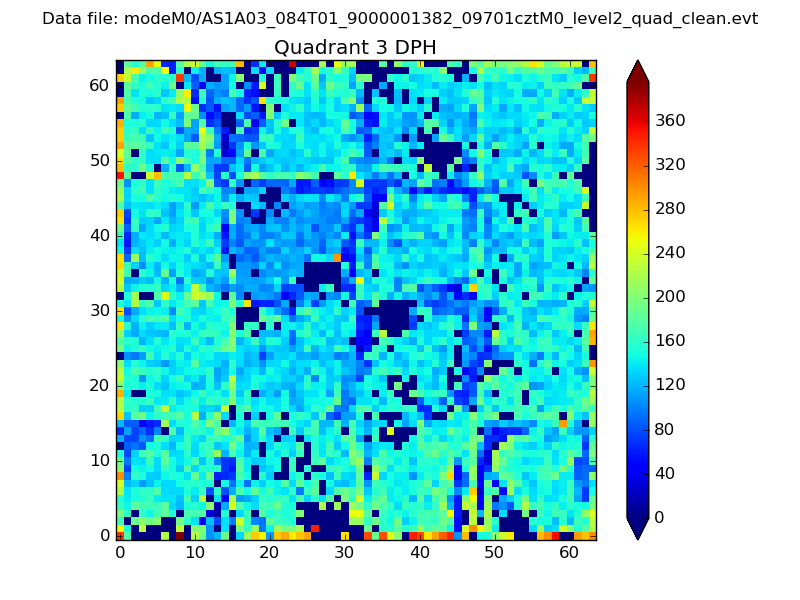 |
 |
Quadrant C |
| Plot type | Count rate plots | Images |
|---|---|---|
| Comparison with Poisson distribution Blue bars denote a histogram of data divided into 1 sec bins. Red curve is a Poisson curve with rate = median count rate of data. |
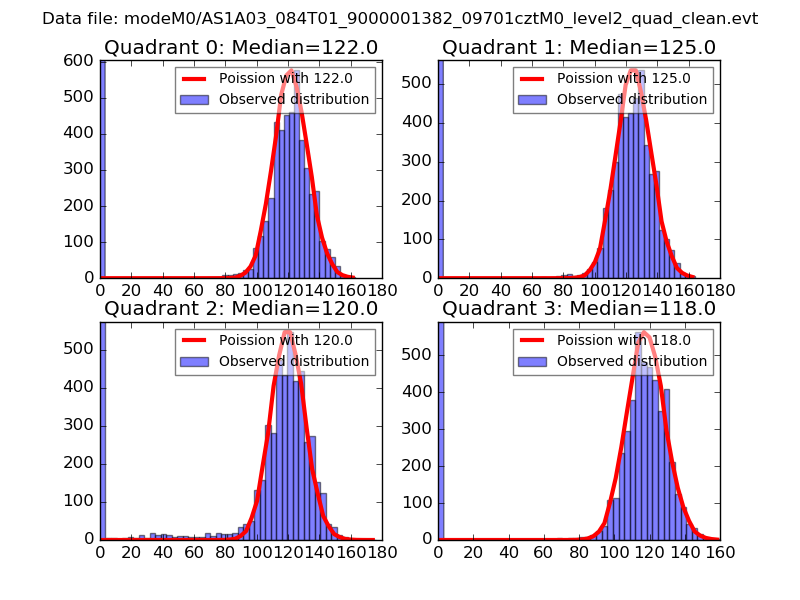 |
 |
| Quadrant-wise count rates Data is divided into 100 sec bins |
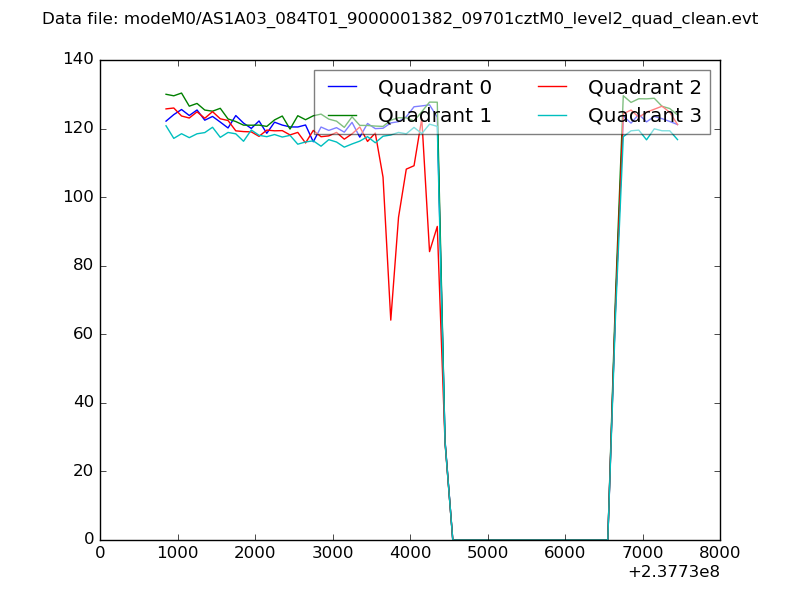 |
|
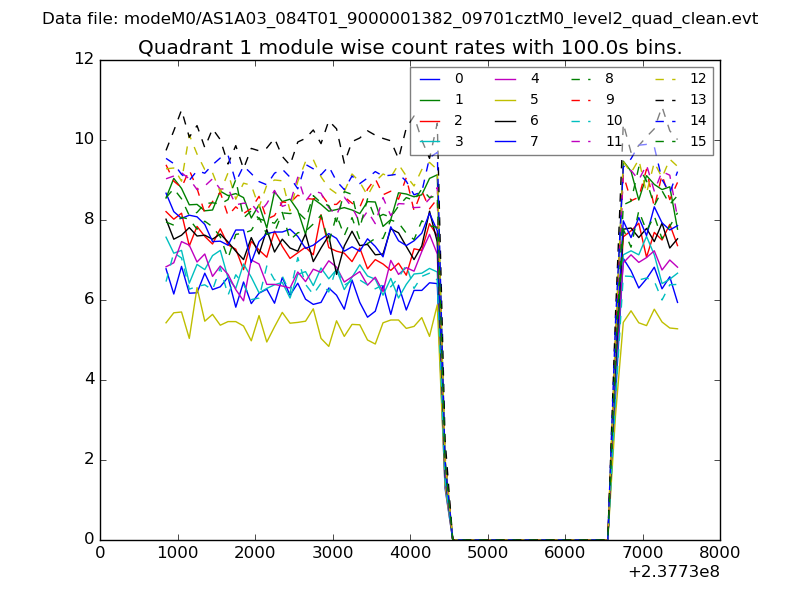
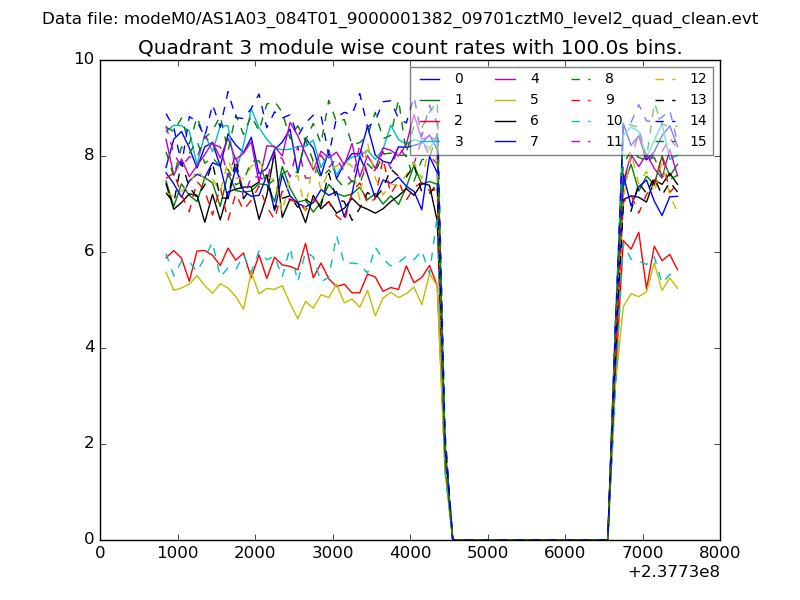
| Module-wise count rates for Quadrant A Data is divided into 100 sec bins |
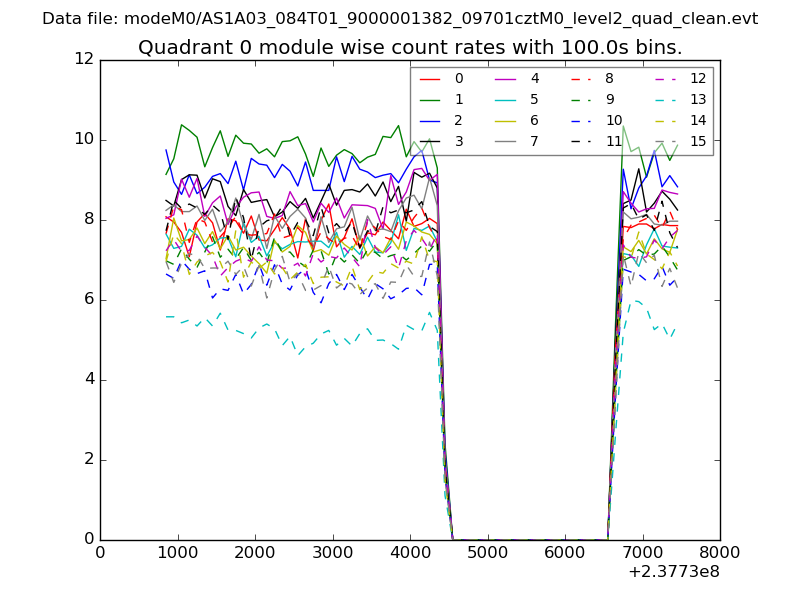 |
 |
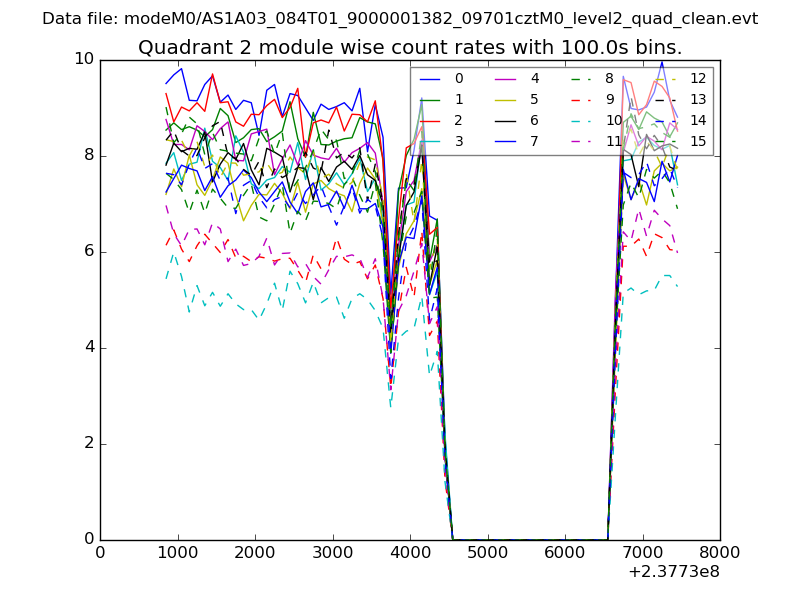
| Module-wise count rates for Quadrant B Data is divided into 100 sec bins |
 |
 |
| Module-wise count rates for Quadrant C Data is divided into 100 sec bins |
 |
 |
| Module-wise count rates for Quadrant D Data is divided into 100 sec bins |
 |
 |
| Parameter | Plot |
|---|---|
| CZT HV Monitor | 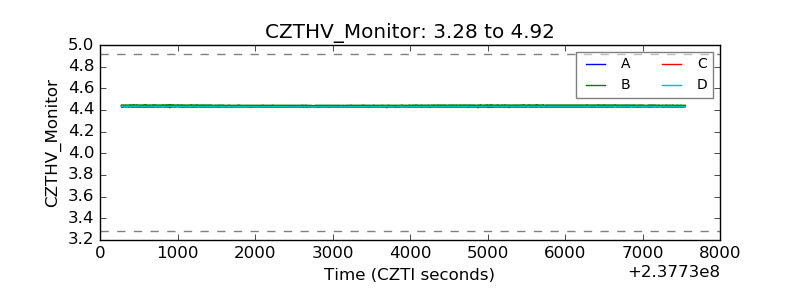 |
| D_VDD | 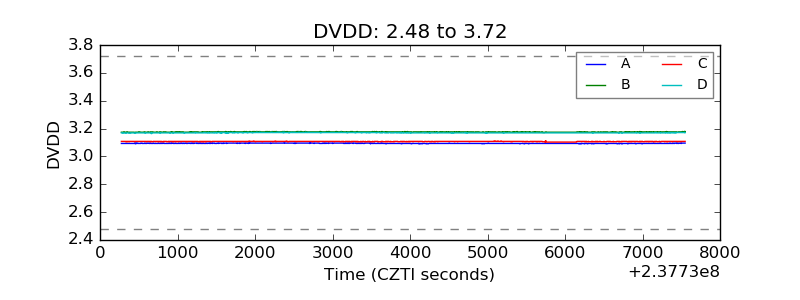 |
| Temperature 1 | 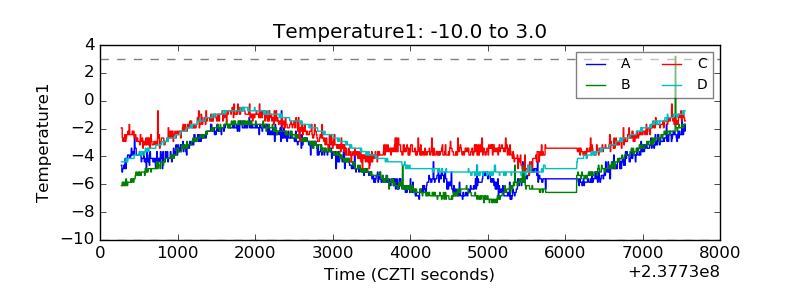 |
| Veto HV Monitor | 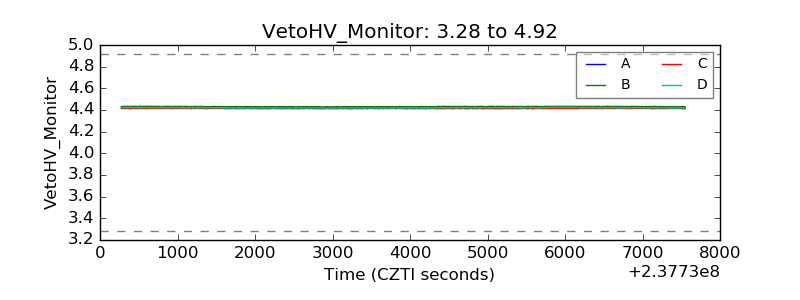 |
| Veto LLD | 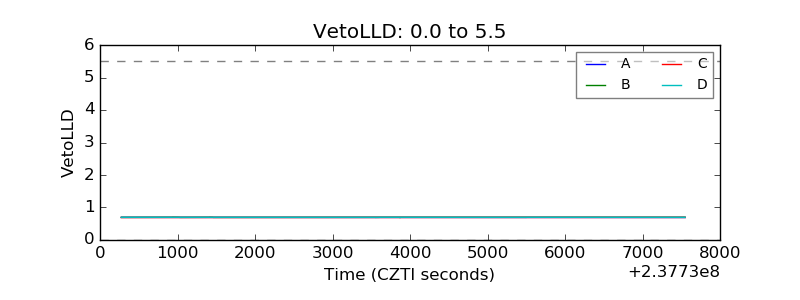 |
| Alpha Counter | 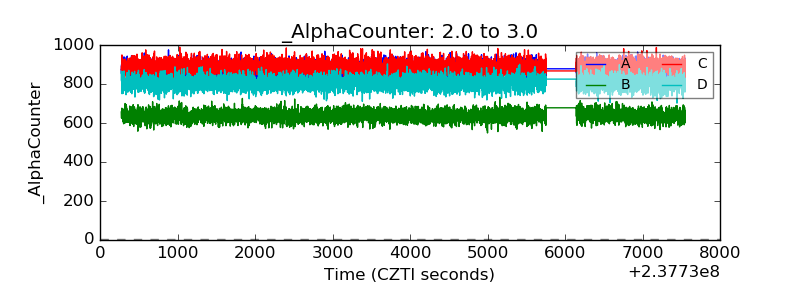 |
| _CPM_Rate | 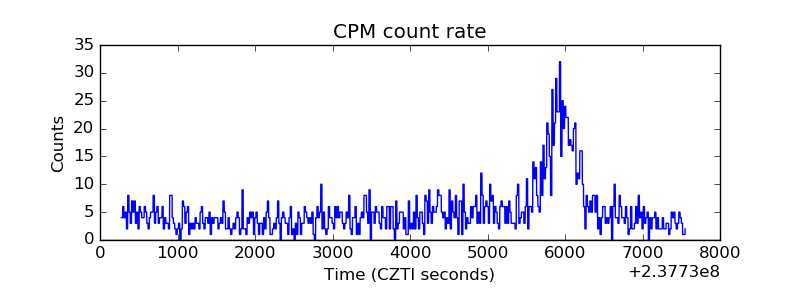 |
| CZT Counter | 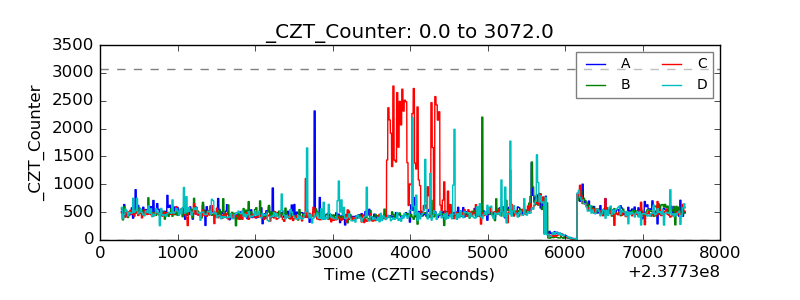 |
| +2.5 Volts monitor | 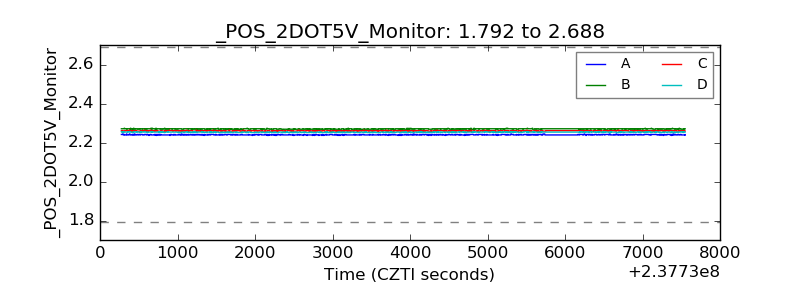 |
| +5 Volts monitor |  |
| _ROLL_ROT | 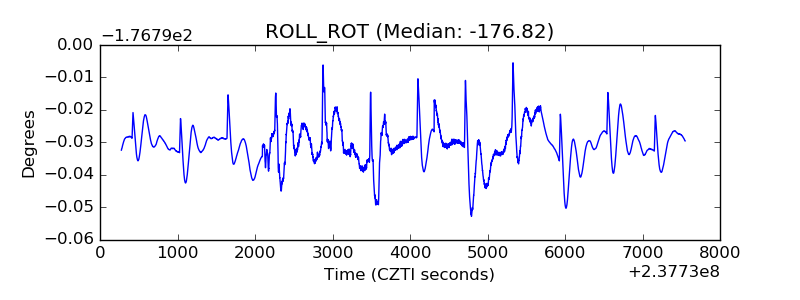 |
| _Roll_DEC | 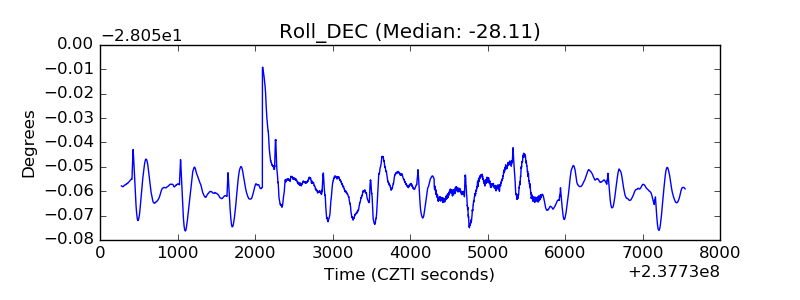 |
| _Roll_RA | 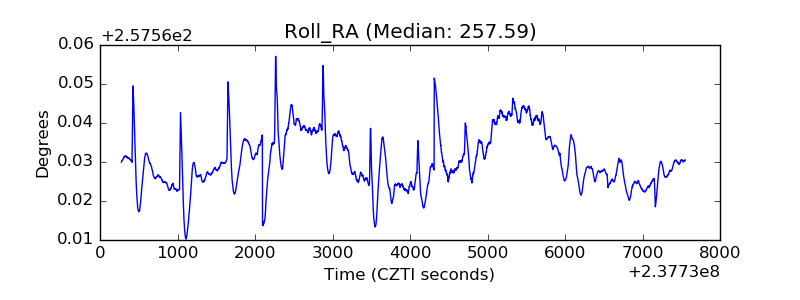 |
| Veto Counter | 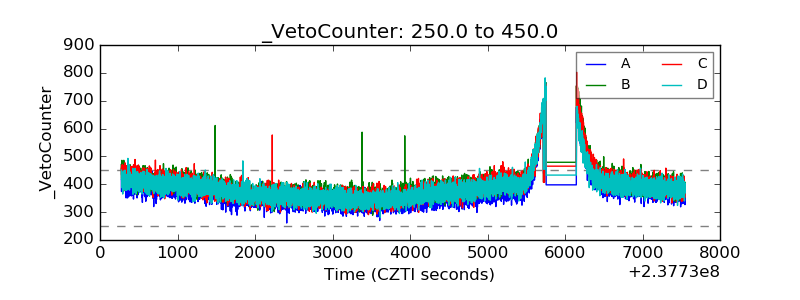 |